Journal of Theoretical and Applied Information Technology © 2005 - 2007 JATIT. All rights reserved. www.jatit.org
DECISION TREE INDUCTION USING ROUGH SET THEORY– COMPARATIVE STUDY Ramadevi Yellasiri1, C.R.Rao2,Vivekchan Reddy1 1
Dept. of CSE, Chaitanya Bharathi Institute of Technology, Hyderabad, INDIA. 2 DCIS, School of MCIS, University of Hyderabad, Hyderabad , INDIA. Email:
[email protected]
ABSTRACT Dimensional reduction has been a major problem in data mining problems. In many real time situations, e.g. database applications and bioinformatics, there are far too many attributes to be handled by learning schemes, majority of them being redundant. Taking predominant attributes reduces the dimensions of the data, which in turn reduces the size of the hypothesis space, allowing classification algorithm to operate faster and more efficiently. The Rough Set (RS) theory is one such approach for dimension reduction. RS offers a simplified search for predominant attributes in datasets. Rough Set based Decision Tree(RDT) is constructed based on the predominant attributes. The comparative analysis with the existing decision tree algorithms was made to show that the intent of RDT is to improve efficiency, simplicity and generalization capability. Keywords: Rough Sets, Predominant Attributes Composite Reduct, RDT and GPCR.
1. INTRODUCTION The theory of rough sets provided by Z.Pawlak is an important mathematical tool for Computer Technology. It is involved in several decision-makings, data mining, knowledge representation, knowledge acquisition and many more applications. A basic problem for many practical applications of the rough sets is defining a method for efficient selection of the set of attributes (features) necessary for the classification of objects in the considered universe. These knowledge reduction problems are highly involved in Information Systems. In general, any information system consists of several attributes. In process, it is tedious to recall each attribute every time. So, it is necessary to avoid the redundant attributes as well as to pick up the minimal feature. This minimal feature is called a reduct, which can be computed using rough sets. In 1991, by using discernibility matrices, the method of computing reducts was described by Skowron. However, this method cannot list all possible reducts of the information system. In 1999, Starzyk gave an algorithm to list all reducts of the given information system. In this paper, the
predominant attributes were found using val theory, which were equivalent to reducts. The decision tree is constructed based on the predominant attributes. In our work we used G-Protein Coupled Receptor data set for extracting the minimal features. These features were used for constructing decision tree and decision rules were generated. A comparative analysis with other Decision Tree induction Algorithms is made. This paper is organized as follows. Section 2 introduces the concept of Rough set theory and Decision Tree. Section 3 presents Reduct based decision tree (RDT) algorithm with illustrations. An implementation detail of the algorithm on G-Protein Coupled Receptor (GPCR) dataset is given in section 4. Finally, we conclude the paper with comparative Analysis in section 5. 2. ROUGH SETS (RS) AND DECISION TREE (DT) 2.1 Rough Sets (RS) In 1982, Pawlak introduced theory of rough sets. In 1985, he derived rough dependency of attributes in information systems. Some of the concepts of RS are given below:
110
Journal of Theoretical and Applied Information Technology © 2005 - 2007 JATIT. All rights reserved. www.jatit.org
2.1.1 Knowledge Base In rough set theory, a decision table is denoted by T = (U, A, C, D), where U is universe of discourse, A is a set of primitive features, and C, D ⊂ A are the two subsets of features that are called condition and decision features, respectively. Let a ∈ A, P ⊆ A. A binary relation IND (P), called the Indiscernibility relation, is defined as follows: IND (P) = {(x, y) ∈ U x U: for all a ∈ P, a (x) = a (y)} Let U/ IND (P) denote the family of all equivalence classes of the relation IND (P). For simplicity of notation U/P will be written instead of U/ IND (P). Equivalence classes U/IND(C) and U/IND (D) will be called condition and decision classes, respectively. Let R⊆ C and X ⊆ U,
CORE (C) denotes the set of all features indispensable in C. We have CORE (C) = ∩ RED(C) where RED(C) is the set of all reducts of C. 2.1.4 Discernibility matrix: Matrix entries for a pair with different decision value is list of attributes in which the pair differs. Example 2: The discernibility matrix corresponding to the sample database shown in table 1 with U ={x1, x2,..,x7} C ={a, b, c, d} , D = {E} is shown in table 2. M(X1, X3) = ( b,c,d) a b c d E X1 1 0 2 1 1 X2
1
0
2
0
1
X3
1
2
0
0
2
X4
1
2
2
1
0
R X = ∪{Y ∈ U/R: Y ⊆ X} and R X = ∪{Y ∈ U/R: Y∩X ≠ Φ}
X5 X6
2 2
1 1
0 1
0 0
2 2
Here RX and RX are said to be R-lower and R-
X7
upper approximations of X and (RX, RX) is called R-rough set. If X is R-definable then
X1
RX= RX otherwise X is R-Rough. The boundary BNR(X) is defined as BNR(X)=
X2
RX - RX. Hence, if X is R-definable, then BNR(X)=Φ. Example 1: Consider the universe of discourse U={a,b,c,d,e,f} and R be any equivalence relation in IND(K) which partitions U into {{a,b,d},{c,f},{e}}. Then for any subset
X3
X={a,b,c,d} of U, RX={a,b,d} and RX ={a,b,c,d,f}. Hence, BNR(X)={c,f}. Hence, the R-positive region of X is {a,b,d} and the Rnegative region of X is {e}. On the other hand, consider a subset Y={c,e,f}.
X7
Here, RY={c,e,f} and R Y ={c,e,f}. Therefore, BNR(Y)=Φ. Hence, Y is said to be R-definable. 2.1.2 Dispensable and Indispensable Features Let c ∈ C. A feature c is dispensable in T, if POS (C-(c)) (D) = POS C (D); otherwise feature c is indispensable in T. c is an independent if all c ∈ C are indispensable 2.1.3 Reduct and CORE Reduct. A set of features R ⊆ C is called a reduct of C, if T’ = {U, A, R, D} is independent and POSr (D). In other words, a reduct is the minimal feature subset preserving the above condition.
2 1 2 1 1 Table 1: A sample database
X4
X2
X3
X4 X5 X6
b,c,d b,c b
b,d
c,d
X5 a,b,c,d a,b,c
-
a,b,c,d
X6 a,b,c,d a,b,c
-
a,b,c,d -
-
-
a,b,c,d
a,b
c,d c,d
Table 2: Discernibility matrix for data in Table 1 Reduct are {b ,c} and {b ,d} CORE = {b} Selecting an optimal reduct R from all subsets of features is not an easy work. Considering the combinations among N features, the number of possible reducts can be 2N. Hence, selecting the optimal reduct from all of possible reduct from all of possible reducts is NP-hard. 2.2 Decision Tree construction A Decision Tree is typically constructed recursively in a top-down manner. If a set of labeled instances is sufficiently pure, then the tree is a leaf, with the assigned label being that of the most frequently occurring class in that set. Otherwise, a test is constructed and placed into an internal node that constitutes the tree so far. The test defines a
111
Journal of Theoretical and Applied Information Technology © 2005 - 2007 JATIT. All rights reserved. www.jatit.org
partition of the instances according to the outcome of the test as applied to each instance. A branch is created for each block of the partition, and for each block, a decision tree is constructed recursively. A decision tree can be pruned, i.e. restricting the growth of the tree before it occurs. If the test at the node is done based on just one variable, it is called univariate test, otherwise it is multivariate test. Traversing the tree from root to different leaf nodes will generate different decision rules. The path from root to each leaf is one decision rule. 3 REDUCT BASED DECISION TREE (RDT) RDT algorithm mainly consists of two important steps i.e., Reduct Computation and Decision Tree Construction. It combines the merits of both Rough Sets and Decision Tree induction algorithm, thus improving efficiency, simplicity and generalization capability of both the base algorithm. Datasets can be discrete or continuous, in our work we experimented with discrete type; therefore continuous attributes are discretized using any available discretization algorithms like BROrthogonal Scalar, Boolean reasoning etc. Minz and Jain in their work, a hybridized approach for constructing RDT discretized the data using the method used in Rosetta Software. 3.1 The RDT Algorithm In the RDT Algorithm, the decision table is given as input and predominant attributes called reduct is obtained as output. If the data is large, vertical fragmentation is to be done and RDT can be applied to each fragment after adding the decision attribute. The predominant attributes for all fragments are obtained and they are grouped together with fragment information and decision attribute. To this RDT Algorithm is once again applied giving rise to, a new set of attributes called composite reduct. Reduct Computation Algorithm (RCA) Algorithm Reduct Computation (input: binary decision table; output: reduct) 1. The decision table is read as input with the first column as decision column. 2. Sort the rows to get the row with the least decision attribute value on top, i.e., arrange rows in ascending order (of the decision attribute) 3. The next step is to generate a Boolean matrix for a given decision table. For this
purpose, we check if the first element of the first column in the decision table is equal to second element of the first column. If the answer is “yes” then proceed to the next successive element along the same column until the answer is “no”. If the answer is “no” then assign value “1” to the corresponding entry in the Boolean matrix. Start comparing both the rows for corresponding column elements. If the column elements are same, assign “0” value otherwise assign “1” to the matrix. In a nutshell for the pair of rows in decision table having different decision attribute values, a row is generated in Boolean matrix. 4. Repeat step 3 for the second, third,.., N elements of the first column and compare with all the rest of the elements, by comparing one pair of rows at a time, and repeat this procedure till all the columns in the decision table are exhausted to construct the Boolean matrix. 5. The columns of Boolean matrix are then summed up. The column with maximum sum is picked up as a predominant attribute. 6. Take original Boolean matrix and remove those rows from it with ”1” in the column corresponding to the predominant attribute selected in step 5, resulting in a reduced Boolean matrix. 7. Steps 5 and 6 are repeated until a) The sum of columns of the reduced Boolean table are “0” s, which means to say that we don’t have sufficient information regarding the system to achieve crisp discrimination OR b) The reduced Boolean matrix is a null matrix, meaning that the set of predominant attributes obtained produces crisp rule set for discrimination. 8. These predominant attributes are grouped together and referred to as “ reduct”. RDT Algorithm Algorithm RDT (input: Training Dataset T1; output: Decision Rules) 1. Input the training dataset T1, 2. Discretize the continuous attributes if any and label the new dataset as T2, 3. Compute reduct of T2, say R using RCA. 4. Reduce T2 based on reduct R and label reduced dataset as T3 5. Construct decision tree on T3 with reduct R, taking one attribute at a time and using it for splitting all nodes at same level. 6. Generate the Rules by traversing all the paths from the root to the leaf node in the decision tree.
112
Journal of Theoretical and Applied Information Technology © 2005 - 2007 JATIT. All rights reserved. www.jatit.org
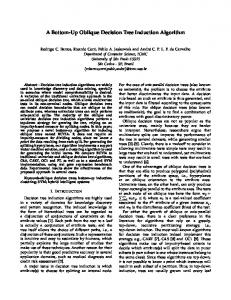
3.2 Complexity of RDT RDT consists of two steps mainly Reduct computation and Decision tree construction. Complexity of the RDT depends on the complexity of Reduct computation algorithm and DT construction algorithm. If the training data consists of n instances and m attributes, then calculate the minimal length reduct is NP-Hard]. The computational cost of the preprocessing the training data and sorting the data is O (n2) sets of length O (m) corresponding to the discernibility function. C (N, 2) comparisons are required and if it is with m attributes the complexity will be of order O (mn2). The complexity of a decision tree depends upon the splitting attribute values, thus tree constructed may be m-ary tree.
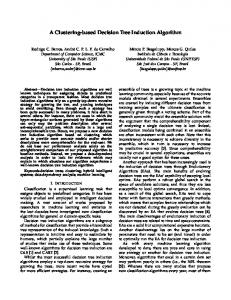
explored. RDT application on discrete data and fivefold test shows that it is better than ID3 in terms of efficiency and complexity. RDT has to be applied on continuous or categorical data. Noise effects and their elimination have to be studied. From the graphs, it is observed that for two out of four datasets the average accuracy is highest corresponding to RDT followed by that of ID3, C4.5 and CART, The average complexity is lowest for sunburn and fruit datasets. The average accuracy of RDT is equal to CART algorithm for fruit and protein datasets. The results from the experiments on these small datasets suggests that RDT can serve as a model for classification as it generates simpler rules and remove irrelevant attributes at a stage prior to tree induction.
4. IMPLEMENTATION OF RDT Set Set 1 Set 2 Set 3 Set 4 Set 5
GPCR is a protein sequence, it consists of 3896 sequences, which are divided into 5 classes(Class A,B,C,D & E) . A sample GPCR dataset were considered for the implementation of RDT. The Spatial Analysis with different character as center is performed on the dataset and then discretized based on threshold (T). The potential for discriminating the features is lost when all the entries of the matrix is 1. The decision attribute is added as the first column for the resultant binary association matrix and RCA is executed. Reducts are generated taking into consideration different centers for the same dataset. These reducts of different centers are used for the generation of the corresponding decision trees. The less frequent occurring character is taken as center and spatial analysis is performed in our experiment. Four Different datasets like weather dataset, sunburn dataset, fruit dataset and GPCR dataset were considered for experimentation, Then RDT algorithm is executed and rules are generated. Five fold tests was performed on the dataset and result as shown below in Table 3. The comparisons of the result with ID3,C4.5, CART and RDT of the dataset is shown in Figure 1. and Figure 2.
Correctedly classified RDT ID3 80% 78%
misclassified RDT 20%
ID3 22%
80%
81%
20%
19%
82%
80%
18%
20%
84%
84%
16%
16%
82%
80%
18%
20%
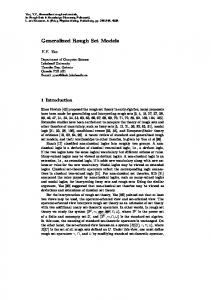
Table 3 Results of Five fold test of GPCR dataset Accuracy
Percentage
100
0
Sun ID3
50 Weather C4.5
Fruit
Protein
CART
5. CONCLUSIONS RDT combines the efficiency of RS and DT induction. Predominant attributes are used for reducing the data size. Vertical fragmentation of data to obtain composite reducts is to be
Figure 1 Comparison of ID3, C4.5, CART and RDT algorithms with respect to average accuracy
113
RDT
Journal of Theoretical and Applied Information Technology © 2005 - 2007 JATIT. All rights reserved. www.jatit.org
[7]. [Ramadevi ,2006] Ramadevi Y, C.R.Rao Knowledge Extraction Using Rough Sets – Gpcr – Classification, International conference on Bioinformatics and diabetes mellitus, India, 2006.
Complexity 2 0 1 5
[8]. [Skowron,1991] Skowron A. and C. Rauszer, The discernibility matrices and functions in information systems, Fundamenta Informaticae 15(2), pp.331-362, 1991.
1 No of 0 selectors 5
0 Sun
Weathe r
ID 3
C4. 5
Frui t CAR T
Protei n RD T
[9]. [Starzyk,1999] Starzyk J, Nelson D.E., Sturtz K, Reduct Generation in Information Systems, Bulletin of International Rough Set Society, 3 (1/2), 1999.
Figure 2 Comparison of ID3, C4.5, CART and RDT algorithms with respect to average complexity
REFERENCES [1]. [C.R.Rao, 1999] C.R.Rao and P.V.Kumar. Functional Dependencies through Val, ICCMSC ’99, India, TMH publications 116-123, 1999. [2]. [Ganesan,2005] Ganesan G, Raghavendra Rao C., Latha D., An overview of rough sets, proceedings of the National Conference on the emerging trends in Pure and Applied Mathematics, Palayamkottai, India, pp: 70-76, 2005 [3]. [Han,2001] Han J and Kamber M, Data Mining: Concepts and Techniques, Morgan Kaufmann, 2001 279-325. [4]. [Pawlak,1982] Zdzislaw Pawlak, Rough sets, International Journal of Computer and Information Sciences, 11, 341-356, 1982. [5]. Pawlak,1991] Zdzislaw Pawlak, Rough Sets-Theoretical Aspects and Reasoning about Data, Kluwer Academic Publications, 1991 [6]. [Quinlan, 1986] Quinlan J.R. Induction of decision trees. Machine Learning 1 81-106.
114