energies Article
Defect Pattern Recognition Based on Partial Discharge Characteristics of Oil-Pressboard Insulation for UHVDC Converter Transformer Wen Si 1,2 ID , Simeng Li 1,2 and Tongqiao Zhang 3 1 2 3
*
ID
, Huaishuo Xiao 1,2
ID
, Qingquan Li 1,2, *, Yalin Shi 3
Department of Electrical Engineering, Shandong University, Jinan 250061, China;
[email protected] (W.S.);
[email protected] (S.L.);
[email protected] (H.X.) Shandong Provincial Key laboratory of UHV Transmission Technology and Equipments, #17923 Jingshi Road, Jinan 250061, China Jinan Power Supply Company of State Grid Shandong Electric Power Company, #238 Luoyuan Road, Jinan 250012, China;
[email protected] (Y.S.);
[email protected] (T.Z.) Correspondence:
[email protected]; Tel.: +86-531-8169-6115
Received: 5 February 2018; Accepted: 7 March 2018; Published: 8 March 2018
Abstract: The ultra high voltage direct current (UHVDC) transmission system has advantages in delivering electrical energy over long distance at high capacity. UHVDC converter transformer is a key apparatus and its insulation state greatly affects the safe operation of the transmission system. Partial discharge (PD) characteristics of oil-pressboard insulation under combined AC-DC voltage are the foundation for analyzing the insulation state of UHVDC converter transformers. The defect pattern recognition based on PD characteristics is an important part of the state monitoring of converter transformers. In this paper, PD characteristics are investigated with the established experimental platform of three defect models (needle-plate, surface discharge and air gap) under 1:1 combined AC-DC voltage. The different PD behaviors of three defect models are discussed and explained through simulation of electric field strength distribution and discharge mechanism. For the recognition of defect types when multiple types of sources coexist, the Random Forests algorithm is used for recognition. In order to reduce the computational layer and the loss of information caused by the extraction of traditional features, the preprocessed single PD pulses and phase information are chosen to be the features for learning and test. Zero-padding method is discussed for normalizing the features. Based on the experimental data, Random Forests and Least Squares Support Vector Machine are compared in the performance of computing time, recognition accuracy and adaptability. It is proved that Random Forests is more suitable for big data analysis. Keywords: UHVDC transmission system; converter transformer; oil-pressboard insulation; combined AC-DC voltage; defect pattern recognition; partial discharge; random forests
1. Introduction With the rapid growth of electricity consumption, in many countries and regions around the world, there is an imbalance between electricity load and power generation. The advantages of the UHVDC transmission system in terms of high capacity and low loss are evident when the energy should be delivered from the remote power generation areas to the load-intensive areas over long distance. Especially in countries such as China and Brazil which are large in area and have uneven population distribution, in addition to fossil-fuel power generation, new energy sources such as wind and solar power generation bases are located far away from large cities, therefore, the development of UHVDC transmission system is more rapid in these places [1,2]. As a key apparatus in HVDC
Energies 2018, 11, 592; doi:10.3390/en11030592
www.mdpi.com/journal/energies
Energies 2018, 11, 592
2 of 19
transmission system, convertor transformer takes critical operating responsibilities, so its operating status recognition is particularly important to prevent insulation failure [3]. The valve winding of the converter transformer has to withstand combined AC-DC voltage [4]. Partial discharge (PD) is a discharge phenomenon that can reflect the insulation failure process, and the discharge characteristics of different defect models under different voltage forms are not the same [5,6]. The PD characteristics of pure AC and DC voltage have been widely investigated, but the study on PD characteristics under combined AC-DC voltage is not deep enough. Therefore, the PD behavior of typical defects in oil-pressboard insulation under combined AC-DC voltage and the application ways to reflect the insulation state of the converter transformer are significant topics. With regard to research on PD characteristics, there are two main research directions including PD development stages recognition and PD pattern recognition. The PD characteristics of the whole process from the beginning to the breakdown are important to the research on the division and recognition of PD development stages, which is based on a single type defect model. Artificial Neural Network (ANN), Fuzzy Cluster (FC) analysis and Least Squares Support Vector Machine (LSSVM) can be utilized in this field [7–9]. The main purpose of PD pattern recognition is to identify the defect type and most of the research is based on the signal statistics of a single PD source. Fingerprint identification technology of PD statistical graph [10,11], PD gray image and fractal image compression technology [12,13] and PD energy distribution recognition technology [14] are commonly used in this field. However, these results mainly focus on AC or DC voltage respectively, and the PD characteristics application under combined AC-DC voltage is reported rarely. In practice, PD in transformer is likely to occur simultaneously in more than one place. So the separation of different PD sources is required before analyzing the PD characteristics. One solution is to use the blind source separation (BSS) technique to process the PD signals. This method separates the signals from all sources when the condition is met. The condition is that the number of sensors should be greater than or equal to the number of sources. Therefore, this method is only suitable for the transformer, which has multiple pre-installed UHF sensors, and its adaptability is not wide [15]. The other solution is to use the classification and recognition algorithm to deal with the signals obtained by the pulse current method. FC and LSSVM are commonly used in this method [16]. When the PD sources of the same type defect model produce signals with a similar propagation path, this method cannot separate them well. Therefore, this method is applicable to the general pulse current method PD test, and transformer insulation state can be determined by the PD pattern recognition combined with the transformer insulation structure and manufacturing technique. So this method can be applied to the vast majority of cases. In the previous studies on PD pattern recognition based on pulse current method PD test, there are mainly two ideas: one solution is to classify using methods like FC, then do learning and recognition with the methods like ANN; the other solution is to use one classification algorithm that includes learning processes like LSSVM. Extraction of certain features of the original signals can contact the original data and the algorithms. Phase Resolved Partial Discharge (PRPD) pattern under AC voltage, Time and Amplitude Resolved Partial Discharge (TARPD) pattern under DC voltage and other statistical patterns provide statistical basis for PD characteristics. At the same time, the characteristics of a single PD pulses such as equivalent time, equivalent frequency and rising gradient also provide another feature extraction method. The nesting of multilayer calculation processes may increase the amount of computation and cause the loss of information. Smart grid is an important trend of power network. The rapid development of hardware makes the online monitoring of power grid status based on big data achievable: for example, the monitoring and evaluation of the insulation status of a converter transformer based on a large number of PD data. Aiming at the above described requirements and problems, laboratory tests were established for the investigation of the PD characteristics in oil-pressboard insulation with three defect models (needle-plate, surface discharge and air gap) under 1:1 combined AC-DC voltage. PD signals of the whole development process were recorded. Different characteristics were analyzed and related discharge mechanism was discussed. Random Forests (RF) algorithm is used to complete the
Energies 2018, 11, 592 Energies 2018, 11, x FOR PEER REVIEW
3 of 19 3 of 19
to complete the recognition process. Zero-padding method is used to normalize the features recognition process. Zero-padding method is used to normalize the features including single PD including single PD pulse waveform and discharge phase information. RF and LSSVM are pulse waveform and discharge phase information. RF and LSSVM are compared in the performance of compared in the performance of computing time, recognition accuracy and adaptability. computing time, recognition accuracy and adaptability. 2. Experimental 2. Experimental System System and and Methods Methods 2.1. Experimental Circuit
circuitfor forPD PDmeasuring measuringunder under combined AC-DC voltage based on IEC 60270 Experimental circuit combined AC-DC voltage based on IEC 60270 [17] [17] is shown in Figure 1. Background noise in laboratory of all the tests is less than 5 pC. AC power is shown in Figure 1. Background noise in laboratory of all the tests is less than 5 pC. AC voltage doubling circuit whose source is a PD-free transformer and DC power source is a PD-free voltage is less less than than1%. 1%.RRAC AC and and RRDC DC are are protective protective resistors. resistors. CCAC AC and C CDC DC are coupling ripple coefficient is capacitors. ZZmm isisthethe detecting impedor. OSC represents an oscilloscope. Filter detecting impedor. OSC represents an oscilloscope. Filter representsrepresents a high-passa high-pass filter. The parameters of the experimental circuit are shown filter. The parameters of the experimental circuit are shown in Table 1. in Table 1.
Figure 1. Schematic diagram of the experimental arrangement. Figure 1. Schematic diagram of the experimental arrangement. Table 1. Parameters of the experimental circuit. Table 1. Parameters of the experimental circuit.
Parameter Parameter Rated voltage of AC power source Rated source Ratedvoltage powerofofAC ACpower power source Rated power of AC power source Rated voltage of DC power source Rated voltage of DC power source Rated power of DC power source Rated power of DC power source Ratioofofresistive resistive divider Ratio divider RAC RAC RDC RDC CAC CAC CDC C DC Passband of filter Passband of filter
Index Index 70 kV 70 kV 7 kVA 750 kVA kV 50 kV 5 kVA 5 kVA 1000:1 1000:1 10MΩ MΩ 10 20 20MΩ MΩ 830 830pF pF 830 pF 830 High-passpF 1 kHz
High-pass 1 kHz
2.2. Electrodes and Specimen 2.2. Electrodes and Specimen Three common defect models are selected, such as needle-plate, surface discharge and air gap, Three common defect models are selected, such as needle-plate, surface discharge and air gap, which represent three typical defects: corona discharge in oil in extremely uneven electric field which represent three typical defects: corona discharge in oil in extremely uneven electric field strength, surface discharge along the oil-pressboard surface and discharge in air gap of pressboard. strength, surface discharge along the oil-pressboard surface and discharge in air gap of pressboard. The schematic diagrams of the electrodes are shown in Figure 2. In addition, all the dimensions The schematic diagrams of the electrodes are shown in Figure 2. In addition, all the dimensions of of the electrodes are in millimeters. Each model contains at least one upper electrode, one lower the electrodes are in millimeters. Each model contains at least one upper electrode, one lower electrode and pressboard, and is placed in a glass box filled with oil throughout the whole course of electrode and pressboard, and is placed in a glass box filled with oil throughout the whole course of the experiment. All the lower electrodes are circular plates. The surface discharge model has two the experiment. All the lower electrodes are circular plates. The surface discharge model has two upper electrodes, one is a column electrode located in the center and one is a small rectangular plate upper electrodes, one is a column electrode located in the center and one is a small rectangular plate electrode on the edge of the pressboard. The upper and lower electrodes are the same circular plates electrode on the edge of the pressboard. The upper and lower electrodes are the same circular plates in air gap model. Due to the symmetrical structure, the schematic diagram of each model
Energies 2018, 11, 592 Energies 2018, 11, x FOR PEER REVIEW
4 of 19 4 of 19
shown in Figure is proposed with longitudinal section. The needle electrode is made carbon in air gap model. 2Due to the symmetrical structure, the schematic diagram of each modelby shown in steel and its curve radius is 100 μm. Other electrodes and the base of needle electrode are made Figure 2 is proposed with longitudinal section. The needle electrode is made by carbon steel and by its brass. The two electrodes are electrodes closely adjoined the of oil-impregnated pressboard specimen, where curve radius is 100 µm. Other and thetobase needle electrode are made by brass. The two no oil layer should exist between electrodes. Needle electrode, column electrode and upper plate electrodes are closely adjoined to the oil-impregnated pressboard specimen, where no oil layer should electrode of airelectrodes. gap modelNeedle are connected with AC voltage side; allupper the lower electrodes exist between electrode, column electrode and plateplate electrode of air and gap the plate electrode above the pressboard of surface discharge model are connected with DC voltage model are connected with AC voltage side; all the lower plate electrodes and the plate electrode above side. the pressboard of surface discharge model are connected with DC voltage side.
(a)
(b)
(c)
Figure 2. Schematic Schematic diagram diagram of of the the electrodes. (a) (a) Needle-plate; Needle-plate; (b) (b) Surface discharge; (c) Air gap. Figure ◦ C and 11 mm-thick mm-thickWeidmann Weidmannpressboard pressboard in 120 × mm 120 size mm was sizedried was under dried 110 under 110 vacuum °C and in 120 mmmm × 120 vacuum of 50 for 72 h. The immersion process with Kunlun 25#transformer Karamay transformer oil of the of 50 Pa for 72 Pa h. The immersion process with Kunlun 25# Karamay oil of the pressboard ◦ pressboard was performed under 80 °C and vacuum of 50 Pa for 48 h. The moisture content was performed under 80 C and vacuum of 50 Pa for 48 h. The moisture content of pressboard of is pressboard is The less gas thanvolume 1%. The gas volume in 2%, oil isand lessthe than 2%, and the micro-moisture less than 1%. fraction in oil isfraction less than micro-moisture content of oil is content oilppm, is less than is 10conformed ppm, which conformed to IEC [18]. The contains air gap model contains less thanof10 which toisIEC 60641 [18]. The 60641 air gap model three layers of three layers of pressboard, among which the middle layer of pressboard has a round hole of 10 mm pressboard, among which the middle layer of pressboard has a round hole of 10 mm diameter in the diameter in theadhesive center. Epoxy adhesive was to bondaround the pressboard center. Epoxy was used to bond theused pressboard the hole.around the hole.
2.3. Voltage Voltage Application Application Method and Data Collection For the factory acceptance test of oil-immersed converter transformers, transformers, four four kinds kinds of ratios between between AC voltage voltage effective effective value value and DC voltage average value are commonly applied to valve winding, namely namely 1:1, 1:3, 1:5 and 1:7, respectively [19]. 1:1 1:1 is is more more commonly commonly used in practical operation and andexperimental experimentalstudy. study. This study is focused onPD thecharacteristics PD characteristics of different This study is focused on the of different models models and the recognition of discharge sources, not on theofinfluence of 1:1 ratios, and the recognition methods methods of discharge sources, not on the influence ratios, thus was thus used 1:1 for was used for experimental research. experimental research. Constant-voltage testing testingmethod methodwas wasused used these experiments because it is similar the in in these experiments because it is similar to the to actual actual situation. All the tests were performed at room temperature. The PD measuring system was situation. All the tests were performed at room temperature. The PD measuring system was calibrated calibrated with 500 pCpulse standard pulsesource, discharge source, and the of PD measurement with 500 pC standard discharge and the sensitivity of sensitivity PD measurement system is 5 C. system 5 pC. AC were and DC voltage were by step kV for each step). In order to Both ACisand DCBoth voltage raised step by stepraised (2 kV step for each step).(2In order to wait for the stability wait for the stability process of the conduction current, AC voltage is superimposed on DC voltage process of the conduction current, AC voltage is superimposed on DC voltage after 2 min for each after 2 min forfinal eachconstant step [20]. The final voltage is the(PDIV) PD inception (PDIV) of each step [20]. The voltage is theconstant PD inception voltage of eachvoltage test, which can balance test, which can balance the demands of experimental time of controlling and simulation of actual the demands of experimental time controlling and simulation actual situation. In actual operation situation. operation condition,part theisvoltage eachsodefective the same, so condition,In theactual voltage of each defective not the of same, different part levelsisofnot external voltage different of three external voltage were used for the three defect models the PD experiments to were usedlevels for the defect models in the experiments to ensure that the in entire process can ensure that the entire PD process can be properly recorded. The experiment for each model was be properly recorded. The experiment for each model was repeated twice and the results of two repeated twice results of two experiments for each were approximately similar. The experiments forand eachthe model were approximately similar. Themodel constant voltage levels of three models constant voltage levels of three models 14 kVdischarge for needle-plate model, were 14 kV for needle-plate model, 16 kVwere for surface model and 5 kV16 forkV air for gapsurface model discharge model and 5 kV of for1:1 aircombined gap model respectively. waveform of 3.1:1Sampling combined respectively. The waveform AC-DC voltage isThe shown in Figure rateAC-DC in this voltage shown in Figure 3. Sampling rate in this schemecycles is 100(20 MS/s. PD5)pulses of 5 consecutive scheme is 100 MS/s. PD pulses of 5 consecutive primitive ms × were sampled in every primitive cycles (20 ms × 5) were sampled in every 3 min. The sampling process began 2 min after
Energies 2018, 11, 592 Energies 2018, 11, x FOR PEER REVIEW Energies 2018, 11, x FOR PEER REVIEW
5 of 19 5 of 19 5 of 19
3the min. The sampling process min after the voltage was constant andThe ended discharge voltage was constant andbegan ended2when discharge breakdown occurred. flowwhen diagram of the the voltage was constant and ended when discharge breakdown occurred. The flow diagram of the breakdown occurred. The flow diagram of the PD measurement is shown in Figure 4. PD measurement is shown in Figure 4. PD measurement is shown in Figure 4.
Figure 3. 3. The The applied applied voltage voltage waveform. waveform. Figure Figure 3. The applied voltage waveform.
Figure 4. Flow diagram of the PD measurement. Figure 4. Flow diagram of the PD measurement. Figure 4. Flow diagram of the PD measurement.
3. Experimental Results and Discussion 3. Experimental Results and Discussion 3. Experimental Results and Discussion 3.1. PD Development Process 3.1. 3.1. PD PD Development Development Process Process The PD processes of three models are different in appearance. The maximum of apparent The PD processes processesofofthree three models different in appearance. The maximum of apparent The(QPD models are are different in appearance. The maximum of apparent charge charge max) and PD repetition rate (N) are two indicators of PD degree. The time-variation trends charge (Q max) and PD repetition rate (N) are two indicators of PD degree. The time-variation trends (Q ) and PD repetition rate (N) are two indicators of PD degree. The time-variation trends of of max Qmax and N of three models are shown in Figure 5. Because in the experiment of this paper, data of Q max and N of three models are shown in Figure 5. Because in the experiment of this paper, data Q and N of cycles three models are shown 5. Because in of theQexperiment of this paper, data of ofmax 5 primitive are collected everyin3Figure min, every sample max is the apparent charge of the of 5 primitive cycles are collected every 3 min, every sample of is Qmax is the apparent charge of the 5largest primitive cycles are collected every 3 min, every sample of Q the apparent charge of theforms largest max pulse in the 5 primitive cycles. The experimental process of each PD defect model a largest pulse in the 5 primitive cycles. The experimental process of each PD defect model forms a pulse 5 primitive cycles.trend. The experimental process each PD cycles, defect model forms a figure of figureinofthe Qmax time-variation While 1 s contains 50ofprimitive the total number of PD figure of Qmax time-variation trend. 1 s contains 50 primitive cycles, the totalof number of PD Q While 1 sWhile contains 50byprimitive cycles, the totalfor number PD pulses in max time-variation pulses in each of the trend. 5 cycles will be multiplied a factor of 10, planning the PD repetition rate pulses in each of the 5 cycles will be multiplied by a factor of 10, planning for the PD repetition rate per 1 s, and creating a time-variation trend of N. The two PD indicators of needle-plate model per 1 s, and creating a time-variation trend of N. The two PD indicators of needle-plate model
Energies 2018, 11, 592
6 of 19
each of the 5 cycles will be multiplied by a factor of 10, planning for the PD repetition rate per 1 s, Energies 2018, 11, x FOR PEER REVIEW 6 of 19 and creating a time-variation trend of N. The two PD indicators of needle-plate model gradually Energies 2018, 11, x FOR PEER REVIEW 6 of 19 increase in increase the first half then maintain a relatively state, stable and rapidly decline before breakdown. gradually in the first half then maintain astable relatively state, and rapidly decline before The PD indicators of surface discharge model are relatively smoothly at a low level in the first half then breakdown. The PD in indicators of surface discharge model are relatively smoothly a lowbefore level in gradually increase the first half then maintain a relatively stable state, and rapidly at decline rise rapidly, after a period of time they decline until the breakdown. The PD process of air gap model thebreakdown. first half then riseindicators rapidly, of after a period of time they until the breakdown. TheinPD The PD surface discharge model aredecline relatively smoothly at a low level is almost inhalf a steady rising state, and inathe vicinity of the breakdown suddenly rises. Overall process of air gap is almost aperiod steady state, and inuntil the vicinity of the breakdown the first thenmodel rise rapidly, afterin ofrising time they decline the breakdown. Thethe PDPD process of needle-plate model develops the most slowly; Q and N of air gap model are the highest maxand process rises. of air Overall gap model in of a steady rising model state, in the the vicinity the breakdown suddenly the is PDalmost process needle-plate develops mostofslowly; Qmax and N because themodel PD degree ofhighest air gap model is the most serious. rises. Overall the PD process ofthe needle-plate model theismost slowly; Qmax and N of suddenly air gap are the because PD degree of air develops gap model the most serious. of air gap model are the highest because the PD degree of air gap model is the most serious.
(a) (a)
(b)
(b)
(c) (c)
(d) (d)
(e) (e)
(f)(f)
Figure5. 5.Time-variation Time-variationtrends trends of of Qmax max and N of three models. (a) Qmax of needle-plate; (b) N of Figure and N N of of three three models. models. (a) (a) QQmax of of needle-plate; needle-plate; (b) (b) N N of of Figure 5. Time-variation trends of QQmax and max max of surface discharge; (d) N of surface discharge; (e) Qmax of air gap; (f) N of air needle-plate; (c) Q surface discharge; (d) N of surface discharge; (e) Qmax of air gap; (f) N of air needle-plate; (c) (c) Q Qmax of needle-plate; max of surface discharge; (d) N of surface discharge; (e) Qmax of air gap; (f) N of gap. gap. air gap.
In previous studies, the whole PD process is generally divided into three to five stages. In In previous studies, the whole PD process is generally divided into three to five stages. In In previous studies, the whole of PDmost process is generally divided intowill three to five stages. In general, general, the discharge processes models before breakdown experience the discharge general, the discharge processes of most models before breakdown will experience the discharge thesteady discharge of most models will experience theindischarge steady stage stageprocesses and pre-breakdown stage before [21,22].breakdown Figure 6 shows the PD pulses one primitive cycle steady stage and pre-breakdown stage [21,22]. Figure 6 shows the PD pulses in one primitive cycle inpre-breakdown the steady stagestage of each model. It can6 be seenthe thatPD under 1:1in combined AC-DC voltage whose and [21,22]. Figure shows pulses one primitive cycle in the steady in waveform the steadyhas stage of each model. It can be seen thathalf under 1:1 combined AC-DC voltage whose asymmetrical positive and negative cycle, PD voltage amplitude in one cycle ofhas stage of each model. It can be seen that under 1:1 combined AC-DC whose waveform waveform hasand asymmetrical positive andis negative half cycle, PDbutamplitude cycle needle-plate surface models obviously asymmetrical, this featureinof one the air gap of asymmetrical positive and discharge negative half cycle, PD amplitude in one cycle of needle-plate and surface needle-plate and surface discharge models is obviously asymmetrical, but this feature of the air gap model ismodels not obvious. discharge is obviously asymmetrical, but this feature of the air gap model is not obvious.
model is not obvious.
(a)
(a)
Figure 6. Cont.
Energies 2018, 11, 592 Energies 2018, 11,11, x FOR PEER REVIEW Energies 2018, x FOR PEER REVIEW
7 of 19
of 19 7 of7 19
(b) (b)
(c) (c)
Figure 6. PD pulses in one primitive cycle of three models. (a) Needle-plate; (b) Surface discharge; (c) Air gap. Figure 6. PD pulses in one primitive cycle of three models. (a) Needle-plate; (b) Surface discharge; Figure 6. PD pulses in one primitive cycle of three models. (a) Needle-plate; (b) Surface discharge; (c) Air gap. (c) Air gap.
3.2. Discussion on PD Characteristics 3.2. Discussion on PD Characteristics PD characteristics are closely related to the model type and oil-pressboard insulation state, and 3.2. Discussion on PD Characteristics characteristics are closely related to the model typeofand oil-pressboard state, and thePD essence can be obtained from the physical process discharge and its insulation phenomenon. The PD characteristics are closely the model type and oil-pressboard and the constant proportion ofrelated the impregnated pressboard and transformer oil isstate, about 2:1 thedielectric essence can be obtained from theoilto physical process of discharge and insulation its phenomenon. The essence can be obtained from the physical process of discharge and its phenomenon. The dielectric and volume resistivity proportion is dozens to hundreds of times. Therefore, when the voltage is dielectric constant proportion of the oil impregnated pressboard and transformer oil is about 2:1 constant proportion of the oil pressboard andof transformer oilbecause is about volume the distribution of impregnated the electric field different for each model of2:1the itsand different andapplied, volume resistivity proportion is dozens toishundreds times. Therefore, when voltage is resistivity proportion is dozens to hundreds times. Therefore, when because the voltage applied, structures. applied, the distribution of the electric field isofdifferent for each model of itsis different the distribution of the electric field isofdifferent for each model because of DC its different structures. at The electric field distribution needle-plate model under AC and voltage components structures. theThe moment when the voltage is applied is shown in Figure 7a,b. The electric field generated by the at electric field distribution of needle-plate model under AC and DC voltage The electric field distribution of needle-plate model under AC and DC voltage components components at AC component of the voltage is mainly concentrated around the needle tip, while the electric field the moment when the voltage is applied is shown in Figure 7a,b. The electric field generated by the the moment when the voltage is applied is shown in Figure 7a,b. The electric field generated by the generated by of the DCvoltage component is mainly concentrated in the pressboard. However, the electric AC AC component component of the the voltage is is mainly mainly concentrated concentrated around around the the needle needle tip, tip, while while the the electric electric field field strength of the oil is lower and the electric field strength in oil is higher, so PD occurs firstly in the generated by the However, the generated by the DC DC component component is is mainly mainly concentrated concentrated in in the the pressboard. pressboard. However, the electric electric oil around the tip. strength is is higher, so so PDPD occurs firstly in the oil strength of of the the oil oil isislower lowerand andthe theelectric electricfield fieldstrength strengthininoiloil higher, occurs firstly in the around the tip. oil around the tip.
(a)
(a) Figure 7. Cont.
Energies 2018, 11, 592
8 of 19
Energies 2018, 11, x FOR PEER REVIEW
8 of 19
(b) Figure 7. model under ACAC andand DCDC voltage components. (a) Figure 7. Electric Electricfield fielddistribution distributionofofneedle-plate needle-plate model under voltage components. AC voltage component; (b) DC voltage component. (a) AC voltage component; (b) DC voltage component.
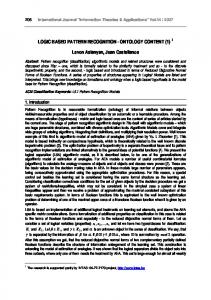
The AC voltage component changes periodically while the DC component polarity does not The AC voltage component changes periodically while the DC component polarity does not change, so under the DC voltage component, the electrode will inject charges more obviously into change, so under the DC voltage component, the electrode will inject charges more obviously into the pressboard. At the same time, the charges are concentrated on the interface of the insulating the pressboard. At the same time, the charges are concentrated on the interface of the insulating medium as shown in Figure 8. Figure 8a shows the space charge distribution of needle-plate model medium as shown in Figure 8. Figure 8a shows the space charge distribution of needle-plate model under DC component. For needle-plate model in the initial stage of PD process, the electric field is under DC component. For needle-plate model in the initial stage of PD process, the electric field is seriously distorted near the tip of the needle, resulting in a small amount of bubbles. The charges seriously distorted near the tip of the needle, resulting in a small amount of bubbles. The charges accumulate at the bubble interface and the oil-paper interface, so that the electric field strength at accumulate at the bubble interface and the oil-paper interface, so that the electric field strength at the the tip is weakened and the electric field strength of the oil-paper interface is enhanced. However, tip is weakened and the electric field strength of the oil-paper interface is enhanced. However, the the charges accumulated at the oil-gas interface are limited, and the charges of the oil-paper charges accumulated at the oil-gas interface are limited, and the charges of the oil-paper interface interface diffuse rapidly under the repulsive force. Therefore, the discharge amplitude and diffuse rapidly under the repulsive force. Therefore, the discharge amplitude and frequency are low frequency are low and the discharge randomness is strong. With the development of discharge, the and the discharge randomness is strong. With the development of discharge, the small bubbles in small bubbles in the oil continue to increase and gather, the paper fiber is ablated, and the the oil continue to increase and gather, the paper fiber is ablated, and the pressboard under the tip of pressboard under the tip of needle is sunken. In addition, under the action of DC voltage needle is sunken. In addition, under the action of DC voltage component, the directional movement of component, the directional movement of charge inside the pressboard will also lead to local defects, charge inside the pressboard will also lead to local defects, so that the amplitude and frequency of the so that the amplitude and frequency of the PD pulses are increased. With a certain period of the PD pulses are increased. With a certain period of the steady stage, the bubbles continue to accumulate, steady stage, the bubbles continue to accumulate, a number of gas columns are formed on the a number of gas columns are formed on the pressboard. At this point, a lot of gas is gathered in the pressboard. At this point, a lot of gas is gathered in the depression under the tip of needle format to depression under the tip of needle format to form gas gap, so that oil gap discharge transforms into form gas gap, so that oil gap discharge transforms into gas gap discharge, indicating that the gas gap discharge, indicating that the discharge process goes into the pre-breakdown stage. At this discharge process goes into the pre-breakdown stage. At this time, the discharge in oil gap is time, the discharge in oil gap is weakened and the discharge in gas gap is enhanced. However, the gas weakened and the discharge in gas gap is enhanced. However, the gas gap surface is smooth, and gap surface is smooth, and the electric field distribution is more uniform, so there is no penetrating the electric field distribution is more uniform, so there is no penetrating discharge of high-energy. discharge of high-energy. Charge on oil-gas interface diffuse fast, discharge amplitude and frequency Charge on oil-gas interface diffuse fast, discharge amplitude and frequency are beginning to decline. are beginning to decline. Gas discharge will bring about a large number of strong oxidized charged Gas discharge will bring about a large number of strong oxidized charged particles, and these particles, and these particles continue to hit the pressboard. Consequently the fiber quickly breaks and particles continue to hit the pressboard. Consequently the fiber quickly breaks and the pressboard the pressboard enters the rapid aging stage [23]. In addition, the large amount of charge generated by enters the rapid aging stage [23]. In addition, the large amount of charge generated by the gas the gas discharge will pass through the pressboard in the form of leakage current causing the internal discharge will pass through the pressboard in the form of leakage current causing the internal defects of the pressboard. When the gas gap is expanded and drifted under the action of buoyancy, defects of the pressboard. When the gas gap is expanded and drifted under the action of buoyancy, the high energy streamer discharge will run through the oil gap, and inject a lot of charge into the the high energy streamer discharge will run through the oil gap, and inject a lot of charge into the pressboard internal defects, so the pressboard is rapidly carbonized, resulting in insulation breakdown. pressboard internal defects, so the pressboard is rapidly carbonized, resulting in insulation The electric field distribution diagrams of surface discharge model under AC and DC voltage breakdown. components when the voltage starts to be applied are shown in Figure 9a,b. The electric field generated The electric field distribution diagrams of surface discharge model under AC and DC voltage by the AC component of the voltage is mainly concentrated at the angle between the column electrode components when the voltage starts to be applied are shown in Figure 9a,b. The electric field and the pressboard, while the electric field generated by the DC component is mainly concentrated in generated by the AC component of the voltage is mainly concentrated at the angle between the the pressboard. At the same time, the small plate electrode on the paper will produce slightly stronger column electrode and the pressboard, while the electric field generated by the DC component is electric field strength in the oil under the DC voltage component. mainly concentrated in the pressboard. At the same time, the small plate electrode on the paper will The space charge distribution of surface discharge model under DC voltage component is shown produce slightly stronger electric field strength in the oil under the DC voltage component. in Figure 8b. For surface discharge model, in the initial stage the electric field strength is high near The space charge distribution of surface discharge model under DC voltage component is shown in Figure 8b. For surface discharge model, in the initial stage the electric field strength is
Energies 2018, 11, x FOR PEER REVIEW
9 of 19
Energies 2018, 11, x FOR PEER REVIEW 9 of 19 high near the edge of electrode and pressboard contact surface, where the surface discharge begins Energies 2018, 11, 592 of 19 to occur. The resulting charges will accumulate near the electrode, improving the electric 9field high near the edge of electrode and pressboard contact surface, where the surface discharge begins distortion to a certain extent, making the discharge remaining at a low level for a long period of to occur. The resulting charges will accumulate near the electrode, improving the electric field time. However, with the passage of time, splitting decomposition of oil induced by discharge distortion a certainand extent, makingcontact the discharge a low discharge level for abegins long period of the edge ofto electrode pressboard surface,remaining where theat surface to occur. produces gas, and the charges near the electrode are gradually increased, especially one electrode time. However, with will the accumulate passage of near time,the splitting decomposition of electric oil induced discharge The resulting charges electrode, improving the field by distortion to connected to the positive DC high voltage leads to a large amount of positive charge. The increase gas, and the charges near the electrodeatare gradually increased, especially oneHowever, electrode aproduces certain extent, making the discharge remaining a low level for a long period of time. of the bubble and the advance of the charge improve the degree of discharges along the surface. connected to theof positive DC highdecomposition voltage leads to amount of positive charge. gas, The and increase with the passage time, splitting of a oillarge induced by discharge produces the Meanwhile, the PD amplitude and the frequency are obviously increased, and the pressboard of the bubble the advance of the charge improve the degree of discharges along thepositive surface. charges near theand electrode are gradually increased, especially one electrode connected to the begins to be obviously destroyed [19]. When there are enough bubbles, the gas gap discharge Meanwhile, theleads PD amplitude and the frequency are obviously increased, andand thethe pressboard DC high voltage to a large amount of positive charge. The increase of the bubble advance becomes the main discharge form instead of the discharge in oil. Because the charge generated by begins to be improve obviouslythedestroyed When there the the gas PD gapamplitude discharge of the charge degree of[19]. discharges along are the enough surface. bubbles, Meanwhile, gas discharge dissipates quickly, PD amplitude and frequency drops again. The strength of the becomes the mainare discharge form instead and of the inbegins oil. Because the chargedestroyed generated by and the frequency obviously increased, thedischarge pressboard to be obviously [19]. insulating oil has been significantly reduced, so Impurity Bridge is easily to be formed under the gas discharge dissipates quickly, amplitude and frequency dropsdischarge again. The the When there are enough bubbles, the PD gas gap discharge becomes the main formstrength instead of the action of a strong electric field, causing flashover. insulatinginoil been significantly reduced,by sogas Impurity Bridge is easily to bePD formed underand the discharge oil.has Because the charge generated discharge dissipates quickly, amplitude The electric field distribution diagrams of air gap model under AC and DC voltage action of adrops strongagain. electric field, causing flashover. frequency The strength of the insulating oil has been significantly reduced, so Impurity components when the voltage starts to be applied are shown in Figure 10a,b. Figure 8c shows the The electric field distribution air electric gap model under AC and DC voltage Bridge is easily to be formed under the diagrams action of a of strong field, causing flashover. space charge distribution of air gap model under DC voltage component. For air gap model, since components when the voltage starts to be applied are shown in Figure 10a,b. Figure 8c shows the The electric field distribution diagrams of air gap model under AC and DC voltage components the dielectric constant of pressboard is several times of the dielectric constant of air, the electric field spacethe charge distribution gap model underinDC voltage component. air the gapspace model, since when voltage starts to of be air applied are shown Figure 10a,b. Figure 8c For shows charge strength generated by the AC component is concentrate in the air gap. In addition, the electric field the dielectricofconstant of pressboard is several of the dielectric constant of air, thethe electric field distribution air gap model under DC voltagetimes component. For air gap model, since dielectric strength generated by the DC component is also slightly higher inside the air gap. However, the strength of generated by the AC component concentrate the air gap. Inthe addition, electric field constant pressboard is several times ofisthe dielectric in constant of air, electricthe field strength electric strength of the air gap is lower, the PD initial voltage is low and the discharge mainly strength generated the DC component is also slightly higher inside the gap. field However, the generated by the ACby component is concentrate in the air gap. In addition, theair electric strength occurs inside the air gap and the end of the PD process is also marked by air gap breakdown. As the electric strength of component the air gapisisalso lower, thehigher PD initial is low and thethedischarge mainly generated by the DC slightly insidevoltage the air gap. However, electric strength influence of the AC voltage component on the discharge of air gap model is more obvious than the occurs inside air gap and end voltage of the PD alsodischarge marked by air gap breakdown. As air the of the air gap the is lower, the PDthe initial is process low andisthe mainly occurs inside the above two models, the discharge amplitude is more balanced in the positive and negative half influence of end the AC voltage component onmarked the discharge airbreakdown. gap model isAs more the gap and the of the PD process is also by air of gap the obvious influencethan of the cycles. above two component models, the amplitude is model more balanced in the than positive and negative half AC voltage ondischarge the discharge of air gap is more obvious the above two models, cycles. the discharge amplitude is more balanced in the positive and negative half cycles.
Figure 8. Space charge distribution diagram under DC component. (a) Needle-plate; (b) Surface discharge; (c) Air gap.
Energies 2018, 11, x FOR PEER REVIEW Energies 2018, 11, x FOR PEER REVIEW
10 of 19 10 of 19
Energies 2018, 8. 11,Space 592 charge distribution diagram under DC component. Figure
10 of 19 (a) Needle-plate; (b) Surface
Figure 8. Space charge discharge; (c) Air gap.distribution diagram under DC component. (a) Needle-plate; (b) Surface
discharge; (c) Air gap.
(a) (a)
(b) (b) Figure Electric field distribution of surface discharge modelACunder ACvoltage and DC voltage Figure 9.9.Electric field distribution of surface discharge model under and DC components. Figure 9. Electric field distribution of(b)surface discharge model under AC and DC voltage components. (a) AC voltage component; DC voltage component. (a) AC voltage component; (b) DC voltage component. components. (a) AC voltage component; (b) DC voltage component.
(a) (a) Figure 10. Cont.
Energies 2018, 11, 592
11 of 19
Energies 2018, 11, x FOR PEER REVIEW
11 of 19
(b) Figure 10. 10. Electric distribution of air model under AC and voltage components. (a) AC Figure Electricfield field distribution of gap air gap model under ACDC and DC voltage components. voltage component; (b) DC voltage component. (a) AC voltage component; (b) DC voltage component.
4. Defect Pattern Recognition Based on PD Characteristics Using Random Forests 4. Defect Pattern Recognition Based on PD Characteristics Using Random Forests In order to discuss the defect pattern recognition system based on PD characteristics using RF, In order to discuss the defect pattern recognition system based on PD characteristics using RF, the waveform and phase of single PD pulse are used to provide information for recognition. In the waveform and phase of single PD pulse are used to provide information for recognition. In practice, practice, the mainstream PD testers with good performance have single pulse recording function. In the mainstream PD testers with good performance have single pulse recording function. In this paper, this paper, an oscilloscope is used to record the experimental data; all the data collected in the an oscilloscope is used to record the experimental data; all the data collected in the experiment should experiment should be processed to extract the waveform and the phase of each PD pulse as the be processed to extract the waveform and the phase of each PD pulse as the basis of the research. basis of the research. 4.1. Random Forests 4.1. Random Forests As a highly flexible machine learning algorithm, RF has a wide range of applications [24,25]. RF is As a highly machine learning algorithm, has a wide range of applications [24,25]. an algorithm that flexible integrates multiple decision trees and RF its essence belongs to Ensemble Learning—a RF is an algorithm that integrates multiple decision for trees and its essence belongs to Ensemble branch of machine learning. Explaining RF in principle, classification problems each decision tree Learning—a branch of machine learning. Explaining RF in principle, for classification problems is a classifier, and RF integrates all classification voting results specifying the category with the highest each decision tree classifier, and RFthe integrates all classification voting results specifying the number of votes as is thea final output. It is most Simple Bagging ideas [26]. As a very flexible and category method, with theRF highest number of votes as the final output. It is the most Simple Bagging ideas practical has the following characteristics: [26]. As a very flexible and practical method, RF has the following characteristics: (1) It is unexcelled in accuracy among current algorithms. (1) It is unexcelled in accuracy among current algorithms. (2) It runs efficiently on large data bases. (2) It runs efficiently on large data bases. (3) It can assess the important degree of each variable in the classification. (3) It can assess the important degree of each variable in the classification. (4) It gets an unbiased estimate of the internal generating error as the forest building progresses. (4) It gets an unbiased estimate of the internal generating error as the forest building progresses. The make RF RF veryvery suitable for online monitoring of insulation status system The above abovecharacteristics characteristics make suitable for online monitoring of insulation status based on big data. For the classification problem, RF is divided into two stages of training testing, system based on big data. For the classification problem, RF is divided into two stagesand of training and mainand steps and the testing, theare: main steps are:
(1) Given a training training set set X X == x11, ..., xnn with select (1) with responses Y = y11,..., ,..., ynn,, bagging bagging repeatedly repeatedly (B times) select n random samples from { X,, Y } with replacement called { Xb ,, Yb } where b = 1, ..., B. In addition, take them as the root node samples of each decision tree fbb. (2) When feature dimension dimension of of each each sample sample is is M, M, specifying specifying aa (2) When establishing establishing decision decision tree, tree, if if the the feature constant features without without replacement. replacement. constant m m