Delay Compensation using PID Controller and GA Andri Mirzal Faculty of Computing, N28-439-03 Universiti Teknologi Malaysia 81310 UTM Johor Bahru, Malaysia
[email protected] Abstract—This paper discusses the using of PID controller to compensate delay component that frequently appears in a control system. The delay component is known to not only make time-lag in system response, but also reduce system stability, thus, it needs to be compensated to improve the stability. To determine optimal parameters in the PID controller, the genetic algorithm is used and the results are compared to the results of two standard PID tuning methods: the Iterative Method and Ziegler-Nichols rule. Index Terms— PID controller, delay compensation, genetic algorithm, Iterative Method, Ziegler-Nichols rule
with u(t) denotes unit step (the testing signal), e-st denotes the delay component, A[ f (t )] denotes the Laplace transform of f(t), and s denotes the complex plane. Replacing t with τ = t-T, ∞
∫
f (t − T )u (t − T )e − st dt =
∞
∫ f (τ )u(τ )e
− s (τ +T )
dτ .
−T
0
Assume that f(t) = 0 for t < 0, then,
∫
∞
−T
∞
∞
f (τ )u (τ )e − s (τ +T ) dτ = ∫ f (τ )u (τ )e − s (τ +T ) dτ = ∫ f (τ )e − sτ e −Ts dτ 0
0
∞
= e −Ts ∫ f (τ )e − sτ dτ = e −Ts F ( s )
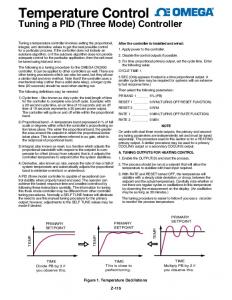
I. INTRODUCTION Time delay in a control system can be defined as time interval between an event started in one point and its output in another point within the system [1]. Delays always reduce stability of minimum phase systems (systems that do not have poles or zeros in the right-hand side of the complex plane or do not have other delay component) [1]. So that it is important to analyze system stability under the presence of delays. Delays can be caused by transportation and communication lag, sensor response delay, time to generate control signals, and system parameters approximation using First Order Lag plus Time Delay (FOLPD) [2]. Fig. 1 shows delay influence in the system response. As shown, delay creates time lag in the response which is usually not desirable. The relationship between f(t) and f(t-T) can be written as: ∞
A[ f (t − T )u (t − T )] = ∫ f (t − T )u (t − T )e −st dt 0
f (t )
Delay (T)
f(t)
f (t − T )
f(t-T) t T
Fig. 1. Delay component in a system.
0
so that, A[ f (t − T )u (t − T )] = e −Ts F ( s ) = e −Ts A[ f (t )u (t )] .
In complex frequency domain, this relationship can be described with the following figure.
X in (s )
e −Ts
X out ( s ) = e −Ts X in ( s )
Fig. 2. Delay in frequency domain.
In the previous work [3], we have implemented and compared two standard tuning methods, the Iterative Method and Ziegler-Nichols rule to compensate the effect of delay in system stability and showed that the Iterative Method has better performance in the analyzed cases. But there are some cases where we can’t use these two tuning methods, e.g., the dynamic plants which its parameters are constantly changing. In this kind of systems, we have to do retuning in real time, which can’t be accomplished by the tuning methods because we have to take the systems offline first in order to set the parameters [4]. In this work, we extend our previous work by employing the genetic algorithm (GA) to determine optimal parameters for PID controller that is used to compensate the influence of delay in FOLPD and compare the results with the results of the Iterative Method and Ziegler-Nichols rule. Note that this paper is a part of our previous work [10] that is focused more on the using of GA.
II. DELAY CONFIGURATIONS In a control system, delay components can be found in controlled plant, sensor that measures the output, and/or other parts of the system. In this paper, we assume that the system can be modeled using the following structure.
R(s)
+
G(s)
C(s)
e −Ts
-
H(s)
PID controller can be used to improve stability of time-delay systems because it can increase stability margin and reduce %overshoot and settling time. However, there are some limitations that should be mentioned: (1) it is only reliable for delay smaller than process time constant, (2) it is sensitive to noise, and (3) it is not suitable for nonlinear interactive models [1]. Here, we will use a PID controller to improve stability of a system with time delay. The system under consideration is assumed to have been modeled by first order with time delay. Because most of higher order systems in industrial processes can be modeled using this formulation [6], it can be expected that the simulation results are sufficiently descriptive for real cases. The following equation gives such a model:
Fig. 3. Delay configuration of interest.
G(s) =
There are other possible configurations, the most common ones are delay at the feedback, the input, and the output. The following figures depict these configurations.
R(s)
+
G(s)
e
−Ts
C(s)
R(s) +
-
-
1 Ti s R(s)
H(s)
+
e −Ts
H(s)
(a)
R(s) +
The following figure shows the schematic of the PID controller and plant with Gp(s) = 1/(1+sTp)
C(s)
G(s)
X
e −Ts
G(s)
C(s)
R(s)
e −Ts
+
+
Kc
+
X
U(s)
G p ( s )e
− sτ p
Y(s)
+
Td s G(s)
C(s)
-
Figure 6. PID controller and plant.
H(s)
H(s)
(c)
(d)
Fig. 4. Delay configurations in control systems.
IV. THE GA OBJECTIVE FUNCTIONS
For configuration 4(c) and 4(d), the delay components are not in the closed loop, so they do not affect system stability (they only shift the output/input without changing the control signal or the system response). For configuration 4(b), since we can transform it into the following equivalent configuration: R(s)
E(s) -
(b)
-
Ke − sτ 1 + sT
+ 1 / H ( s )e −Ts
G ( s ) H (s )
e −Ts
C(s)
-
Fig. 5. Equivalent configuration for 4(b).
then, the configuration inside the loop which can influence the stability is similar to 4(a). Consequently, for stability analysis it suffices to consider only system in fig. 3. III. PID CONTROLLERS PID controllers are the main controllers in industries (more than 90% [5]). It has high level of robustness, and is easy to operate and understand because of the structural simplicity. A
The most crucial step in applying GA is to choose the objective functions that are used to evaluate fitness of each chromosome. Some works [4, 7] use performance indices as the objective functions. In [4] author uses Mean of the Squared Error (MSE), Integral of Time multiplied by Absolute Error (ITAE), Integral of Absolute Magnitude of the Error (IAE), and Integral of the Squared Error (ISE), while in [7] authors use ISE, IAE, and ITAE. Here we use all four performance indices stated above and Integral of Time multiplied by the Squared Error (ITSE) to minimize the error signal E(s) and compare them to find the most suitable one. The performance indices are defined as follow [8]: τ τ τ 1 2 MSE = ∫ (e(t ) ) dt , ITAE = ∫ t e(t ) dt , IAE = ∫ e(t ) dt , t0 0 0 τ
τ
0
0
ISE = ∫ e(t ) 2 dt , and ITSE = ∫ te(t ) 2 dt
(1)
where e(t) denotes the error signal in time domain. The PID controller is used to minimize the error signals, or we can define more rigorously in the term of error criteria: to minimize the values of performance indices mentioned above. And because these values are inversely proportional to the
fitness of the corresponding chromosomes, we define the fitness of the chromosomes as:
fitness value =
1 performance index
V. EXPERIMENTAL RESULTS The first and most crucial step in using GA is to encode the problem into suitable chromosomes and then construct the population. Here we use MATLAB GA Toolbox [9]. Some works recommend 20 to 100 chromosomes in one population; the more the number of chromosomes, the better the chance to get optimal results. However, because the running time must also be considered, we use 80 or 100 chromosomes in each generation. Encoding is done in real number rather than binary encoding because the latter discards the parameter values if exceeding machine precision. Each chromosome comprises of three parameters, Kd, Kp, Ki, with value bounds vary depending on the delay and the objective functions used. After some trials, we found that the value bounds should be set according to the Iterative Method and Ziegler-Nichols rule range to ensure the convergence (there were many cases which the convergence can’t be reached if we set the parameter value bounds arbitrarily, even though the optimal results are included in the range). The population in each generation is represented by 80 x 4 or 100 x 4 matrix (depending on the number of chromosomes in the population) which each row represents one chromosome that comprises Kd, Kp, Ki values and the last column appended to accommodate fitness values (F) of the corresponding chromosomes.
numbers and provides more than one crossover points. And we set four crossover points because each chromosome comprises of three alleles (one point crossover cannot accommodate three alleles in one operation). Mutation is done by setting mutation probability around 0.1 percent. In general, mutation operations should not be done too often because the searching process will transform into random search if the mutation probability is too high. Figure 7 depicts the standard performance measures of a typical system driven by unit step input. Percent overshoot is defined as the point where the system response reaches the peak. There are several criteria for settling time, for example 1% criterion, 2% criterion, and 5% criterion. Here we use 5% criterion for settling time. And rise time is defined as the time needed by the system to reach the final value. For measurement simplicity, we use 95% of the final value. Peak time is the point where the maximum value is reached (the overshoot value). And error signal is the difference between the input signal magnitude and system response final magnitude. We use G(s) = 1/s+1 and the delay is in the range of 0.01 to 1 second. Because the systems are compensated by using PID controller, error signals are always zero. In addition we also calculate the performance indices in Iterative Method and Ziegler-Nichols rule cases because we want to compare the results of these tuning rules with the results of GA. Ideally, we would expect GA results should be always better than the results of the tuning rules. To calculate performance indices, we approximate the integrals in equation (1) with summations by using 0.01 second as the sampling time and setting upper limit of the summations to 15 second for all cases. 60 Ziegler Nichols Iterative Method MSE IAE ISE ITAE ITSE
50
K p1 K p2
K i1 K i1
. .
. .
K pn
K in
F1 ⎤ F2 ⎥⎥ . ⎥ ⎥ . ⎥ Fn ⎥⎦
chromosome1 chromosome 2 . . chromosome n
40
Percent Overshoot
⎡ K d1 ⎢K ⎢ d2 ⎢ . ⎢ ⎢ . ⎢ K dn ⎣
30
20
10
0
0
0.1
0.2
0.3
0.4
0.5
0.6
0.7
0.8
0.9
1
Delay in second
(a). Percent overshoots (PO).
5
4.5
4
Settling time 5% criterion
We use maximum generation to terminate the program rather than using the change rates of the best chromosome fitness values because we want to control the running time. After several trials it is shown that there is no visible improvement after 300th generation, so we set 300 as the maximum generation. The MATLAB GA Toolbox provides three selection techniques: Tournament Selection, Roulette Wheel Selection and Normalize Geometric Selection. Since Tournament Selection requires more execution time and Roulette Wheel Selection allows the weaker chromosomes to be selected many times, we use Normalized Geometric Selection to choose the parents. After parents are selected, the crossover operation is conducted. We use arithmetic crossover (arithXover.m) function because it is specifically used for floating point
3.5
3
2.5
2
1.5
Ziegler Nichols Iterative Method MSE IAE ISE ITAE ITSE
1
0.5
0
0
0.1
0.2
0.3
0.4
0.5
0.6
0.7
Delay in second
(b). Settling time (ST).
0.8
0.9
1
1
Rise time in second (logarithmic scale)
10
Ziegler Nichols Iterative Method MSE IAE ISE ITAE ITSE
0
10
-1
10
-2
10
0
0.1
0.2
0.3
0.4
0.5
0.6
0.7
0.8
0.9
1
Delay in second
(c). Rise time (RT). 2
Peak time in second (logarithmic scale)
10
Ziegler Nichols Iterative Method MSE IAE ISE ITAE ITSE
1
10
0
10
-1
10
-2
10
0
0.1
0.2
0.3
0.4
0.5
0.6
0.7
0.8
0.9
1
Delay in second
(d). Peak time (PT). 3
Stability margin (logarithmic scale)
10
Ziegler Nichols Iterative Method MSE IAE ISE ITAE ITSE
2
10
1
10
0
10
0
0.1
0.2
0.3
0.4
0.5
0.6
0.7
0.8
0.9
1
Delay in second
(e). Stability margin (SM). Fig. 7. Five standard performance measures.
A. Standard performance measures Percent Overshoot: Figure 7(a) shows percent overshoots with respect to delay time, and row %OV in table 1 gives the average values. As shown, the Ziegler-Nichols (ZN) rule gives the highest values for all delay times, consequently its average value is the highest also, 38%. The differences between the tuning methods and GA are easily spotted out. The tuning methods have almost the same pattern, i.e., the percent overshoot values keep decreasing as the delay time grows (except for small delay times where the Ziegler-Nichols rule values are increasing). On the other hand, GA gives almost constant values, around 10% as long as the delay times are not too small (except for the ITAE case where the percent overshoots fluctuate and decrease as the delays increase). Table 1 shows that GA produces much better percent overshoots than the tuning methods, especially if the objective function is IAE. So it can be concluded that GA can be used to optimize percent overshoots.
Settling Time: The values of settling time (5% criterion) over the delays are summarized in figure 7(b). As shown, all methods, except GA optimized by IAE and ITAE, show almost the same pattern: straight lines with positive slopes. It means that the settling times linearly increase with the delays. As shown in row ST in table 1, the average values of the settling time are not so different between methods except for GA optimized by ITAE and IAE. However, because the other GA results are in agree with the tuning methods, it can be said that settling times cannot be optimized by GA. Rise Time: Rise times are plotted in figure 7(c) where y axis is in logarithmic scale. We can see strong pattern where all results, except for the Iterative Method, have almost the same pattern. Consequently the average values are almost the same (around 0.44 to 0.59 second) also, except for Iterative Method which is 0.912 second. From row RT in table 1, the best result is given by Ziegler-Nichols rule: 0.444 second and the worst is Iterative Method: 0.912 second. And all GA methods produce almost the same average value. But because GA results are not so different compared to the Ziegler-Nichols rule, it can’t be concluded that GA can optimize rise time. Peak Time: Peak time plots show almost the same pattern as in the rise time plots. But we must pay attention on GA optimized by ITAE because there is a range which its values are bigger than the others. Except for Iterative Method which is 3.43 second, all others methods produce peak time around 0.57 second to 0.83 second. The best values are given by GA optimized by MSE and ISE, 0.576 second. Because GA methods produce peak time plots which are only better than Iterative Method, not Ziegler-Nichols rule, it can be stated that peak time can’t be optimized by GA. Stability Margin: The last standard performance measure is stability margin. Stability margin is the maximum gain can be set before system response goes into sinusoidal cycle. In the simulations, this can be done by increasing Kc until sinusoidal cycle happens. And stability margin of corresponding system is the Kc value at sinusoidal cycle. As shown all curves show the same pattern. So GA cannot outperform the tuning methods in improving the stability margin. TABLE I. AVERAGE OF STANDARD PERFORMANCE MEASURES. Parameter
ZN
IM
%OV
38%
15%
ST
1.53
1.54
RT
0.444
PT
0.613
SM
36.25
GA MSE
IAE
ISE
ITAE
ITSE
10%
6%
11%
10%
8%
1.47
1.01
1.45
0.745
1.37
0.912
0.453
0.495
0.455
0.588
0.474
3.43
0.576
0.622
0.576
0.836
0.597
37.86
33.68
33.8
24.4
36.8
32
B. Performance Indices Table 2 summarizes performance indices from simulations. As expected, the average values of GA are always smaller than the corresponding average values of Ziegler-Nichols rule and Iterative Method. Moreover Ziegler-Nichols rule produces
smaller average values than Iterative Method for all range of delays. Although it can be seen that MSE has the smallest average value for all the three methods, and IAE has the largest average value for Ziegler-Nichols and GA, it doesn’t imply that one must use MSE and must avoid using IAE as the objective function in GA because the performance indices have different definitions and cannot be compared. Moreover, as shown in table 1, GA optimized by MSE only produces the best result in the peak time measurement.
differences between GA and the tuning methods results, except for ITAE, are not impressive enough to come into conclusion that GA is much better than the tuning methods in minimizing the error criteria.
VI. CONCLUSION
REFERENCES
Delay components are always present in a control system as it takes time for the control signal to flow from one point to another point within the system. The main concern in this paper is the influence of the delays to system stability. As only delays that are located inside the system’s closed loop can affect the stability, it suffices to analyze system with delay as shown in figure 3. PID controller parameters optimization using the Iterative Method can improve the stability of the system with delay significantly. Compared to the uncompensated system, in average it improves stability margin more than threefold, %overshoot more than twofold, settling time more than 30%, and eliminates error signals completely. GA applied to optimize parameters of the PID controller offers better transient response compared to the results offered by the two tuning methods. This is shown by reduction of average percent overshoots by more than 70% and 30% with respect to Ziegler-Nichols rule and Iterative Method while keeping the rise time and peak time almost unchanged and improving the settling time. However, there is a payoff in the stability margin which reduces slightly compared to the tuning methods. The average values of GA performance indices, as expected, are always smaller than the corresponding Ziegler-Nichols and Iterative Method values. Moreover Ziegler-Nichols rule produces smaller average performance indices values than the Iterative Method does for all delay range. However, the
[1] A. O’ Dwyer, The Estimation and Compensation of Processes with Time Delays, Ph.D. Thesis, School of Electronic Engineering, Dublin City University, 1996. [2] G.F. Franklin et al., Feedback Control of Dynamic Systems, 3rd edition, Addison-Wesley Publishing Company, 1994. [3] A. Mirzal et al., “Approximation and Compensation of Delay in Analog Control Systems,” 精密工学会北海度支部学術講演会, Sapporo, Japan, 2006. [4] I. Griffin, On-line PID Controller Tuning using Genetic Algorithms, Dublin City University, 2003. [5] A. O’ Dwyer, Estimation of model parameters (including time delay) in a Smith Predictor structure, Technical Report No : AOD.98.04, Dublin Institute of Technology, 1998. [6] D. Chen, and D.E. Seborg, “PI/PID Controller Design Based on Direct Synthesis and Disturbance Rejection,” Industrial and Engineering Chemistry Research, Vol. 41 (19), pp. 4807-4822, 2002. [7] T. O’Mahony et al., Genetic Algorithms for PID Parameter Optimization, Minimizing Error Criteria, pp. 148-153, Cork Institute of Technology, Cork, Ireland [8] R.C. Dorf, and R.H. Bishop, Modern Control Systems, 10th Edition, Pearson Prentice Hall, 2005. [9] C. R. Houck et al., “A Genetic Algorithm for Function Optimization: A Matlab Implementation,” ACM Transactions on Mathematical Software, 1996. [10] A. Mirzal, “Stability Analysis and Compensation of Time Delays in Analog Control Systems,” Int’l J. Control and Automation, Vol. 5, No. 4, pp. 1-18, 2012.
ACKNOWLEDGMENT The author would like to thank the reviewers for useful comments. This research was supported by Ministry of Higher Education of Malaysia and Universiti Teknologi Malaysia under Exploratory Research Grant Scheme R.J130000.7828. 4L095.
TABLE II. SUMMARY OF PERFORMANCE INDICES. Delay
Ziegler-Nichols
Iterative Method
GA
MSE
IAE
ISE
ITAE
ITSE
MSE
IAE
ISE
ITAE
ITSE
MSE
IAE
ISE
ITAE
ITSE
0.01
0.000973
2.992285
1.461115
0.073894
0.020615
0.000927
2.730597
1.391095
0.061045
0.014833
0.00081
1.623776
0.840777
0.011395
0.005388
0.025
0.002626
6.927413
3.942144
0.432876
0.124957
0.002313
6.300772
3.471926
0.391845
0.089213
0.001884
3.701027
2.827366
0.218351
0.038659
0.05
0.004988
12.98842
7.487622
1.580628
0.452425
0.004376
11.6831
6.567769
1.452929
0.318439
0.003708
7.09663
5.57464
0.301924
0.155625
0.075
0.007197
18.53609
10.80309
3.249557
0.929874
0.006334
16.58511
9.507315
2.979748
0.642704
0.005508
10.75044
8.266998
0.754851
0.350289
0.1
0.009284
23.69959
13.93484
5.304512
1.517501
0.008226
20.99624
12.34746
4.801577
1.035597
0.0073
13.86607
10.95693
1.526731
0.622276
0.25
0.020422
48.31448
30.65349
20.82159
6.345217
0.019092
40.69953
28.65714
15.58065
4.507248
0.017983
34.18455
26.99306
7.69427
3.854827
0.5
0.037119
76.26794
55.71523
45.56416
17.73724
0.037603
71.60299
56.44149
37.68745
16.79849
0.035612
67.45696
53.45713
30.00848
15.15463
0.75
0.05416
108.6372
81.29453
91.98153
36.10692
0.057392
123.8553
86.14606
146.8766
42.31687
0.053071
100.0041
79.65463
63.58332
33.54903
1
0.072117
146.0676
108.247
174.114
65.18471
0.077665
176.087
116.5754
298.2008
81.12556
0.070379
134.0671
105.6145
111.3298
58.69364
Av.
0.02321
49.38123
34.83767
38.12475
14.26883
0.02377
52.28229
35.6784
56.44808
16.31655
0.021806
41.41674
32.68734
23.93657
12.4916