e-mail: [email protected]. Daniel R. Boles, Law .... Two well attended training seminars were conducted. ... gotiations and marketing opportunities for conference ...
ENVIRONMENTAL GEOTECHNICS
Desiccation Cracks Result in Preferential Flow Eric C. Drumm, Daniel R. Boles, Glenn V. Wilson Introduction Recent research related to waste site closure caps and clay barriers has primarily focused upon conditions and proceduresfor barrier construction, and regulatory requirements to assure that clay barriers are constructed to minimize hydraulic conductivity. Less emphasis has been placed upon changes in hydraulic conductivity associated with post-compaction variations in water content. Little guidance is provided to assure protection during construction and maintenance during the facility service life. It has been generally assumed that desiccation problems are eliminatedafter placement of the upper protective layers (Daniel and Benson, 1990). However, soil water storage is not a static property of a soil, but a time dependent variablebased upon the rates of soil water inflow and outflow. Clay barriers can be expected to experience cycles of saturation and drying. Desiccation during construction has long been recognized as leading to increases in hydraulic conductivity (Kleppe and Olson, 1985). Field investigations of constructed clay liners have indicated that high hydraulic conductivities generally result from hydraulic defects in the clay due to construction methodologies and/or desiccation cracking due to inadequate protection after construction (Daniel, 1984; Day and Daniel, 1985; Benson and Daniel 1990; Elsbury et. al., 1990; Rogowski, 1990).Daniel and Wu (1993) suggested a methodology for modification of the hydraulic conductivity zone of acceptability (water content versus dry density) to minimize shrinkage potential. To properly assess the long-term integrity of compacted clay barriers and developappropriate maintenance measures, an understanding of the shrinkage induced volume changes and the development of preferential flow paths must be obtained. A laboratory investigation utilizing Iysimeters was conducted to 22
Geotechnical News,
June 1997
measurement of the hydraulic gradient across the sample, yet permits the development of preferential flow paths between the shrinking intact clay aggregates (Phifer et al. 1995). Although more representative of the conditions occurring in the field, volumetric strain and density changes are more difficult to obtain in the Iysimeter than in the FWP. A series of laboratory Iysimeter tests was designed to evaluate the effects of desiccation cycles on the formation of preferential flow paths (cracks) in clay.
13
Stone
and Water
~D
§
Base
Filter
Fabric
Sand Collection Bonle
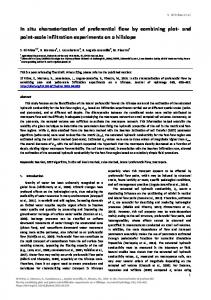
Figure 1. Plan view of individual chambers of lysimeters (Top), Cross-section of lysimeter (Bottom) evaluate the effects of post-compaction water content variations on the saturated hydraulic conductivity of a soil that has been used for hydraulic barriers.
Laboratory Lysimetersversus Flexible
Wall
Flexible Wall Permeameter (FWP) tests for hydraulic conductivity permit precise control over the hydraulic gradient during testing, and permit measurement of the volumetric strain due to desiccation. It has been suggested (Phifer et al. 1995) that the geometry of the FWP sample limits the formation of preferential flow paths. When subjected to drying events, FWP specimens undergo shrinkage of the intact clay aggregates. This results in an increase in density or decrease in void ratio and a corresponding decrease in hydraulic conductivity of the clay aggregate. In the field, clay barriers subjected to desiccation undergo shrinkage which may form preferential flow paths between aggregates. The geometry of thin laboratory Iysimeter specimens allows direct
Lysimeter Construction The Iysimeters 'vere constructed of welded polyvinyl chloride (PVC), with a diameter of 0.75 m (29.5 in) and depth of 0.62 m (24 in), Figure I. To investigate the spatial variation of preferential flow within the sample, the Iysimeter outflow collector was divided into 14 sectors, each of which permitted an independent measurement of flow and calculation of hydraulic conductivity. The water collection sectors were 80 mm (3.2 in) tall, filled with compacted Ottawa sand, and covered with a layer of Supac@16NP-L17800 geosynthetic filter. The soil specimen was placed immediately above the geosynthetic filter. It was assumed that the sand and geosynthetic have a negligible effect on the hydraulic conductivity measurements of the barrier, provided the hydraulic conductivity, K, of the barrier is significantly lower than that of the sand, yet large enough that the flow through the system is greater than the water storage capacity of the sand. Thus, it was assumed that the maximum hydraulic conductivity that could be measured in the Iysimeter was about I x \O-4cm/sec,and the smallest detectable conductivity was about 1 x \0-9 cm/s. The entire Iysimeter was elevated and erlenmeyer flasks were connected beneath each sector to collect the flow.
,
ENVIRONMENTAL GEOTECHNICS
The two outer sectors (#13 and #14, Figure 1)were intended to intercept any sidewall leakage from water that passed between the sample and the lysimeter wall, and were not used in the conduc-
tivity determination. The computed conductivity through each of the 12 internal sectors could then be computed and compared withthe overallhydraulic conductivity.
13
Figure 2. Map of Surface Cracks after First Desiccation Cycle
Table 1 Hydraulic Conductivity by Sector for each Saturation Cycle Sector
Initial Measurement, Saturation 1 (cm/sec)
Saturation 2 (cm/sec)
Saturtion 3 (cm/sec)
1
2 x 10⁻⁶
0.0
3 x 10⁻⁵
2
1 x 10⁻⁷
0.0
>1 x 10⁻⁴
3
2 x 10⁻⁷
0.0
>1 x 10⁻⁴
4
8 x 10⁻⁸
6 x 10⁻⁷
2 x 10⁻⁷
5
2 x 10⁻⁵
1 x 10⁻⁶
5 x 10⁻⁶
6
0.0
3 x 10⁻⁵
>1 x 10⁻⁴
7
1 x 10⁻⁶
2 x 10⁻⁶
>1 x 10⁻⁴
8
6 x 10⁻⁶
5 x 10⁻⁶
>1 x 10⁻⁴
9
0.0
7 X10⁻⁶
>1 x 10⁻⁴
10
6 x 10⁻⁷
7 x 10⁻⁵
>1 x 10⁻⁴
11
3 x 10⁻⁶
1 X10⁻⁷
>1 x 10⁻⁴
12
3 x 10⁻⁵
2 x 10⁻⁷
2 x 10⁻⁵
Overall (based on all sectors
1.3 x 10⁻⁶
7 x 10⁻⁶
1.4 x 10⁻⁴
Preparation of Clay Barrier Specimen The soil was obtained from the West Chestnut Ridge borrow area in eastern Tennessee and had been used for cap construction at the Department of Energy's Oak Ridge Operations site. This soil is similar to that investigated by Daniel and Benson (1990). A comparison of the shrinkage induced volume changes exhibited by this materialunder flexible wall permeameter conditions and laboratory lysimeter conditions was described by Phifer et aI. (1995). The soil is classified as a high plasticity clay, with a liquid limit =61 and plastic limit = 31. The Standard Proctor maximum dry density = 1.37 Mglm3 and the optimum volumetric water content =33 percent (Boles 1994).Kaolin is the primary clay mineral (Lee et aI. 1984). After being passed through a number 4 sieve,the soil was compacted at about 3 percent above optimum water content in two lifts to obtain a density of about 88 percent standard Proctor density.The final height of the specimen was about 76 mm (3 in). Toprevent swelling of the soil and simulate a topsoil overburden, a layer of gravel was placed on the soil resulting in a stress of approximately 6 kPa (0.9 Ibslin2). The gravel was separated from the soil by a layer of the geosynthetic material. Additional details are provided elsewhere (Boles 1994). Hydraulic Conductivity Measurements The specimen was saturated under a constant head of 0.33 m (13 in), and the flow from each sector collected in flasks. An additional flask was maintained to permit correctionfor anywater lost due to evaporation. The hydraulic conductivity was calculated by Darcy's Law based on the hydraulic gradient across the sample and the area of the collectionsector.The hydraulicconductivity measurements for each of the 12 sectors are listed in Table 1.Also shown is the overall hydraulic conductivity of the entire Iysimeter based on the sum of the flow and area from all 12 sectors. After reaching steady state flow and determining the hydraulic conductivity, the water and overburden were removed June 1997
2:J
ENVIRONMENTAL GEOTECHNICS from about 1.3 x 10⁻⁶em/see to about 7 x 10.6 em/sec. This relatively modest increase in K was accompanied by a conductivity decrease in 8 of the Iysimeter sectors, and an increase in only 4 sectors. This suggests that the shrinkage-induced volume change decreases the conductivity in some crack-free sections of the barrier and
. Overall K
RUN t = 1.3 x 10-. cm/s
RUN 2 OverallK =7.0 x 10-. cm/s
LEGEND
D Fl ~ F7l Ed
10-10em/. .
10-. em;'
.
10-0 em/.
.. . .
EEillillJ 10-1 em/.
II
.
10-6 em/.
11II 10-0 emf. RUN:t Overall
K > 1.4 x 10-' cm/s
10-4 emf.
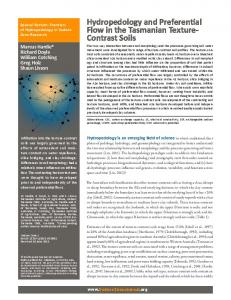
Figure 3. Measured Hydraulic Conductivity by Lysimeter Sector and the sample permitted to dry. The drying resulted in a number of cracks on the surface of the clay specimen, as mapped in Figure 2. The overburden was then replaced and the constant head flow condition restored. After reaching steady flow, the desiccation process was repeated. Swelling of the clay due to the removal of the overburden was observed to be negligible.
of the computed hydraulic conductivity in each of the Iysimeter sectors, for each of the three saturation (two dry-back) cycles. The Iysimeter sectors are shaded in proportion to the computed value of hydraulic conductivity. The following observations can be made:
.
Results The specimen had an initial overall hydraulic conductivity of about 1.3 x 10⁻⁶ em/see, which increased to about 7 x 10⁻⁶em/see after the first cycle of drying (gravimetric water content decrease of about 4.5 percent). After the second desiccation cycle, corresponding to a water content decrease of an additional 4 percent, the conductivity increased to more than 10.4 em/sec. Figure 3 is a schematic 24
GeotechnicalNews,
June 1997
.
Prior to being subjected to drying, the relatively homogeneous compacted clay barrier yielded measurements of hydraulic conductivity that varied 3 orders of magnitude across the sample. This suggests that hydraulic conductivity measurements are dependent upon the soil volume through which the flow is measured. Internal or invisible defects in the barrier may contribute to the quantity of flow. After the first drying cycle the overall hydraulic conductivity increased
.
causes cracks and conductivity creases in other sections.
in-
After drying, the sections in which cracks were observed tended to produce conductivities on the order of that of the entire sample, while the sections with fewer cracks tended to have lower values of K. Therefore, it can be concluded that the regions with cracks tended to dominate the conductivity of the entire sample, and that measurements of conductivity should be made over areas sufficiently large to reflect the overall barrier properties. After the second, more severe dryback cycle corresponding to nearly a 9 percent decrease from the compaction water content, the hydraulic conductivity exceeded the upper limit at which hydraulic conductivity can be recorded in the Iysimeters (1 x 10⁻⁴ em/see). The value of conductivity increased in all but one Iysimeter segment. In general, the 4 sectors with K