5151 State University Drive, Los Angeles, California 90032, USA. 5Department of Mechanical .... dissolving 5.5 g into 100 ml of ultrapure water. As(III) work-.
REVIEW OF SCIENTIFIC INSTRUMENTS 80, 104101 共2009兲
Design and development of an automated flow injection instrument for the determination of arsenic species in natural waters Grady Hanrahan,1 Tina K. Fan,2 Melanie Kantor,3 Keith Clark,4 Steven Cardenas,4 Darrell W. Guillaume,5 and Crist S. Khachikian6 1
Department of Chemistry, California Lutheran University, 60 West Olsen Road, Thousand Oaks, California 91360-2787, USA 2 Department of Civil and Environmental Engineering, University of California, Berkeley, 760 Davis Hall, Berkeley, California 94720-1710, USA 3 School of Humanities and Sciences, Stanford University, 450 Serra Mall, Stanford, California 94305, USA 4 Department of Chemistry and Biochemistry, California State University, Los Angeles, 5151 State University Drive, Los Angeles, California 90032, USA 5 Department of Mechanical Engineering, California State University, Los Angeles, 5151 State University Drive, Los Angeles, California 90032, USA 6 Department of Civil Engineering, California State University, Los Angeles, 5151 State University Drive, Los Angeles, California 90032, USA
共Received 15 September 2008; accepted 17 July 2009; published online 13 October 2009兲 The design and development of an automated flow injection instrument for the determination of arsenite 关As共III兲兴 and arsenate 关As共V兲兴 in natural waters is described. The instrument incorporates solenoid activated self-priming micropumps and electronic switching valves for controlling the fluidics of the system and a miniature charge-coupled device spectrometer operating in a graphical programming environment. The limits of detection were found to be 0.79 and 0.98 M for As共III兲 and As共V兲, respectively, with linear range of 1 – 50 M. Spiked ultrapure water samples were analyzed and recoveries were found to be 97%–101% for As共III兲 and 95%–99% for As共V兲, respectively. Future directions in terms of automation, optimization, and field deployment are discussed. © 2009 American Institute of Physics. 关doi:10.1063/1.3202083兴
I. INTRODUCTION
In natural waters, arsenic exists in a variety of forms including the inorganic species arsenite 关As共III兲兴 and arsenate 关As共V兲兴 as well as bound to particulates and organic matter.1,2 As共III兲 and As共V兲 species are considered the most abundant species, with As共V兲 being thermodynamically stable under oxic conditions.3 In reducing conditions, such as those in naturally occurring geothermal systems,3–5 As共III兲 dominates.6 As共III兲 is more toxic than As共V兲,7 with both affecting the health of millions of people worldwide. Ultimately, the concentrations and speciation of As共III兲 and As共V兲 are determined by various abiotic and biologically mediated biogeochemical processes.3,8–10 Traditionally, water quality was assessed by collecting aquatic samples in the field with subsequent measurement of arsenic levels by standard laboratory analytical techniques 关e.g., atomic fluorescence spectroscopy, graphite furnace atomic absorption, and inductively coupled plasma-mass spectrometry 共ICP-MS兲兴.11,12 Such methods excel for routine analysis of total arsenic concentrations but fail in their attempt to measure arsenic speciation 关e.g., As共III兲 and As共V兲兴. The use of efficient separation techniques 共e.g., ion exchange, high performance liquid chromatography, and capillary electrophoresis兲 coupled with routine detection methods 共e.g., ICP-MS兲 has been shown to allow sensitive and selective determination of arsenic species.13–16 The above laboratory techniques have proved successful in the determination of arsenic in natural waters. Unfortu0034-6748/2009/80共10兲/104101/5/$25.00
nately, species stability, storage, and preservation are major issues of concern when attempting to maintain the original concentration and reliable speciation information when performing laboratory-based analyses.11,17,18 In order to maintain the integrity of the sample and to help prevent possible contamination, sensitive and selective field-based techniques are needed. Various electrochemical,19–22 biosensor-based,23 and colorimetric methods24–31 have shown promise for fieldbased detection of arsenic species. In this study, a fully automated flow injection-based instrument was designed and developed for the determination of As共III兲 and As共V兲 in natural waters. The instrument incorporated self-priming micropumps and electronic switching valves for controlling the fluidics of the system. A graphical user interface was created and used to control automated injection sequences and to allow continuous data acquisition. The instrument incorporated a miniature diode array spectrometer with fiber optic cables for full spectrum acquisition. Laboratory development and analytical performance are presented and future laboratory and field-based studies considered. II. MATERIALS AND METHODS A. Reagents and solutions
All solutions were prepared in ultrapure water 共Barnstead NanoPURE®, 18.2 M⍀兲, and all reagents were of analytical 共or equivalent兲 grade. All containers, bottles and glassware used during this study were cleaned overnight
80, 104101-1
© 2009 American Institute of Physics
104101-2
Rev. Sci. Instrum. 80, 104101 共2009兲
Hanrahan et al.
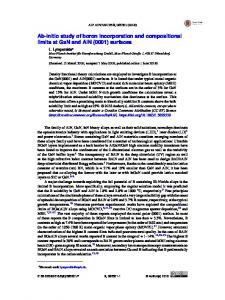
FIG. 1. Schematic of the prototype FI instrument for the analysis of As共III兲 and As共V兲 in natural waters. S = sample, R1 = mixed KI/ KIO3, R2 = ultrapure water, R3 = ammonium molybdate, and R4 = ascorbic acid.
with nutrient free detergent 共Neutracon®, Decon Laboratories, U.K.兲, rinsed three times with ultrapure water, and soaked in 1% 共v/v兲 HNO3 for at least 24 h. All were then rinsed three times with ultrapure water and dried at room temperature. The mixed-iodide/iodate solution was prepared by dissolving 0.3566 g of KI 共Sigma兲 and 0.0834 g of KIO3 共Mallinckrodt兲 in 250 ml of ultrapure water. The ammonium molybdate solution was prepared by dissolving 10 g of ammonium molybdate 共Fisher兲 and 28 ml of H2SO4 into 1 l of ultrapure water. The ascorbic acid 共Fisher兲 was prepared by dissolving 5.5 g into 100 ml of ultrapure water. As共III兲 working standards in the range of 0 – 25 M were prepared daily from a stock solution of 500 M As2O3 共Sigma兲. As共V兲 working standards in the range of 0 – 25 M were prepared daily from a stock solution of 500 M Na2HAsO4 · 7H2O 共Sigma兲.
both schemes is shown by darkened lines with arrows. Various reaction coil lengths were tested with this system and the optimum length of 30 cm was used for all reaction coils. Sample
a Sample
Sample Pump
NO
Carrier Valve
Carrier Pump
COM
NC
KI/KIO 3
Waste
COM
COM NC
NO
NC NO
NO
COM
Water
NC
Ammonium Molybdate
T-Piece
Reagent Pump
Coil 1 Coil 2
Ascorbic Acid
Reagent Pump
Detector T-Piece
Coil 3
B. Instrument design
A schematic diagram of the completely developed FI system is shown in Fig. 1. The manifold consisted of four solenoid-operated self-priming micropumps 共Series 120SP1210-5T, Bio-Chem Valve, NJ, USA兲 connected to solenoid-operated switching valves 共Series 075T3MP12-32, Bio-Chem, NJ, USA兲 with Teflon tubing 共0.80 mm i.d., Omnifit, Cambridge, U.K.兲. Two operational fluidic format schemes are shown in Figs. 2共a兲 and 2共b兲. Switching valves were set to normally open–common 共NO/COMM兲 when deenergized 关Fig. 2共a兲兴. In this operation mode, the sample pump fills the loop 共110 l兲 with the sample. The effluent from the loop is captured in a waste container. Switching valves were set to normally closed–common 共NC/COMM兲 when power was supplied to the valves 关Fig. 2共b兲兴. In this mode, the predefined sample amount of 110 l is redirected into the carrier stream and mixes with the appropriate reagents for chemical analysis 共see description below for complete details兲. The flow of sample/reagents in
b
Sample COM
COM
Sample
Sample Pump
NO
Carrier Valve
Carrier Pump
COM
KI/KIO 3
NC
NC
NO
NO
COM
Waste
NC NO
Water
NC
Ammonium Molybdate
Reagent Pump
T-Piece
Coil 1 Coil 2
Ascorbic Acid
Reagent Pump
Detector T-Piece
Coil 3
FIG. 2. 共a兲 Fluidic schematic of the FI instrument showing switching valves set to NO/COMM when de-energized. 共b兲 Fluidic schematic of the FI instrument showing switching valves were set to NC/COMM when power was supplied to the valves. The flow of sample/reagents in both schemes is shown by darkened lines with arrows.
104101-3
Rev. Sci. Instrum. 80, 104101 共2009兲
Hanrahan et al.
TABLE I. 3 day and pooled FI calibration data for As共III兲. Calibration 1 关As共III兲兴 共M兲 0 2.5 5 10 15 25 r2 Slope Intercept 共absorbance兲
Mean absorbance 0.0002 0.0105 0.0249 0.0538 0.0811 0.1177 0.9904 0.0048 0.0016
Calibration 2
RSD 共%兲 共n = 3兲 3.4 3.8 2.1 6.0 1.2 1.1
Mean absorbance 0.0002 0.0096 0.0239 0.0514 0.0758 0.1141 0.9937 0.0047 0.0001
A USB4000-UV-Vis miniature fiber optic spectrometer 共Ocean Optics, Inc., Dunedin, FL, USA兲, which includes two 200 M fiber optic cables featuring a 3648-element linear charge-coupled device array 共responsive from 200–850 nm兲 was used for detection. The light source was a miniature deuterium tungsten halogen lamp 共Ocean Optics, Inc., FL, USA兲. Both were connected to a fiber optic SubMiniature version A 共SMA兲 Z-flow cell 共FIAlab Instruments, WA, USA兲 with SMA connectors. An inert polytetrafluoroethylene membrane debubbler 共Bio-Chem Valve, NJ, USA兲 was incorporated to help remove air bubbles from the reagent stream. A five-port injection valve 共11500 series, Omnifit, NJ, USA兲 was incorporated for switching reagents introduced using pump 2. A Topward 3303A dc supply 共Test Equity, CA, USA兲 was used for all power generation. III. RESULTS AND DISCUSSION A. Graphical programming environment
A custom graphical program and user interface was written in the LABVIEW 共National Instruments Corp., Austin, TX, USA兲 environment for all manifold control and data acquisition. This development employed a written VIRTUAL INSTRUMENT 共VI兲 in language G with two structures to repeat the execution of a subdiagram: the While Loop and the For Loop. Other structures of G include attribute nodes, arrays, case and sequence structures, and clusters and graphs to display the appropriate data. VIs contain an active user interface 共front panel兲 containing knobs, push buttons, graphs, and other controls and indicators. Within this interface, all pumps, valves, lamp spectrum, spectrometer response, and switching sequences are automatically controlled. In addition, data are collected for each run and sent to a file for storage and further processing. B. Miniature pump calibration
Linear calibration curves obtained from pumps 2 共carrier兲, 3 共reagent 1–ammonium molybdate兲, and 4 共reagent 2–ascorbic acid兲 were used to convert digital units 共0–4兲 to flow rates 共ml min−1兲. The flow rate for the sample 共pump 1兲 was not important as this only filled the sample loop until injection into the carrier stream. Calibrations of flow rates resulted in good linear correlation with r2 values of 0.9940,
Calibration 3
RSD 共%兲 共n = 3兲 2.4 5.7 5.6 2.9 4.0 3.9
Mean absorbance 0.0001 0.0117 0.0239 0.0521 0.0724 0.1118 0.9946 0.0045 0.002
Pooled data
RSD 共%兲 共n = 3兲 1.4 3.9 5.5 1.8 3.8 1.8
Mean absorbance 0.0001 0.0106 0.0242 0.0524 0.0764 0.1145 0.9932 0.0047 0.0015
RSD 共%兲 共n = 3兲 3.8 9.5 2.5 2.3 5.8 2.6
0.9981, and 0.9923 for pumps 2, 3, and 4, respectively. Based on the calibrations, 0–4 digital units correspond to flow rate ranges of 0 – 2.3 ml min−1, 0 – 2.2 ml min−1, and 0 – 2.5 ml min−1 for pumps 2, 3, and 4, respectively.
C. As„III… and As„IV… calibration studies
The molybdenum blue complex method32 routinely used for P共V兲 detection can also be used for the detection of As共V兲. Since P共V兲 will likely interfere with As共V兲 determination, several modifications of the molybdenum blue method have been reported.26,27,31,33,34 The multicomponent determination of phosphorus and arsenic species, including a quantification of the interferences among these species, is beyond the scope of this paper and will be studied at a future date. For this study, we modified our previously published method34 used for the determination of phosphite P共III兲 by using a mixed-iodide solution for oxidizing P共III兲 to P共V兲. Here, an increased concentration of the mixed-iodide solution 共with a subsequent increase in ascorbic acid concentration兲 was used to oxidize As共III兲 to As共V兲 for determination spectrophotometrically at max = 700 nm. Using the mixediodide solution, we are able to determine the total arsenic concentration, AsT, in our sample. By switching the fivepoint injection valve connection to pump 2, the mixed-iodide solution is replaced with ultrapure water. With this carrier flow, only As共V兲 is determined spectrophotometrically by the molybdenum blue method. The concentration of As共III兲 is determined as the difference of the concentration of AsT and As共V兲. Conditions for the calibration studies were optimized using a univariate approach. Here, one variable 共e.g., flow rate兲 was modified while maintaining the other variables constant. Optimized flow conditions for reagent lines for As共III兲 were KI/ KIO3 = 0.42 ml min−1, ammonium molybdate= 0.42 ml min−1, and ascorbic acid = 0.25 ml min−1. Optimized flow conditions for As共V兲 were as follows: ultrapure water= 0.35 ml min−1, ammonium molybdate= 0.42 ml min−1, and ascorbic acid = 0.25 ml min−1. The flow rate for the sample 共for each method兲 was not important and was used only to fill the sample loop 共110 l兲 in the injection valve.
104101-4
Rev. Sci. Instrum. 80, 104101 共2009兲
Hanrahan et al.
TABLE II. 3 day and pooled FI calibration data for As共V兲. Calibration 1 关As共V兲兴 共M兲 0 5 2.5 10 15 25 r2 Slope Intercept 共absorbance兲
Mean absorbance 0.0001 0.0137 0.0278 0.0500 0.0780 0.1323 0.9991 0.0052 ⫺0.0001
Calibration 2
RSD 共%兲 共n = 3兲 2.2 5.1 3.8 4.5 3.2 1.5
Mean absorbance 0.0001 0.0135 0.0279 0.0574 0.0783 0.1341 0.9985 0.0053 0.0009
Comparison of the data for three FI method calibrations for As共III兲 and As共V兲 are shown in Tables I and II, respectively, and in Fig. 3. Reproducibility for replicate 共n = 3兲 injections of As共III兲 standards 共0 – 25 M兲 was typically ⬍6.0% relative standard deviation 共RSD兲. The pooled data showed good linear correlation 共r2 = 0.9932兲. For As共V兲, standard 共0 – 25 M兲 reproducibility was typically ⬍5.0% RSD with good linear correlation 共r2 = 0.9998兲 for the pooled data. Representative calibration curves for As共III兲 and As共V兲 are shown in Figs. 3共a兲 and 3共b兲, respectively. The limits of detection were found to be 0.79 and 0.98 M for As共III兲 and As共V兲, respectively, with linear range of 1 – 50 M. For method validation, freshly prepared ultrapure water samples were spiked with 10 M of As共III兲 and As共V兲 and recoveries were measured. Recoveries ranged from 97%–101% for As共III兲 关mean= 99⫾ 4% 共n = 10兲兴 and 95%–99% for As共V兲 关mean= 97⫾ 5% 共n = 10兲兴. The absorbance values at an As共III兲 concentration of 25 M is less than the absorbance value at the same concentration of As共V兲 关see Figs. 3共a兲 and 3共b兲兴. This suggests
FIG. 3. Representative calibration curves for the determination of 共a兲 As共V兲 and 共b兲 As共III兲 in ultrapure water. The error bars are standard errors for triplicate injections. The solid lines are linear least square fit to the data. The dotted lines represent 95% confidence intervals.
Calibration 3
RSD 共%兲 共n = 3兲 3.2 4.6 3.4 0.8 3.2 1.7
Mean absorbance 0.0001 0.0138 0.0283 0.0574 0.0800 0.1360 0.9991 0.0054 0.0008
Pooled data
RSD 共%兲 共n = 3兲 1.0 2.5 2.0 0.9 1.3 0.8
Mean absorbance 0.0001 0.0137 0.0280 0.0548 0.0810 0.1341 0.9998 0.0054 0.0007
RSD 共%兲 共n = 3兲 2.9 1.1 0.9 7.5 3.6 1.4
that the As共III兲 did not undergo a complete reaction or that the iodide solution interferes with either the molybdenum blue reaction or the detection. This is partly the reason why the linear calibration curve-fit in Fig. 3共a兲 does not pass through the 15 M data point. Future work will include an investigation on the effects of the oxidant, the oxidation time, and other environmental parameters on the detection of As共III兲.
IV. CONCLUSIONS
Here, we present the design and development of a novel instrument capable of measuring arsenic species for high resolution 共i.e., analysis every 15 min兲 monitoring. Because of the variability in the composition of natural waters, it is quite difficult to design a standard storage protocol for collection and preservation of these samples. The proposed sensitive and selective flow-through instrument is field deployable, reducing the need to extract and preserve the water sample. A custom written graphical program and user interface allowed fully automated pumping and switching schemes and data acquisition. Preliminary development and laboratory calibration studies have proved successful with good reproducibility and have been validated by spiked sample studies. The instrument prototype described here is in the early development stages and has been applied successfully in ultrapure water samples. The application of this instrument in field studies is more challenging because of the numerous species 共e.g., nitrate and phosphate species兲 that may interfere with the chemical reactions and the detection. For example, we have previously shown successful oxidation of P共III兲 to P共V兲 using the modified molybdenum blue method.34 A similar set of reactions can happen with nitrate species, which are ubiquitous in natural waters.35 By considering the important works of other groups19,26,27,30,31 and the methods they used in their arsenic speciation studies and by adding additional pumps and channels that can accommodate additional chemical reaction steps, this instrument should be able to detect a variety of nitrogen, phosphorus, and arsenic species in natural waters.
104101-5
ACKNOWLEDGMENTS
We would like to thank the National Science Foundation REU Program 共Grant No. EEC-0552921兲 for support of this research. We also thank Dr. Scott Nickolaisen and support from the National Science Foundation REU Program 共Grant No. CHE-0353588兲. G.H. also acknowledges partial support from the National Institutes of Health 共Grant No. 1P20 MD001824-01兲. M. Bissen and F. H. Frimmel, Acta Hydrochim. Hydrobiol. 31, 9 共2003兲. T. Tongesayi and R. B. Smart, Environ. Chem. 3, 137 共2006兲. 3 J. A. Wilkie and J. G. Hering, Environ. Sci. Technol. 32, 657 共1998兲. 4 T. M. Gihring, J. F. Banfield, G. K. Druschel, R. B. McCleskey, and R. J. Hamers, Environ. Sci. Technol. 35, 3857 共2001兲. 5 H. W. Langner, C. R. Jackson, T. R. McDermott, and W. P. Inskeep, Environ. Sci. Technol. 35, 3302 共2001兲. 6 S. Dixit and J. G. Hering, Environ. Sci. Technol. 37, 4182 共2003兲. 7 M. C. F. Magalhaes, Pure Appl. Chem. 74, 1843 共2002兲. 8 H. M. Spliethoff, R. P. Mason, and H. F. Hemond, Environ. Sci. Technol. 29, 2157 共1995兲. 9 N. E. Palmer, J. H. Freudenthal, and R. von Wandruszka, Environ. Chem. 3, 131 共2006兲. 10 T. M. Salmassi, J. J. Walker, D. K. Newman, J. R. Leadbetter, N. R. Pace, and J. G. Hering, Environ. Microbiol. 8, 50 共2006兲. 11 Z. L. Gong, X. F. Lu, M. S. Ma, C. Watt, and X. C. Le, Talanta 58, 77 共2002兲. 12 D. Melamed, Anal. Chim. Acta 532, 1 共2005兲. 13 M. Morita and J. S. Edmonds, Pure Appl. Chem. 64, 575 共1992兲. 14 A. J. Bednar, J. R. Garbarino, M. R. Burkhardt, J. F. Ranville, and T. R. Wildeman, Water Res. 38, 355 共2004兲. 15 S. Simon, H. Tran, F. Pannier, and M. Potin-Gautier, J. Chromatogr., A 1 2
Rev. Sci. Instrum. 80, 104101 共2009兲
Hanrahan et al.
1024, 105 共2004兲. E. Terlecka, Environ. Monit. Assess. 107, 259 共2005兲. 17 J. H. Huang and G. Ilgen, Anal. Chim. Acta 512, 1 共2004兲. 18 G. Bombach, W. Klemm, and A. Greif, Microchim. Acta 151, 203 共2005兲. 19 H. L. Huang and P. K. Dasgupta, Anal. Chim. Acta 380, 27 共1999兲. 20 A. Cavicchioli, M. A. La-Scalea, and I. G. R. Gutz, Electroanalysis 16, 697 共2004兲. 21 N. A. Chaniotakis, K. Jurkschat, G. Reeske, and A. Volosirakis, Anal. Chim. Acta 553, 185 共2005兲. 22 G. Dugo, L. La Pera, V. Lo Turco, and G. Di Bella, Chemosphere 61, 1093 共2005兲. 23 J. Stocker, D. Balluch, M. Gsell, H. Harms, J. Feliciano, S. Daunert, K. A. Malik, and J. R. Van der Meer, Environ. Sci. Technol. 37, 4743 共2003兲. 24 R. E. Stauffer, Environ. Sci. Technol. 14, 1475 共1980兲. 25 P. K. Dasgupta, H. L. Huang, G. F. Zhang, and G. P. Cobb, Talanta 58, 153 共2002兲. 26 V. Lenoble, V. Deluchat, B. Serpaud, and J. C. Bollinger, Talanta 61, 267 共2003兲. 27 R. K. Dhar, Y. Zheng, J. Rubenstone, and A. van Geen, Anal. Chim. Acta 526, 203 共2004兲. 28 M. Rahman, K. Fujinaga, Y. Seike, and M. Okumura, Anal. Sci. 20, 165 共2004兲. 29 K. Shrivas and K. S. Patel, Anal. Lett. 37, 333 共2004兲. 30 K. Toda, T. Ohba, M. Takaki, S. Karthikeyan, S. Hirata, and P. K. Dasgupta, Anal. Chem. 77, 4765 共2005兲. 31 S. Tsang, F. Phu, M. M. Baum, and G. A. Poskrebyshev, Talanta 71, 1560 共2007兲. 32 J. Murphy and J. P. Riley, Anal. Chim. Acta 27, 31 共1962兲. 33 D. L. Johnson and M. E. Q. Pilson, Anal. Chim. Acta 58, 289 共1972兲. 34 R. A. Barco, D. G. Patil, W. H. Xu, L. Ke, C. S. Khachikian, G. Hanrahan, T. M. Salmassi, and K. L. Foster, Talanta 69, 1292 共2006兲. 35 G. Hanrahan, M. Gledhill, P. J. Fletcher, and P. J. Worsfold, Anal. Chim. Acta 440, 55 共2001兲. 16