REVIEW OF SCIENTIFIC INSTRUMENTS 81, 085106 共2010兲
Design of microcontroller based system for automation of streak camera M. J. Joshi,a兲 J. Upadhyay, P. P. Deshpande, M. L. Sharma, and C. P. Navathe Laser Electronics Support Division, RRCAT, Indore 452013, India
共Received 24 March 2010; accepted 17 June 2010; published online 16 August 2010兲 A microcontroller based system has been developed for automation of the S-20 optical streak camera, which is used as a diagnostic tool to measure ultrafast light phenomenon. An 8 bit MCS family microcontroller is employed to generate all control signals for the streak camera. All biasing voltages required for various electrodes of the tubes are generated using dc-to-dc converters. A high voltage ramp signal is generated through a step generator unit followed by an integrator circuit and is applied to the camera’s deflecting plates. The slope of the ramp can be changed by varying values of the capacitor and inductor. A programmable digital delay generator has been developed for synchronization of ramp signal with the optical signal. An independent hardwired interlock circuit has been developed for machine safety. A LABVIEW based graphical user interface has been developed which enables the user to program the settings of the camera and capture the image. The image is displayed with intensity profiles along horizontal and vertical axes. The streak camera was calibrated using nanosecond and femtosecond lasers. © 2010 American Institute of Physics. 关doi:10.1063/1.3462984兴
I. INTRODUCTION
II. DESIGN CONSIDERATIONS
A streak camera is an important instrument for studying subnanosecond events in a single-shot mode.1,2 A typical camera setup includes input slit, streak tube, biasing and control electronics, and a charge-coupled device 共CCD兲 camera and frame grabber. Incoming light passes through a slit and produces an image on the photocathode, thereby producing electrons via the photoelectric effect. The electrons are accelerated and passed through two deflection plates on which a ramp voltage is applied, which causes them to sweep across a phosphor screen at the end of the tube, forming a streak image. A CCD camera is used along with a frame grabber card to capture the streak pattern, and thus the temporal profile of the light pulse. By using a microcontroller to control various electronic systems in a typical streak camera, it is possible to get several advantages. First of all, the streak camera parameters are made programmable and controlled by software. This can be useful for total automation of a typical experiment. Second, the camera can be placed in an inaccessible place and controlled remotely. Next, the software can be designed to provide various safety checks, which can protect the camera against human errors. Finally, by proper calibration of time axis, the image displayed can be corrected for nonlinearity in the ramp. For getting all these benefits, it is necessary to design the electronic circuits in the streak camera which can be controlled by a microcontroller. In this paper, we are reporting design and development of various controls developed for the microcontroller controlled S-20 streak camera, carried out in Laser Electronics Support Division, Raja Ramanna Centre for Advanced Technology, Indore, India. a兲
Author to whom correspondence should be addressed. Electronic mail:
[email protected].
0034-6748/2010/81共8兲/085106/8/$30.00
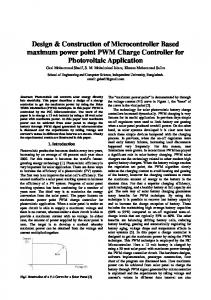
The streak camera assembly developed in our laboratory has three main components: streak tube followed by demagnifier tube and image intensifier tube. In addition to this, it has an input optics assembly to focus the slit image on to the photocathode and an output optics assembly for focusing output image on the readout system, i.e., CCD camera in this case. The block diagram of streak camera and associated components is shown in Fig. 1. It has an S-20 optical streak tube 共40 mm兲 procured from General Physics Institute, Moscow, Russia. The spectral response for S-20 photocathode is 350– 850 nm. The focusing mechanism is electrostatic focusing 共type PV001兲. The deflection plate is a pair of parallel plates having 75 ⍀ line impedance and 2.1 GHz plate bandwidth with capacitance of 6 pF. The focusing electrode of the streak tube is cylindrical in shape to focus the photoelectrons generated by the photocathode by applying a potential of ⫺11 kV. The streak tube is followed by a demagnifier tube 共40:25兲 for reducing the size from 40 to 25 mm and an image intensifier tube 共25 mm兲 which are also procured from GPI, Moscow, Russia. The image on the phosphor screen of the image intensifier tube is interfaced to a personal computer through a CCD camera and frame grabber card. The control electronics of streak camera involves four main subsystems, viz., 共1兲 high voltage bias to streak tube, demagnifier tube, and image intensifier tube, 共2兲 high voltage linear ramp generation with variable slopes for deflection plates and numerical analysis to get linear ramp voltage, 共3兲 generation of synchronized trigger signals for the ramp
81, 085106-1
© 2010 American Institute of Physics
085106-2
Joshi et al.
Rev. Sci. Instrum. 81, 085106 共2010兲
FIG. 1. Streak tube assembly along with its biasing.
and gating of microchannel plate 共MCP兲 with respect to optical input, and 共4兲 a hardwired safety circuit for monitoring various operations. For proper operation of the camera, a voltage gradient has to be maintained across the streak tube assembly 共from streak tube to MCP兲. Next, it is required to generate appropriate voltages for MCP for gain adjustment, supply voltage for high voltage ramp generator, and bias voltage for deflecting plates 共for shifting the starting point of the streak signal兲. Synchronized application of high voltage ramp signal to the deflecting plates is required for generating streak signal. The slope of this ramp signal decides the resolution of the streak camera. All these circuits are described in subsequent paragraphs.
III. ELECTRONIC CIRCUIT FOR BIASING OF TUBES
Biasing of the streak tube assembly is implemented using a dc-dc converter 共EMCO make 4150N, Sutter Creek, CA兲 with a 15 kV output, as shown in Fig. 1. This dc-dc converter requires a dc control input 共0–5V dc兲 to vary the dc output and optoisolated transistor-transistor logic 共TTL兲 control input to switch on the high voltage dc output. The microcontroller provides this TTL signal to control the 15 kV power supply. A high voltage resistor divider network is then used to provide a biasing voltage of ⫺13.5 kV to the input side 共photocathode of streak tube兲 and +3.5 kV to the phosphor screen just before the CCD camera. The demagnifier tube is provided with a biasing voltage of ⫺12.5 kV, whereas the photocathode of the image intensifier tube is provided with a biasing voltage of ⫺3.5 kV. The high voltages for the MCP, beam bias, and streak tube voltage are monitored periodically by the microconverter. In case of any discrepancy between the set voltage and the actual voltage, the microconverter aborts the current
operation and alerts the user. An isolation amplifier ISO122 is used for interfacing these high voltage signals with the microcontroller. IV. RAMP GENERATOR UNIT FOR DEFLECTING PLATES
A high voltage ramp signal of ⫾500 V is generated by a step generator unit followed by an integrator unit, which is composed of a resistor 共R兲, an inductor 共L兲, and a capacitor 共C兲.3 A programmable power supply is used to bias the ramp generator. It is turned on through a relay under the control of the microcontroller 共Fig. 2兲. The ramp output is taken across the capacitor. The variable inductor is designed using a solenoid stationary coil with a movable ferrite core, which is controlled using a stepper motor. Similarly, the capacitor is parallel plate type and its value is changed by rotating one plate by another stepper motor 共Fig. 3兲. The slope of the ramp can be changed by varying the values of inductor and capacitor. The microcontroller4 has two digital to analog converters 共DAC兲 which are used in conjunction with current drivers and dc-dc converters for controlling gain of MCP and bias voltage of the deflecting plates. Stepper motors used for varying the capacitor and inductor are driven with a driver integrated circuit 共TMC246兲, which has a serial interface. The motors are coupled to the shaft of the rotary capacitor and to the ferrite rod of the inductor. The logic sequence to be applied to the phases of the motor for moving them is generated by the microcontroller. The ramp voltage applied to the deflecting plate of the streak camera should be linear in order to get correct streak image. Since the deflecting plate pair has 75 ⍀ line impedance, the ramp voltages are applied to the deflecting plates via 75 ⍀ coaxial cable. This in turn minimizes the problem of signal reflection in the ramp voltage. Since the avalanche transistors stack is used to generate step voltage which is not linear but exponential in nature, it is therefore essential to determine the linear part of the gen-
085106-3
Joshi et al.
Rev. Sci. Instrum. 81, 085106 共2010兲
FIG. 2. Biasing of MCP and ramp generator.
erated step voltage which can be applied to the deflecting plates. This is done by overpulsing, i.e., generating a ramp voltage of higher amplitude 共⬃2000 V兲 and then selecting the most linear part out of it by applying suitable dc offset 共known as beam biasing兲. The procedure for selecting the most linear part is explained in Sec. V. V. NUMERICAL ANALYSIS OF RLC NETWORK
Numerical analysis of this circuit was carried out in order to determine the extent of the linear part in the ramp voltage generated for the different values of damping factors. In each value of damping factor, the extent of the linear part in the ramp, the amplitude of the overshoot, and the delay in switching was determined. The equation of the ramp voltage depends on the values of R, L, and C. It can be shown that there are four distinct possibilities depending on the value of damping constant 关k = 共R / 2兲共冑C / L兲兴, given as underdamped 共k ⬍ 1兲, critically damped 共k = 1兲, overdamped 共k ⬎ 1兲, and exponential 共k Ⰷ 1兲.5 Although the equations corresponding to these cases have been used extensively for the analysis of the resonant circuits, there is no study of the linear part in the initial ramp of such curves reported in the literature. It is also to be noted that it is very difficult to provide any analytical solution for predicting linear parts in these curves. This is because of the complex nature of the terms in
all equations, which do not provide any clue to their behavior in this form or even when they are expanded using Taylor series. Therefore, it is necessary to analyze them numerically to find out which portion of the curve provides best linearity. However, this procedure has to be performed manually, since this involves fitting of a linear segment over the given curve through various points on the curve, such that the difference between the two is minimized over a maximum possible span. Table I shows the summary of the performance of the RLC circuit with respect to k. All time durations are normalized with T = 2共LC兲0.5 and voltages are normalized with supply voltage V. It was observed that the optimum value of the damping factor is 0.6, since this value provides a linear portion of 68% of switching voltage and an overshoot of less than 10%. The same was verified using a practical circuit. Based on this analysis, the value of R, L, and C for the integrator unit has been chosen so that the damping constant k remains at the optimum value around 0.6. Figure 4 shows the linear portion marked by horizontal and vertical lines for k = 0.6. This also shows various important parameters for determining the delay, duration of the linear region, voltage span, and overshoot of the ramp pulse. The table shows the values under ideal conditions. It is possible, in principle, to design a practical circuit using the
FIG. 3. Ramp generator along with delay generator.
085106-4
Rev. Sci. Instrum. 81, 085106 共2010兲
Joshi et al.
TABLE I. Summary of performance of RLC circuit with respect to k. All time durations are normalized with T = 2共LC兲0.5 and voltages are normalized with supply voltage V. K
Delay 共td / T兲
Duration 共tW / T兲
Span 共VS / V兲
Ramp slope 共VS / V兲 / 共tW / T兲
Overshoot 共VT / V兲
0.20 0.40 0.60 0.80 1.00 1.50 2.00 3.00 4.00
0.14 0.10 0.07 0.07 0.07 0.03 0.01 0.00 0.00
0.18 0.22 0.24 0.23 0.20 0.25 0.30 0.38 0.44
0.81 0.77 0.68 0.56 0.43 0.36 0.34 0.31 0.28
4.50 3.50 2.84 2.43 2.17 1.44 1.14 0.81 0.64
0.53 0.25 0.09 0.02 0.00 0.00 0.00 0.00 0.00
theoretical values. However, it is necessary to consider some additional factors in this design. This is because here, the step voltage is assumed to be ideal. In practice, the step voltage generated by any switching technique itself follows an exponential rise, since every switch has stray capacitance, inductance, and resistance, although these values are very small. Second, the circuit includes stray capacitance, as well as wiring inductance and resistance, which may result in the modulation of the ideal curve. So the response curve is modified as per actual components and layout, which can cause a reduction of the usable linear portion. Also, there may be switching transients and other noise sources, which can override on the signal waveform. Finally, the switch also has an inherent delay because of which the initial part of the step can be longer than the ideal waveform. All these factors should be taken into consideration while designing practical circuits. For the developed streak camera, the values of R, L, and C in the integrator circuit are chosen accordingly. For example, considering the typical ramp speed of 20 ns for ⫾500 V 共i.e., T = 80 ns兲, C = 32 pF, L = 5 H, and R = 470 ⍀ have been used, which represent actual values considering all effects and provide effective k of 0.6.
FIG. 4. 共Color online兲 Diagram showing important parameters such as delay, span, and overshoot of the ramp pulse for k = 0.6.
VI. OPERATING MODES OF THE CAMERA
The streak camera can be operated in three modes, viz., static, gate, and dynamic. The static and gate mode are used for diagnostic purposes, while the streak signal is obtained in the dynamic mode. In static mode, the dc voltage is applied to all components including the MCP. The ramp signal is not applied to the deflecting plates. This mode is suitable for focusing. The gate mode is similar to the static mode, except for application of gate pulse to MCP. This mode is suitable for adjusting gain of MCP. In the dynamic mode of operation, the MCP is activated with a gated input just before start of the ramp signal to provide MCP gain for the incoming signal with improved signal to noise ratio. The application of the ramp signal to the deflecting plates and the arrival of the optical signal at the deflecting plates have to be perfectly synchronized in order to get streak images. The timing diagram for the various events in the streak camera is as depicted in Fig. 5. For the dynamic mode, two input trigger signals are used, designated as pretrigger and post-trigger. The pretrigger signal is used to generate the MCP trigger signal which activates the gate pulse circuit. The post-trigger signal has been derived from the optical event itself and the same is used to initiate the high voltage ramp pulse. The post-trigger signal, indicating the arrival of the event pulse, is delayed using a delay generator integrated circuit 共DS1023兲 共Fig. 3兲 in order to synchronize it with the actual arrival of the optical pulse. This delayed signal is used to trigger the ramp. The DS1023 can introduce a delay in the range of 0–255 ns under supervision of the microcontroller. It has a three wire serial interface for communication with the microcontroller. For changing the delay value, the microcontroller sends corresponding digital value serially using the clock and data lines. Due to the propagation delay involved in the actual generation of the ramp after application of trigger signal, the event pulse has been optically delayed before arriving at the front end of the streak camera. So a variable electrical delay ␦T of 0–255 ns 共based on DS1023兲 has been introduced between the post-trigger pulse and the trigger of the ramp generator in order to synchronize the optical event. The trigger pulse for the CCD camera is generated in synchronization with the MCP pulse for recording the event.
085106-5
Rev. Sci. Instrum. 81, 085106 共2010兲
Joshi et al.
It has on chip peripherals for serial communication, watchdog timer, 16 bit timers, and two external interrupt sources. The microcontroller generates a gate trigger for the MCP pulsar circuit, 5 s before the actual event. For this, the microcontroller starts a 16 bit timer to count predefined machine cycles on arrival of the pretrigger signal and generates the gate trigger on reaching the predefined count. The gate pulse width and delay between the pretrigger signal and gate pulse can be programmed by the user. The amplitude of the gate pulse, i.e., MCP gain generated by the pulser circuit can be varied by varying the input voltage of the dc-dc converter 共5VV2 of Pico Electronics, Pelham, NY兲 used for biasing the MCP pulser circuit. Thus, MCP pulse amplitude variation from 0 to 900 V and pulse duration variable from 100 s to 1 ms is obtained. VII. SAFETY FEATURES
FIG. 5. Timing diagram 共timing axis is not to the scale兲.
The CCD camera grabs the streak image using a frame grabber card 共National Instruments PCI-1411, Austin, TX兲 and displays it to the user. The block diagram of the control electronics is as shown in Fig. 6. A microconverter 共ADuC841 of Analog Devices, Norwood, MA兲 has been used for generating various control signals. This is an 8 bit microcontroller with single clock machine cycle, 8052 core, 64 K on chip flash program memory, and 4 K data memory. It has on chip 12 bit analog to digital converter with eight channels and 12 bit dual DAC.
FIG. 6. 共Color online兲 Block diagram of electronic control system for streak camera.
The streak camera is operated in three different modes and each mode has its own settings for voltage ranges for the MCP and beam bias. The ramp voltage is applied only in dynamic mode of operation. The soft limit implemented within the control software of the microcontroller ensures that correct voltages are applied to MCP and beam bias as per mode selected. Finally, the high voltages are applied to the various components of streak camera for only the preset time, after operation is initiated. In addition to the software based limits, a hard wired interlock circuit has been implemented to further enhance the safety of the streak camera. The interlock circuit has been designed to protect the streak camera from any undesirable voltages 共in terms of absolute value and duration兲 applied accidentally. This circuit ensures correct voltages are applied to the MCP, beam bias 共for deflecting plates兲, and ramp generator. It also ensures that in the dynamic mode, the pulse width of the MCP is never more than the preset value. The block diagram of this interlock circuit is shown in Fig. 7. To improve the reliability of the interlock circuit, it does not use any signal from the microcontroller as control signal or decision making signal. Since for different modes, we have different ranges for the individual voltages, the circuit samples the input voltages at different levels to distinguish the mode of operation 共static, gate, or dynamic兲. The output relays are energized only if the condition for at least one of the operating modes is satisfied. To protect the MCP in the dynamic and gate modes, the circuit limits the maximum pulse width of the trigger pulse for the MCP using monoshot.5 The monoshot is triggered by the MCP trigger and it generates a trigger pulse of fixed width. This is the maximum pulse width allowed for the MCP. This pulse, in conjunction with the original MCP trigger pulse, is used to generate the final trigger pulse of the MCP. In the static mode, an active high signal for the MCP is required, so the monoshot is bypassed. Three light emitting diodes of different colors are used for indicating the mode of operation to the user. The programmable high voltage dc-dc converter 共EMCO 4150N, Sutter Creek, CA兲 of ⫺15 kV output is set for its maximum rating and the high voltage divider network to bias
085106-6
Joshi et al.
Rev. Sci. Instrum. 81, 085106 共2010兲
FIG. 7. Interlock logic.
The characterization of the streak camera mainly involves measurement of its spatial resolution and temporal resolution.2,6–8 For determining the spatial resolution, the streak camera is focused finely with the minimum slit width. It has a mechanically variable slit with a variable opening from 0 to 2 mm with 50 m resolution. The static image at this moment on the phosphor screen will determine the spatial resolution of the streak camera. Figure 8 shows the static image of the slit with minimum detectable opening. The phosphor screen of 25 mm is corresponding to 650 pixels. The overall magnification is 1.315⫻. The minimum detectable slit width is ⬃6 pixels, which correspond to 175 m 共⬃230 m / 1.315兲. The streak speed calibration of the camera was carried out using laser oscillator. This unit is Nd-YLF laser with fundamental wavelength of 1.053 m, at 10 Hz rep rate with pulse duration ranging from 400 ps to 1.5 ns 共SL321 of Ekspla, Lithuania兲. The pulse energy is variable from 1 to 10 mJ. Since the S-20 photocathode 共300–800 nm兲 has peak response in the green region of the visible spectrum, this
output was converted in second harmonics by using KDP crystal. This in turn converts the fundamental wavelength of 1.053 m into 527 nm, which is well within the spectral range of S-20 streak camera. The calibration of the streak camera was performed by introducing an optical delay in the beam path by using two different lengths of fiber cables. The reference beam was positioned in the upper half of the input slit and the delayed beam was positioned in the lower half of the slit. Thus the two beams obtained were separated by a known delay determined by the difference in the length of the two fiber cables. This optical arrangement was done for calibrating all the speeds, viz., 700 ps, 8 ns, 12 ns, 20 ns, and 28 ns for 25 mm of phosphorous screen. For the two slowest speeds 共20 and 28 ns兲, a delay of 5.2 ns was generated by maintaining a fiber length difference of 1 m. For next two slower speeds 共8 and 12 ns兲, a delay of 2.6 ns was generated by maintaining a fiber length difference of 50 cm. For the fastest speed, the delay generated was 52 ps with a fiber length difference of 1 cm. The typical streak images for 700 ps and 8 ns are shown in Figs. 9 and 10. For determining the temporal resolution of the streak camera, a 10 TW, 50 fs Ti:sapphire laser system 共alpha-10/ U.S. of Thales Laser, France兲 was used. This laser system provides 50 fs duration laser pulses at 790 nm at 10 Hz
FIG. 8. 共Color online兲 Static image of minimum slit width which corresponds to 175 m.
FIG. 9. 共Color online兲 Streak image taken for 700 ps.
electrodes of streak tube, demagnifier tube, and the image intensifier tube is designed accordingly. This ensures safe biasing of all the tubes. VIII. CALIBRATION OF THE S-20 STREAK CAMERA
085106-7
Rev. Sci. Instrum. 81, 085106 共2010兲
Joshi et al.
It was found out experimentally that the temporal and special resolution of the streak camera was 4.5 ps and 175 m, respectively. IX. LINEARIZATION
FIG. 10. 共Color online兲 Streak image taken for 8 ns.
repetition rate. Figure 11 shows the streak image monitored for 50 fs laser pulse at the fastest speed setting and the corresponding intensity profile. The temporal resolution TR can be calculated as the quadratic sum of different components as follows: 共1兲
T2R = T2PHY + T2TECH + T2DFL , 2,8
where TPHY = physical time spread,
which is given by
TPHY = 2.34 ⫻ 10−06共冑⌬/E兲 = 1.47 ps. Here, ⌬ = FWHM 共full width half maximum兲 of energy spread of photoelectrons from S-20 photocathode is ⬃0.4 eV and E = electric field applied to the accelerating mesh= 1 kV/ mm. TTECH = technical time spread due to limited sweep speed and finite spatial resolution and is given by TTECH = ␦ / = 4.5 ps. Here, ␦ is the spatial resolution in dynamic mode which is 175 m in our case and is the fastest sweep speed which is 25 mm/650 ps in our case. TDFL = temporal broadening due to the deflection electric field on the photoelectron beam; this spread is typically 1 ps. Putting all the above values in Eq. 共1兲, we get temporal resolution TR of ⬃4.8 ps which matches well with the experimental result of 4.5 ps temporal resolution. The overall magnification of the streak camera unit was found to be 1.315⫻ 共2.2⫻ for the streak tube, 0.625⫻ for the demagnifier tube, and 1⫻ for the image intensifier tube兲.
FIG. 11. 共Color online兲 Streak image taken for speed of 700 ps and corresponding intensity profile of a 50 fs laser pulse.
For each speed, several shots were recorded for checking the linearity as well as repeatability of the unit. The shots were captured such that the entire phosphor screen was covered. It was observed that the linearity was changing from 2% to 5% from one end to another. A piecewise linearization technique was employed to remove this nonlinearity. The phosphor screen area was captured by the CCD camera in 650 pixels. To calibrate this image, it was divided into five parts. Shots in a particular part were grouped together and the average delay measured 共in pixels兲 was found out. These pixels represent the time corresponding to reference delay 共generated by fibers of different lengths兲. With this, the time represented by pixels in that area was calculated. Similarly, time represented by all parts was calculated. Thus for a given image, the total time represented by 650 pixels was calculated. The weight for each part in terms of pixels was then found out. The part image was resampled using quadratic interpolation technique and the complete image was recreated by joining the individual images. X. LABVIEW BASED GRAPHICAL USER INTERFACE
A LabVIEW 共Ref. 9兲 based graphical user interface 共GUI兲 has been developed for the streak camera. The GUI has three panels; image with line profile, original image, and calibrated image. The image with line profile panel allows the user to select an operating mode 共live or triggered兲. Since the same GUI can be used for three different streak cameras, the appropriate camera can be selected using the select camera button. On selection of a particular camera, the associated calibration parameters are automatically selected and are used for image processing. The user has to select appropriate streak camera operational settings/mode along with the camera. The same panel displays the acquired image along with the line profiles 共both horizontal and vertical兲 as per the cursor position. The horizontal axis is the time axis whereas the vertical axis represents the slit width. The line profile is updated every time the cursor is moved by the user. The panel has a start button, which when pressed by the user, the user settings are transferred to the microcontroller. The microcontroller generates necessary analog and digital signals as per the mode selected. For the dynamic and gate modes, the system waits for the trigger inputs whereas for the static mode, the image acquisition starts immediately. In the dynamic and gate modes, the image is acquired and displayed to the user on reception of the trigger signal. The actual image captured is shown separately in the third panel. The GUI also shows the original image and the calibrated image in separated panels. The calibrated image can be saved in the hard disk and reloaded at a later stage. The horizontal line profile has two cursors. The cursors can be moved along the line profile. The FWHM of the profile between the two
085106-8
Rev. Sci. Instrum. 81, 085106 共2010兲
Joshi et al.
ware also has different features such as FWHM measurement, x-y axis line profiles, image calibration with linearization technique, etc. The developed streak camera has been characterized using femtosecond laser system and the system provides the temporal and special resolution of 4.5 ps and 175 m, respectively. ACKNOWLEDGMENTS
FIG. 12. 共Color online兲 GUI for the streak camera.
The authors wish to acknowledge Dr. P. D. Gupta, Director, RRCAT, for his motivation and keen interest in this work. Thanks are also due to Dr. P. A. Naik for providing laser facility; Mr. A. S. Joshi, Mr. M. Raghu Ramaiah, Mr. R. K. Patidar, Mr. A. P. Kulkarni, Ms. Shashi Jain, Mr. Riaz Khan, Mr. R. A. Joshi, Mr. R. K. Bhat, and Mr. R. P. Kushwaha for providing required help for conducting the experiment; and Mr. S. R. Khade for his support in mechanical assembly of this system. 1
cursors is calculated automatically by pressing the FWHM button. The GUI of the LABVIEW based software is shown in Fig. 12. XI. CONCLUSION
A microcontroller based S-20 optical streak camera has been developed. The streak camera has a PC interface using a serial link 共RS232兲. LABVIEW based software has been developed to control different functions of the streak camera. These functions include operating mode selection 共static, dynamic or gate兲, wide range of ramp speeds 共by varying the motorized inductance and capacitance in a precalibrated mode兲, beam positioning, and variable MCP gain. The soft-
A. Maksimchuk, M. Kim, J. Workman, G. Korn, J. Squier, D. Du, D. Umstadter, G. Mourou, and M. Bouvier, Rev. Sci. Instrum. 67, 697 共1996兲. 2 R. A. Lerche, J. W. McDonald, R. L. Griffith, G. Vergel de Dios, D. S. Andrews, A. W. Huey, P. M. Bell, and O. L. Landen, Rev. Sci. Instrum. 75, 4042 共2004兲. 3 J. Upadhyay, M. J. Joshi, P. P. Deshpande, M. L. Sharma, and C. P. Navathe, Rev. Sci. Instrum. 79, 054701 共2008兲. 4 Microconverter, 12 bit ADCs and DACs with embedded 62 kB flash MCU 共Analog Devices Inc., 2002兲. 5 J. Millman and H. Taub, Pulse, Digital and Switching Waveforms 共McGraw-Hill, New York, 1991兲. 6 G. A. Naylor, K. Scheidt, J. Larsson, M. Wulff, and J. M. Filhol, Meas. Sci. Technol. 12, 1858 共2001兲. 7 R. J. Baker and B. P. Johnson, Meas. Sci. Technol. 5, 408 共1994兲. 8 K. Kinoshita, M. Ito, and Y. Suzuki, Rev. Sci. Instrum. 58, 932 共1987兲. 9 National Instruments, LABVIEW User Manual 共National Instruments, Austin, 2003兲.