Design, Use, and Performance of Statistical Control Charts for Clinical Process Improvement James C. Benneyan, Ph.D. * Northeastern University, Boston MA Last Revised: September 16, 2001
Abstract Background: The utility of statistical process control (SPC) methods has received growing interest in the healthcare community to help improve clinical and administrative processes. SPC charts are chronological graphs of process data that are used in many other industries to help understand, control, and improve processes and that, although based in statistical theory, are easy for practitioners to use and interpret. Objectives: The objective of this article is to provide an overview of SPC charts, the different types and uses of control charts, when to use each chart type, their statistical performance, and simple methods for determining appropriate sample sizes. The intended audience includes practitioners and healthcare researchers seeking either an introduction to these methods or further insight into their design and performance. Methods for dealing with rare events and low occurrence rates also are discussed. Methods: Recent empirical examples are used to illustrate appropriate applications of each chart type, sample size determination, and chart performance. Sensitivities are calculated and tabulated for a wide range of scenarios to aid practitioners in designing control charts with desired statistical properties. Conclusions: Control charts are valuable for analyzing and improving clinical process outcomes. Different types of charts should be used in different applications and sample size guidelines should be used to achieve the desired sensitivity and specificity. SPC is both a data analysis method and a process management philosophy, with important implications on the use of data for improvement rather than for blame, the frequency of data collection, and the type and format of data that should be collected. When dealing with low rates, it also can be advantageous to collect data on the number of cases or the amount of time between adverse events, rather than monthly rates.
Key Words: SPC, Control charts, Quality improvement, Adverse events, Patient safety. *
Please address correspondence to Professor James C. Benneyan, Ph.D., MIME Department, 334 Snell Engineering Center, Northeastern University, Boston MA 02115; tel: 617-373-2975; fax: 617-373-2921; e-mail:
[email protected].
Introduction This article provides an overview of statistical process control (SPC) charts, the different uses of these charts, the most common types of charts, when to use each type, and guidelines for determining an appropriate sample size. The intent is to provide an introduction to these methods and further insight into their design and performance beyond what exists in current literature. The utility of control charts to help improve clinical and administrative processes has received growing interest in the healthcare community. For example, see Splaine et al [1], Sellick [2], Plsek [3], Benneyan [4], Burnett and Chesher [5], and a comprehensive review in a recent series in Infection Control and Hospital Epidemiology [6, 7]. These methods are well-established in other industries and have a long history of use for measuring process performance and improving outcome quality. Important healthcare applications include their use to help reduce rates of adverse drug events, surgical site infections, patient falls, central line infections, surgical complications, and many of other types of iatrogenic injury and adverse events. The estimated total annual national costs in the U.S. of such process defects are staggering, including 770,000 to 2 million patient injuries, 8.7 million hospital days, 44,000 to 180,000 deaths, and $8.8 billion in healthcare costs [8-13]. Studies summarized in the recent National Academy of Sciences’ Institute of Medicine report, To Err is Human, also estimated that between 45,000 to 98,000 patients die each year in U.S. hospitals from medical errors, more than the annual number of deaths in the U.S. from traffic accidents, breast cancer, or AIDS [14]. It is not surprising that many accrediting and regulatory bodies therefore encourage hospitals and HMO s to apply continuous quality improvement methodologies to these process concerns, including the use of statistical methods such as SPC. For example, the Joint Commission on Accreditation of Healthcare Organizations recently stated their position on the use of SPC as follows [15]: An understanding of statistical quality control, including SPC, and variation is es sential for an effective assessment process... Statistical tools such as run charts, control charts, and histograms are especially helpful in comparing performance with historical patterns and assessing variation and stability. A recent paper by several authors from the U.S. Center for Disease Control [16] similarly stated that Many of the leading approaches to directing quality improvement in hospitals are based on the principles of W. E. Deming. These principles include use of statistical measures designed to determine whether improvement in quality has been achieved. These measures should include nosocomial infection rates. Many epidemiologists also have proposed monitoring infection and adverse event rates continuously over time in manners that are quite similar to SPC [17-20]. In conventional epidemiology, in fact, the identification of epidemic and endemic events are related in SPC termi-
Benneyan: Statistical Process Control Charts
page 1
nology to the detection of unnatural and natural variability, respectively. It also is interesting that as early as 1942, the late quality pioneer W. Edwards Deming advocated the application of SPC to disease surveillance and adverse healthcare events in the Journal of the American Statistical Association [21]. As evident in Splaine et al [1], SPC is as much a process management philosophy as it is a data analysis method, with several important implications discussed below. These include the use of data for learning and improvement (rather than for assigning blame), the frequency of data collection, the type of data and format in which they should be collected, and the actions taken based on the results. While details on the mathematics of control charts appear in many publications, these topics tend to receive less attention but are equally important to the successful use of SPC for process improvement.
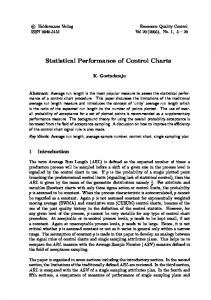
Quality Control Charts Overview and Interpretation Statistical process control charts are chronological graphs of process data that are used to help understand, control, and improve processes - such as infection control or adverse event processes - and that, although based in statistical theory, are easy for practitioners to use and interpret. While there are several different types of control charts, the general format and interpretation of the most common and simplest type, called a Shewhart control chart, are shown in Figure 1. Some statistic of interest, such as the number of cases of ventilatorassociated pneumonia per 100 device days, is plotted on the chart and interpreted on a monthly or weekly basis.
Low
probability
event
(Do not expect)
Upper Control Limit (UCL)
(Upper Warning Limit)
Natural Range of Variation (Expect)
Measurement of Interest
Centerline (CL)
(Lower Warning Limit)
Lower Control Limit (LCL)
ow
probability
event
Do not expect)
0
2
4
6
8
10
12
14
16
18
20
22
24
26
28
30
32
34
Sample Number
ime
Figure 1. General Format and Interpretation of a Statistical Control Chart
Benneyan: Statistical Process Control Charts
page 2
The three horizontal lines called the center line (CL), the upper control limit (UCL), and the lower control limit (LCL) define the central tendency and the range of natural variation of the plotted values, assuming that the long-term pneumonia rate, in the above example, does not change. The control limits are computed statistically based on probability distributions such as the Gaussian ("normal"), Poisson, or binomial distributions. As shown in Figure 2 for the bell-shaped normal distribution, values that fall outside the upper and lower three standard deviation control limits exceed the range within which almost all of the values (99.73% under the normal distribution) are expected to lie if the process remains unchanged and produces statistically consistent results.
0.9973 (very likely)
ean minus 3 standard deviations
Mean plus 3 standard deviations
.00135 unlikely)
.00135 (unlikely)
Mean
Clinical or Administrative Value of Interest
Figure 2. Relation of Control Limits to Underlying Probability Theory (Normal Distribution)
Interpretation of values in the tails or outside the control limits is similar to that of conventional hypothesis tests, namely that these values are statistically significant indications that the process is producing different results or is not producing outcomes from only one consistent and homogeneous process. Under the philosophy of quality improvement, the cause or causes of the process change or inconsistency should be identified and removed in order to achieve a single, stable, and predictable process (i.e., a "state of statistical control" in SPC language). While several different types of charts exist (see below), all are interpreted in essentially this same manner. In addition to values outside the control limits, there should be no evidence of non-random behavior between the limits, such as trends, cycles, and shifts above or beneath the center line. Various between-limit rules have been defined to aid in the objective interpretation of such data patterns, such as those summarized by Splaine et al [1] and Benneyan [4, 7]. Most of these supplementary rules are based on probability calculations of runs of consecutive values in various zones of the control chart, thereby improving sensitivity but reducing specificity (see below). See Duncan [22], Grant and Leavenworth [23], and Montgomery [24] for further information on the mathematical details of SPC. Note that control limits should not be confused with confidence interval limits, but rather are more analogous to prediction limits.
Benneyan: Statistical Process Control Charts
page 3
Uses of Control Charts It is important to emphasize that control charts have several important, somewhat sequential, roles in quality improvement work. These uses are discussed in greater detail elsewhere [7] and include (see Figure 3): 1. Understanding current and past process performance and its degree of consistency and predictability; 2. Establishing a "state of statistical control" by identifying and removing causes of unnatural (or "special cause") variation so as to achieve a consistent and predictable level of process quality over time; 3. Improving a process by identifying and removing causes of natural (or "common cause") variation and by testing whether interventions result in an improvement; and 4. Monitoring for process deterioration and "holding the gains" by identifying special causes of unnatural variation when they arise in the future.
Understand Past Performance •
•
Is process unstable or in statistical control? Begin trial control charting
Establish Consistent Process Iterative process using trial control charts • Bring process into statistical control Remove sources of unnatural variability until in-control • •
Improve Stable Process • • •
Remove sources of natural variability Position the average & reduce variability until acceptable Test and verify impact of interventions and improvements
Monitor Process for Instability Maintain a state of statistical control Hold the gains • Identify & remove special causes of unnatural variability • •
Figure 3. Different Uses of Control Charts Benneyan: Statistical Process Control Charts
page 4
Establishing a State of Statistical Control Note that while the latter two uses of control charts - testing and holding the gains - tend to be the most well-known in many popular quality improvement models, the first two activities are very important but unfortunately often overlooked or misunderstood. In many applications, considerable value exists in "merely" achieving a state of statistical control. As in other industries, many healthcare processes will not be stable and consistent when first examined and will require significant effort to bring them into a state of statistically consistent behavior (i.e., statistical control). This activity is referred to as "trial control charting" because of the focus on testing whether the process is consistent and on attempting to bring it into a state of operation such that it produces consistent and predictable results. This iterative process occurs over a period of time and consists of: •
constructing an initial trial control chart to test for statistical control,
•
searching for and removing assignable causes of unnatural variability,
•
removing all affected data and recalculating the center line and control limits from the remaining data (with the addition of new data if available or necessary),
•
searching a second time for causes of unnatural variability,
•
removing these data and reconstructing the control chart a second time as above, and
•
repeating this process as many times as is necessary until a state of statistical control is reached.
As an analogy, this iterative improvement process is akin to removing rocks above the surface of a pond (i.e., the upper limit), thereby lowering the water level only to identify a next layer of rocks now exposed above the surface, and repeating this process until a smooth consistent water horizon is achieved. Note that the trial control charting process typically is conducted retrospectively on historical data with new data added as they become available, in essence investigating if the process has been in statistical control in the past and up to the present time. In many cases, after causes of inconsistent variation are removed, the affected time periods of data can be determined and removed from the working data set that is used to compute and re-compute the control limits, so that it is not necessary to discard all historical data and collect an entire new data set. Practitioners sometimes are discouraged in this first phase of quality improvement by the amount of time and effort required in some cases to achieve a predictable process. It is important to emphasize, however, that this is a critical necessary first step and that only when a state of statistical control has been established can it be stated that a single process even exists. This is because without statistical control, there is no consistent process producing the outcomes; if there were, by definition the process would exhibit a state of statistical control. Until then statements about quality levels, projections of occurrence rates, and predictions about future outcomes all are invalid and misleading, despite any amount of wishful thinking to the contrary.
Benneyan: Statistical Process Control Charts
page 5
Monitoring and Improving Once a stable process exists (i.e., a state of statistical control has been established), the control chart is used to monitor the process for signals that a change has occurred ("special cause" of "unnatural" variability in SPC terminology) - points outside the control limits or violations of any of the within-limit rules. If these are changes for the worse, such as an increase in the ventilator-associated pneumonia rate, then an effort should be made to discover the causes so that they can be removed and prevented in the future. Causes of changes for the better also should be investigated and understood so that they can be implemented on a regular basis. While this monitoring activity tends to be the most familiar use associated with control charts, it also is the most passive use from a process improvement perspective as it is focused primarily on maintaining the status quo. It also is important to note that being in a state of statistical control must not necessarily imply that the process is performing at an acceptable level, or that the outcome rate is good, and that either an increase or decrease (i.e., an improvement) in the outcome rate represents an out-of-control process. Statistical control is defined as all data being produced by the same constant process and probability model, which may or may not have an acceptable mean or variance. For example, hypothetically it is possible to have a stable and consistent adverse drug event rate of 50% (1 of every 2 medications), although this obviously would be far from acceptable. The improvement focus at this stage now is on the difficult task of identifying changes to the existent (and consistent) process that will result in improvements. Changes to the existent standardized process will be necessary in order to improve outcomes. The role of control charts here is to help test and verify if these interventions actually result in the hypothesized benefits, as evidenced by statistical out-of-control signals of improvements.
Types of Control Charts The most familiar types of control charts, called Shewhart control charts, originally were developed by Shewhart in 1924, one for each of several types of data that are commonly encountered in practice. Each of these types of data can be described by a statistical distribution that is used to determine the expected value, theoretical standard deviation, and natural variation of the data (i.e., the center line and control limits). Examples of the most common types of data distributions - the normal, binomial, Poisson, and geometric - are shown in Figure 4. While many other types of data exist, these distributions will be familiar to many readers as very common and appropriate in many applications. One of the most common difficulties that practitioners have in using SPC is determining which type of control chart they should construct. As shown in Table 1, the chart type to use in any particular situation is based on identifying which type of data is most appropriate. For example, the three most common types of control charts should be used in the following situations:
Benneyan: Statistical Process Control Charts
page 6
•
Either an np or a p control chart should be used when analyzing discrete data that are distributed according to a binomial distribution;
•
Either a c or u control chart should be used when analyzing count data that are distributed according to a Poisson distribution;
•
Both an X-bar and an S chart should be used together for continuous data that are distributed according to a normal distribution. Figure 4a: Normal
Figure 4c: Poisson
Figure 4b: Binomial
Figure 4d: Geometric
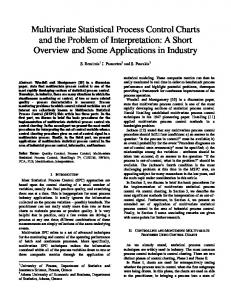
Figure 4. Four Common Types of Data Distributions Many standard statistical packages will construct these types of control charts, as well as plot histograms or provide mathematical "goodness-of-fit" tests to help verify the type of distribution that fits a particular data set. See Benneyan [4, 6] for further discussion on the distinctions between each type of data and examples of each type of control chart. Figure 5 illustrates Xbar and S charts for the mean and standard deviation, respectively, of the time from decision to the first incision for emergent Cesarean deliveries. Note that this process appears fairly consistent with the exception of the three weeks when either the Xbar or the S chart is out-of-control. The appropriate first action in this case therefore would be to investigate what occurred during these time periods to cause these statistically significant differences in outcomes. Both charts are necessary, only for normal data, because the estimation of the Xbar control limits assumes that the standard deviation is in statistical control and homogeneous and because either the mean or standard deviation can go out-of-control independently of the other. For example, Benneyan [6] describes an experience in which the Benneyan: Statistical Process Control Charts
page 7
Table 1. Common Types of Control Charts and Example Applications Type of Control Chart Xbar and S
Probability Distribution
Normal (Gaussian) Continuous measurements with "bell shape" Note: Xbar and R sometimes used as an alternative, although statistical properties are not as good. (’Individuals’ chart should be used only as a last resort for same reason.)
(Plot sample mean and standard deviation)
np
binomial
binomial
Poisson
(Plot sample rate)
u
(Plot count between events)
Total number of some event, where no exact upper bound, can be more than one event per patient or sampling unit Note: Assumes constant opportunity or sampling area in each time period
Poisson
(Plot sample rate adjusted per common base) g
Fraction of dichotomous cases generated by a process that result in a certain outcome Note: Sample size can change from sample to sample
(Plot sample fraction) c
Total number of dichotomous cases generated by a process that result in a certain outcome Note: Sample size assumed constant for each sample
(Plot sample total) p
When Appropriate to Use
geometric
Rate of some event, where no exact upper bound, can be more than one event per patient or sampling unit
Examples
Length of patient waits Procedure durations Timing of perioperative antibiotics Physiologic data Time from decision to first incision for emergent Cesarean deliveries Number of surgeries that develop a surgical site infection Number of patients who receive an antibiotic on time Number of patients readmitted Fraction of surgeries that develop a surgical site infection Fraction of patients who receive an antibiotic on time Fraction of patients readmitted Number of patient falls Number of central line infections Number of ventilator associated pneumonias Number of needle sticks
Average number of patient falls per 100 patient days Number of central line infections per 100 line-days
Note: Rate is adjusted to average per some common sampling denominator size
Number of ventilator associated pneumonias per 100 ventilator days
Number of cases or amount of time between occurrences.
Number of surgeries between infections
Note: Particularly useful for rare events or when rate is low (e.g., rate < .01)
Number patients between complications Number days between adverse drug events Number days between needle sticks
Benneyan: Statistical Process Control Charts
page 8
average timing of perioperative prophylaxis was equal to the target of 60 minutes prior to the 1st incision and appeared in statistical control, but the standard deviation was excessively large and not in-control. Out of control values on the Xbar or S chart indicate that the process mean or standard deviation is not in statistical control, respectively, somewhat analogous to T and F tests for statistically significant differences in means and variances. Average 55
Decision-to-Incision (Xbar Chart)
Time
50
45
40
35 1
2
3
4
5
6
7
8
9
10 11 12 13 14 15 16 17 18 19 20 21 22 23 24 25 26 27 28 29 30
Week Number
Standard
Deviations
of Decision-to-Incision (S Chart)
Time
10 9 8 7 6 5 4 3 2 1 0 1
2
3
4
5
6
7
8
9
n = sample of 10 charts per week
10 11 12 13 14 15 16 17 18 19 20 21 22 23 24 25 26 27
28 29 30
Week Number
Figure 5. Example of Xbar and S Control Chart for Emergent Cesarean Delivery Decision to Incision Delays By contrast, the p control chart in Figure 6 illustrates a surgical site infection rate that appears consistent and in-control but is higher than should be acceptable. Whereas this p chart is for the fraction of surgeries that develop infections, an np chart alternatively could be used for the total number of surgeries to develop infections. The appropriate action in this case would be to brainstorm and test process changes that might reduce the infection rate, using the control chart to verify whether improvement occurs. The u control chart in Figure 7, conversely, illustrates a ventilator-associated pneumonia rate that is both in-control and fairly decent. While improvement efforts should continue, this chart might be used primarily to detect increases and "hold the gains". Because the number of surgeries, device-days, and so
Benneyan: Statistical Process Control Charts
page 9
on typically is not constant in each sample, p and u charts tend to be used more often than np and c charts, respectively, with the differing sample sizes resulting in control limits that vary over time (as shown in Figures 6 and 7).
Fraction of Surgical Site Infections
.25
.20
.15
.10
.05
.00 2
4
6
8
10
12
14
16
18
20
22
24
26
28
30
32
Month
Figure 6. Example of p Control Chart of Surgical Site Infection Rate
Pneumonia Rate per 1000 Ventilator Days
4.0 3.5 3.0 2.5 2.0 1.5 1.0 0.5
Mar-00
Jan-00
Feb-00
Dec-99
Oct-99
Nov-99
Sep-99
Jul-99
Aug-99
Jun-99
Apr-99
May-99
Mar-99
Jan-99
Feb-99
Dec-98
Oct-98
Nov-98
Sep-98
Jul-98
Aug-98
Jun-98
Apr-98
May-98
Mar-98
Jan-98
Feb-98
0.0
Month
Figure 7. Example of u Control Chart for Ventilator Associated Pneumonia Rate Note that if the data do not exhibit the appropriate shape and distribution for one of the above control charts, then an alternative chart should be constructed [25, 26]. As a general rule of thumb, if a histogram does not exhibit a fairly symmetric bell-shape, such as those shown in Figures 4a through 4c, then none of the standard charts may be appropriate or sample sizes may be too small, and further advice should be sought. As one example, a fourth type of control chart called g and h charts should be used for count data with a geometric distribution, which can be useful when dealing with rare events (see below). Benneyan: Statistical Process Control Charts
page 10
Data and Statistical Issues Distinctions Between Traditional Measurement and SPC As the above examples illustrate, several important distinctions exist between traditional measurement practices for quality assurance and the role of measurement when using SPC for process improvement. Most importantly, data on almost all key indicators should be collected and evaluated much more frequently via control charts and closer to the continuous manner in which they actually are produced, rather than retrospectively in large aggregate quantities. For example, a typical current manner of reporting key performance data is to summarize several aggregate values annually, semiannually, or quarterly such as shown in Table 2. Table 2. Traditional Aggregate Data Format for Reporting and Quality Assurance Measure
1998
1999
2000
Cesarean Section Births
5.6 / 100
21 / 100
19 / 100
Average Maternity Length-of-Stay
66 hours
58 hours
61 hours
Needle Sticks
98
120
113
Surgical Nosocomial Infections
6.9 / 100 patients
3.4 / 100 patients
4 / 100 patients
Breast Wound Infections
12%
3%
6%
Adverse Drug Events
105
68
83
Methicillin-resistant Staphylococcus aureus (MRSA)
325 / 1677 (19%)
525 / 1629 (32%)
694 / 1735 (40%)
Ventilator-Associated Pneumonia
21.7 / 1000 ventilator days
14.3 / 1000 ventilator days
16.5 / 1000 ventilator days
CR BSI
1.7
1.4
3.1
ICU Lengths-of-Stay
4.9 days
5.3 days
5.1 days
Instead, process data now should be collected longitudinally in real-time and in much smaller samples in the format necessary for control charts shown in Figure 8. These samples are called "subgroups" in SPC terminology in order to distinguish them from the total sample of all data in all subgroups together. Note that this format and use of data for the purpose of process improvement is a fundamental change from the format used for the traditional purpose of internal or external reports and documentation. In many settings, the implication is that current data collection systems will need to be revised significantly in order to provide the necessary data in the necessary format. Subgroup size guidelines also differ from traditional sample (total) size calculation methods, as discussed below.
Benneyan: Statistical Process Control Charts
page 11
Time (Within Subgroups)
Time (Between Subgroups)
Subgroup Number
Individual Subgroup Observations 1
2
3
4 . . .
n
1
X 11
X 12
X 13
X14
...
X 1n
2
X 21
X 22
X 23
X 24
...
X 2n
3 . . .
X 31
X32
X 33
X 34
...
X 3n
k
X k1
X k2
X k3
Xk4
...
X kn
Subgroup Statistics
(eg, Counts, Proportions, Averages, St. Devs.)
Note: Samples are called subgroups in SPC terminology. This example contains k samples of data recorded over a significant period of time, with each sample containing n values taken over a shorter period of time. The rate or other statistic of interest is calculated for each small subgroup sample and plotted on a control chart in real time.
Figure 8. Longitudinal Data Collection Format for SPC and Process Improvement Also note that a minimum of at least 25 to 35 subgroups of data collected over time are necessary in order to conclude reliably that a process is in statistical control, a requirement that has radical implications on how data should be gathered and analyzed within many organizations and on the frequency of data collection. Using only aggregate quarterly data, for example, can take 6 to 9 years to verify a state of statistical control. Many current data systems therefore are woefully insufficient for the purpose of SPC and improvement, whereas plotting smaller amounts of data on control charts more frequently - weekly or even daily if at all possible - is a much better approach. In manufacturing and service applications, values are plotted hourly or at least daily so that the process can be monitored and controlled in real time.
Chart Calculations and Use of 3 Standard Deviation Limits The conventional formulae for all Shewhart control charts are based on the expected value (i.e., the theoretic mean) and the theoretic standard deviation (sigma) of the plotted data, which are computed differently for each type of data distribution. For example, the center line for np charts is set equal to the mean of the binomial distribution with the control limits equal to the center line plus and minus three binomial standard deviations. An alternative approach is to use probability-based control limits calculated so that the probability of falling between them is some desired value, typically somewhere in the vicinity of 99.73%. Note that in the case of normal data both these methods yield the same (good) specificity of 0.9973 for any single plotted value (i.e., the probability that any single in-control value correctly will be determined to be in-control) or equivalently a false alarm probability of 0.0027. There also are several more technical rationales for using 3-sigma limits. From a multiple comparison Bonferroni-type perspective if a 3-sigma trial Xbar control chart contains 25 Benneyan: Statistical Process Control Charts
page 12
samples of historical data from an in-control process, then the overall probability of at least one false alarm is α = 1 - (0.9973)25 ≈ 0.0654. That is, the specificity of the overall chart is 1 - α = 0.9346 (implying, if anything, that perhaps something greater than 3-sigma limits might be used). Additionally, a mathematical technique developed to determine the optimal control limits typically yields results between 2.5 and 3.5 sigma from the CL across a wide range of applications and costs in many industries, lending the convention of 3 standard deviations further justification [7, 24, 27-30]. Further research is needed to determine the extent to which these conclusions extend broadly to healthcare applications. In other applications, it periodically is suggested that other limits should be used in order to obtain a different tradeoff between sensitivity and specificity. In many industries, therefore, an additional pair of lines called warning limits sometimes are plotted at two standard deviations above and below the center line in order to provide earlier but less definite warnings of possible problems (i.e., greater sensitivity but lower specificity). A typical response to values falling between the warning and control limits is to start investigating and searching for assignable causes on a smaller scale and with less urgency than if the control limits had been exceeded. See Benneyan [7] for further discussion of these topics.
Subgroup Size Selection and Chart Performance Like almost any other statistical method, subgroup sizes and sensitivity for control charts are intrinsically related to one another, with larger subgroup samples producing greater power to detect process changes - but at the expense of greater sampling cost or of less frequent subgroups. Several guidelines therefore exist to help select an appropriate minimum subgroup size that will produce decent statistical properties, a reasonably symmetric sampling distribution, a non-zero LCL, and good sensitivity to detect rate changes or other process shifts. p and np Charts For np and p charts, the two most common rules-of-thumb are that the minimum subgroup size, n, should be large enough so that (rule 1) both np ≥ 5
and
n(1-p) ≥ 5
are satisfied or equivalently 5 5 5 n ≥ max , = min( p,1 − p) 1 − p p
or that (rule 2) both n≥
ln(.05) ln(.05) and n ≥ ln(1 − p) ln( p)
or equivalently n ≥
Benneyan: Statistical Process Control Charts
ln(.05) , ln[ max( p,1 − p)] page 13
where p is the expected proportion of cases resulting in the medication error, surgical site infection, or other adverse event being studied. The first rule ensures a reasonably symmetric bell-shaped distribution with statistical properties and run rules performance similar to those for a normal distribution. The second rule similarly avoids significant skewness and poor statistical properties by ensuring the control chart will not have a large number (no more than 5% on average) of plotted points clustered at zero or the upper possible bound (1 and n for p and np charts, respectively). Sometimes if data are scarce the first rule is relaxed to np ≥ 3 and n(1-p) ≥ 3 and the second to n ≥ ln(.25)/ln(1-p) and n ≥ ln(.25)/lp(p), although these usually are the lowest that one should consider. As an illustration, for the surgical site infection rate in Figure 6 of 0.09 (9 out of every 100), the minimum subgroup size n using the first rule should be between n≥
5 3 = 55.6 and = 33.3, 0.09 0.09
n≥
ln(.05) −2.996 = 31.8. = ln(1 − .09) −.0943
or using the second rule
u and c Charts Similarly, for c and u control charts the two corresponding rules-of-thumb are that the minimum subgroup size, n, should be between nλ ≥ 5 and nλ ≥ 3, or that n≥
− ln(.05) , λ
where λ is the average number of occurrences per some common unit of calculation (such as the ventilator associated pneumonia rate per 100 device days or the needle stick rate per 100 patient days). To illustrate, for the catheter-associated infection rate in Figure 7 of 1.25 per every 100 catheter days, the minimum subgroup size using the first rule should be between n≥
5 = 4.00 x 100 days = 400 catheter days 1.25 / 100 days
n≥
3 = 2.40 x 100 days = 240 catheter days, 1.25 / 100 days
and
or using the second rule n≥
− ln(.05) 2.996 = 2.40 x 100 days = 240 catheter days. = 1.25 / 100 days 1.25 / 100 days
Benneyan: Statistical Process Control Charts
page 14
Non-Zero LCL Note that for p, np, c, and u charts, if the lower control limit is equal to zero then, unless supplementary rules are used (see below), detecting or verifying improvements in the form of rate decreases will not be possible. In order for the LCL to be greater than zero, subgroup sizes 80% to 200% larger than result from the above formulae often are required. The minimum subgroup size, n, now must be large enough (rule 3) so that for p and np charts n>
k 2 (1 − p) p
and for u and c charts n>
k2 , λ
where k is the number of standard deviations used in the control limits (typically 3). Additionally, if the occurrence rate p ≥ 0.5 then in order for the upper control limit of p and np charts to be able to detect rate increases n>
k2 p 1− p
so that the UCL will be less than the upper possible bound of 1 and n, respectively. In the above two examples, the minimum subgroup size for LCL > 0 (using k = 3) becomes n >
32 (1 − .09) = 91.0 .09
= 92 for the surgical site infection p control chart and n >
32 = 720 1.25 / 100 days
= 721 for the ventilator-associated pneumonia u control chart. Table 3 summarizes the minimum recommended subgroup sizes for p, np, c, and u charts using these rules for a range of rates. Note that smaller values of the occurrence rates p or λ (i.e., higher quality processes) result in larger required minimum subgroup sizes, presenting the ironic dilemma that better processes require more data to control them. Performance of these charts to detect rate decreases using smaller subgroup sizes and supplementary rules is discussed below.
Benneyan: Statistical Process Control Charts
page 15
Table 3. Recommended Minimum Subgroup Sizes np or p
control chart
Rule 1
Rule 2
0.0025
2001
1197
0.0050
1001
0.0075
667
0.0100
500
0.025
1
c or u
Subgroup Size1
Defect rate (p )
control chart
Xbar
Subgroup Size2
control chart 3
Rule 3
Rate per unit ( λ )
Rule 1
Rule 2
Rule 3
Shift size ( δ sigma)
3592
0.025
200
120
361
0.1
598
1792
0.050
100
60
181
0.2
398
1192
0.075
67
40
121
0.3
299
892
0.100
50
30
91
0.4
85
57
34
200
119
352
0.25
20
12
37
0.5
55
36
22
0.050
100
59
172
0.50
10
6
19
0.6
38
25
16
0.075
67
39
112
0.75
7
4
13
0.7
28
19
12
0.100
50
29
82
1.00
5
3
10
0.8
22
15
9
0.125
40
23
64
1.25
4
3
8
0.9
17
12
7
0.150
34
19
52
1.50
4
2
7
1.0
14
9
6
0.175
29
16
43
1.75
3
2
6
1.1
12
8
5
0.200
25
14
37
2.00
3
2
5
1.2
10
7
4
0.225
23
12
32
2.25
3
2
5
1.3
8
6
4
0.250
20
11
28
2.50
2
2
4
1.4
7
5
3
0.275
19
10
24
2.75
2
2
4
1.5
7
4
3
0.300
17
9
22
3.00
2
1
4
1.6
6
4
3
0.325
16
8
19
3.25
2
1
3
1.7
5
4
2
0.350
15
7
17
3.50
2
1
3
1.8
5
3
2
0.375
14
7
16
3.75
2
1
3
1.9
4
3
2
0.400
13
6
14
4.00
2
1
3
2.0
4
3
2
0.425
12
6
13
4.25
2
1
3
2.1
4
3
2
0.450
12
6
12
4.50
2
1
3
2.2
3
2
2
0.475
11
5
10
4.75
2
1
2
2.3
3
2
2
0.500
10
5
10
5.00
1
1
2
2.4
3
2
1
np and p chart rules: Rule 1: n ≥ 5/min( p , ( 1 -p )) Rule 2: n ≥ ln(.05)/ln(max( p , ( 1 -p ))) 2 Rule 3: n > k * m a x ( ( 1 - p ) / p , p / ( 1 - p ))
2
3
c and u chart rules: Rule 1: n ≥ 5/λ
Subgroup size r
= .75
1351
r
= .5
r
= .25
900
541
338
225
136
151
100
61
Xbar chart rule: 2 n ≥(( k -Z r ) / δ )
Rule 2: n ≥ -ln(.05)/ λ 2 Rule 3: n > k / λ
k = standard deviation multiple, p = binomial rate, λ = Poisson rate, δ = mean shift size to detect, Z
r
= standard normal value with upper tail probability
Xbar Charts The specificity of Xbar charts with any subgroup size always will be 0.9973 (using k = 3) if the data are normally distributed. In many healthcare applications, however, continuous data such as times or delays can be naturally skewed, although subgroups of size n ≥ 10 usually will produce near exact normality due to the central limit theorem. The impact on chart performance if subgroup averages are plotted therefore is minimal [31], especially as n increases, another strength of Xbar charts. Logarithmic, square root, and other transformations also are possible, although seeking the best empirical transformation for out-of-control data can be misleading. An appropriate subgroup size for Xbar charts also can be determined by selecting a desired probability, r, that the next subgroup average will fall outside the control limits if the process mean shifts by a certain amount, δ, which yields the bound n ≥
k − zr , δ 2
where zr is the standardized normal coordinate corresponding to an upper tail probability of r and δ is the number of standard deviations equivalent to the magnitude of the shift in either Benneyan: Statistical Process Control Charts
page 16
direction that we want to detect. To illustrate, for the decision-to-incision Cesarean data in Figure 5 with a mean and standard deviation of 46 and 5 minutes, respectively, in order to detect a shift with 0.5 probability (r = 0.5, z0.5 = 0) from the mean of 46 minutes to 49 minutes (δ = (49-46)/5 = 0.6 standard deviations), the subgroup size must be 3 − 0 n ≥ = 25 . 0.6 2
To detect the same shift with 0.25 probability (z0.25 = .6745), the subgroup size must be 3 − .6745 n ≥ = 15.02 2
0.6
= 16. Table 3 summarizes the subgroup sizes necessary for various degrees of mean shifts in order to achieve single-point detection probabilities of .25, .5, and .75. These probabilities equate to averages of 1/.25 = 4, 1/.5 = 2, and 1/.75 = 2 subgroups plotted from the time the process changes until a value exceeds the control limits, any of which typically are considered to be good chart performance.
Chart Sensitivity The sensitivity of an Xbar chart with a subgroup size of n to detect other magnitudes of shifts in the process mean can be calculated using the following formula
(
) (
)
1 − Φ k − δ n + Φ −k − δ n ,
where k and δ are defined as previously and Φ(z) is the standard normal cumulative probability evaluated at z, P(Z