Hindawi Publishing Corporation Journal of Applied Mathematics Volume 2013, Article ID 745153, 6 pages http://dx.doi.org/10.1155/2013/745153
Research Article Fuzzy Approach to Statistical Control Charts Shahryar Sorooshian Faculty of Technology, University Malaysia Pahang, Gambang Kuantan, 26300 Pahang, Malaysia Correspondence should be addressed to Shahryar Sorooshian;
[email protected] Received 4 February 2013; Accepted 22 August 2013 Academic Editor: Hadi Nasseri Copyright © 2013 Shahryar Sorooshian. This is an open access article distributed under the Creative Commons Attribution License, which permits unrestricted use, distribution, and reproduction in any medium, provided the original work is properly cited. After investigating the advantages and disadvantages of current methods of statistical process control, it becomes important to overcome the disadvantages and then use the advantages to improve a method for monitoring a process with categorical observations. An approach which considers uncertainty and vagueness is tried for this study; and for this purpose, fuzzy set theory is inevitable to use. So, a new approach based on fuzzy set theory is introduced in this research for monitoring attribute quality characteristics. This approach is then compared with the current related approach to see the difference in performance.
1. Introduction
(ii) Attribute control charts need less cost and time for inspection than variable control charts.
With regard to the continuous improvement in the products and service quality as a main factor for customer satisfaction, improving the tools of monitoring the quality characteristics has become inevitable. Statistical process control (SPC) is a well-known methodology for improving the quality. SPC is a powerful collection of problem-solving tools beneficial in achieving process stability and enhancing capability and quality through the reduction of variability [1]. Control chart is utilized as the most essential tool of SPC that is frequently employed to determine whether a process is in a state of statistical control. According to Montgomery [1], the control chart refers to a graphical display of a quality characteristic that has been measured or computed from a sample versus the sample number or time. Variable control charts are used to monitor continuous characteristics of the products, while attribute control charts are applied to monitor the quality characteristics, which are not possible to express in numerical scale. From the literature, first, it is concluded that there are some advantages and disadvantages for using attribute control charts like 𝑝 chart by comparing it to the variable control chart like 𝑋 − 𝑅. Some advantages of using attribute control charts are as follows.
However, the binary classification into conforming and nonconforming used in 𝑝 chart might not be appropriate in many situations where there might be a number of intermediate levels [2]. In this case, for measuring the quality-related characteristics, it is necessary to use several intermediate levels besides conforming and nonconforming. For example, the quality of the product can be classified by one of the following terms: perfect, good, median, poor, and fair, depending on deviation from specifications. Data obtained in this way are called categorical data. Some research has been done for monitoring processes with categorical observations, such as multinomial distribution based and grouped data approach which have several disadvantages as follows:
(i) Attribute control charts could monitor more than one quality characteristic simultaneously.
(i) cannot specify if the change in the quality is a result of quality improvement or not [3],
Disadvantages of attribute control charts are as follows. (i) Attribute control charts need larger sample size than variable control charts. (ii) Attribute information could not determine the reason of being out of control, so correction action is meaningful.
2
Journal of Applied Mathematics (ii) control limits do not depend on sample size [3], (iii) for the trinomial distribution, Cochran [4] rules require all expected frequencies to be at least five. So, a large sample size is required, but collecting such sample size is so hard in real applications, (iv) however, the majority of our information about the surrounding phenomena is fuzzy and we expressed them by means of linguistic variable. Furthermore, the quality level of each product is determined by the interaction between the linguistic and qualitative variables which are usually vague, and in each organization, operators and experts are the responders of determining the quality level and the estimation of the quality which they have done mentally in uncertain situations. So it is necessary to use an approach that is applicable and capable to register the linguistic variable and estimate them with appropriate approximation. In fact the main problem is vagueness that corresponds to the mental affect [5].
2. Statistical and Fuzzy Control Charts In general, statistical and fuzzy methodologies exist to deal with the categorical data. Early research on statistical methodologies goes back to Duncan [6] who introduced a chisquare control chart for monitoring a multinomial process with categorical data. Later, this type of control chart is discussed further by Marcucci [7] and Nelson [8]. Marcucci [7] introduced a statistical approach for the case, where the proportion of each category is not known before. In the case of fuzzy methodologies, several approaches are proposed. Bradshaw Jr. [9], for the first time, used fuzzy sets as a basic for explaining the measurement of conformity of each product unit with the specifications. Williams and Zigli [10] showed that quality assurance techniques, especially in service industries, are not without imprecision of human judgments. This imprecision and vagueness can be treated with the help of fuzzy set theory. Raz and Wang [2] and Wang and Raz [11] proposed a probabilistic approach and a membership approach. Kanagawa et al. [12] developed a new control chart for the monitoring of the mean and deviation of attribute variables. Franceschini and Romano [13] proposed an approach based on the use of linguistic quantifiers for constructing control charts. Probabilistic and membership approach are discussed by Laviolette et al. [14], Almond [15], and Kandel et al. [16] and reviewed by Woodall et al. [17] and Taleb and Limam [3]. G¨ulbay and Kahraman [18–20] proposed 𝛼-level fuzzy control chart for attributes in order to reflect the vagueness of data and tightness of inspection. Cheng [21] proposed an approach to deal with the expert’s subjective judgments based on the ranking scores assigned by the individual inspectors to the inspected items. Shu and Wu [22] used resolution identity to construct the control limits of fuzzy 𝑝 chart using fuzzy data. They also proposed a ranking method to determine the process condition in linguistic form such as rather in control or rather out of control. Pandurangan and Varadharajan [23] proposed a control chart for fuzzy multinomial processes with variable sample size.
In their approach, control limits for the fuzzy multinomial chart are obtained using multinomial distribution.
3. Highlights The principle of fuzzy approaches proposed by Raz and Wang [2] and other researchers in this field are like the generalized 𝑝-chart, and each product unit is categorized with a linguistic variable, whereas each product unit might belong to several linguistic variables simultaneously in a vague environment. This statement is declared by Wang and Raz [11] themselves as “in a term set consisting of 𝑡 linguistic values, each sample is completely specified by a 𝑡-dimensional vector with elements corresponding to the number of items in the sample describing each linguistic value. This vector is a random variable from a multinomial distribution.” Other researchers have also indicated that Raz and Wang do not use fuzzy logic correctly. This disadvantage is also declared by Kandel et al. [16], Dubois and Prade [24], and Laviolette et al. [14]. Unfortunately, all of the recent methods model their approach based on a multinomial distribution without considering the fact that maybe an item could belong to two or even more categories at the same time.
4. Materials and Methods In this research, for the first time, we try to use a fuzzy inference system to transfer the subjective rating of the quality of the products by the inspectors to a crisp number, so that we can use any variable control chart to monitor the quality of the process. Consider that the attribute characteristics of a specific product would be considered as a linguistic variable in the antecedent of an if-then rule which consists of two terms, good and fair. The quality of the product is considered as the linguistic variable in the consequent, which consists of two terms, conforming and nonconforming. Therefore, by considering the number of linguistic variables and their terms, it can be concluded that the fuzzy system used in this approach consists of two if-then rules as below. Rule 1. If the quality characteristic is “good” then the quality is “conform”. Rule 2. If the quality characteristic is “fair” then the quality is “nonconforming”. Detailed construction procedures appear in the future step by step, followed by an example. In the following, we provide a step by step description of the construction of the fuzzy inference system and monitor the process. Step 1 (fuzzify input). Before the rules can be evaluated, the inputs must be fuzzified according to each of the linguistic sets. So the second step is to take the inputs (scores), which are crisp integer numbers and determine the degree to which they belong to the appropriate fuzzy sets via membership functions: 𝛼𝑟 = 𝜇𝑖 (𝑥input ) ,
(1)
Journal of Applied Mathematics
3
Table 1: Estimated parameters of the “yellowness” and “blackness” membership function.
Coefficient value 𝑡-student value
Yellowness 𝛽0 −3.8672 6.01
Black 𝛽1 0.849 23.08
𝛽0 4.0568 6.81
Coefficient value 𝑡-student value
𝛽1 −0.716 25.82
Yellowness: 𝑅-adj = 96.8, 𝐹 = 219.73, 𝑎 = −𝛽1 = −0.849, 𝑐 = 𝛽0 /𝑎 = 4.556. Black: 𝑅-adj = 95.2, 𝐹 = 321.69, 𝑎 = −𝛽1 = 0.716, 𝑐 = 𝛽0 /𝑎 = 5.667.
where 𝑖 = “fair”, “good” and 𝑟 = 1, 2 (rules number), then 𝛼𝑟 which is a single truth value will be applied to the output function. Step 2 (apply implication method). A consequent is a fuzzy set represented by a membership function and is reshaped using a function associated with the antecedent (𝛼𝑟 ), 𝜇𝑟conseq (𝑢) = min {𝛼𝑟 , 𝜇𝑗 (𝑢)} .
Step 3 (aggregate all outputs). Since decisions are based on the testing of all rules in an FIS, the rules must be combined in some manner in order to make a decision. Aggregation is the process by which the fuzzy sets that represent the outputs of each rule are combined into a single fuzzy set, (3)
The input of the aggregation process is the list of truncated output functions returned by the implication process for each rule. The output of the aggregation process is one fuzzy set for each output variable. Step 4 (defuzzify). The input for the defuzzification process is a fuzzy set (the aggregate output fuzzy set), and the output is a single number. As much as fuzziness helps rule evaluation during the intermediate steps, the final desired output for each variable is generally a single number. However, the aggregate of a fuzzy set encompasses a range of output values and so must be defuzzified in order to resolve a single output variable from the set. There are different ways for defuzzifying, the most popular of which are the center of area (COA) and the mean of maxima (MOM). We use COA method which returns the center of area under the curve, 𝑈COA =
∫𝑢 𝑢 ⋅ 𝜇conseq (𝑢) ⋅ 𝑑𝑢 ∫𝑢 𝜇conseq (𝑢) ⋅ 𝑑𝑢
.
In this section, we employ monitoring color problem of boats as an example to illustrate our approach. A boat factory intends to monitor the color of its products as one of the important quality characteristics. The color should be black and does not have any yellowness. So, the rules are formed as below.
(2)
The input for the implication process is a single number given by the antecedent, and the output is a fuzzy set.
𝜇conseq (𝑢) = max𝑟 {𝜇𝑟conseq (𝑢)} .
5. Results and Discussion
(4)
Step 5 (monitoring). Finally, in the last step we can monitor the outputs of the fuzzy systems which are crisp continuous data representing the quality of the product unit with traditional control charts. A numerical example is used to evaluate the proposed approach. After the numerical example, a comparison study is performed based on average run length (ARL) to compare the performance of proposed approach with that of current related approaches.
Rule 1. If the color is black then the quality is conform. Rule 2. If the color is yellowness then the quality is nonconforming. After collecting 30 observations, “𝑎” and “𝑐” are estimated by using a regression model as illustrated in Table 1. Now, by taking a shift in 25 preliminary samples of 20 rated color of boats by inspectors, the parameters “𝑝” and “𝑞” are determined by using a simulation programming with the goal of minimizing the ARL1 as 0.1, 0.2. These values of “𝑝” and “𝑞” can be used in the future. Suppose the color of one boat is rated 8 by an inspector, so we can get the color as “black” with degree of 0.8416 and “yellowness” with degree of 0.2548. Accordingly, the consequences of the rules are conseq
(𝑢) = min {0.8416, 𝜇black (𝑢)} ,
conseq
(𝑢) = min {0.2548, 𝜇yellow (𝑢)} .
𝜇1 𝜇2
(5)
So conseq
𝜇conseq (𝑢) = max {𝜇1
conseq
(𝑢) , 𝜇2
(𝑢)} .
(6)
And at the end by using COA defuzzification method we have 𝑢COA = 0.761.
(7)
6. Evaluation Criteria To compare the performance of different proposed approaches for monitoring the categorical data, average run length (ARL) is suggested as an evaluation criteria. ARL is the average of the number of samples which should occurr before a sample shows the out-of-control condition. As Montgomery [1] declared, if the observations from the process are not autocorrelated, ARL could be calculated based on the following equation for every type of traditional control chart, ARL =
1 , 𝑝
(8)
4
Journal of Applied Mathematics
where 𝑝 is the probability of being out of control limits for each points. It should be noted that there are two different ARLs: in control and out of control. In control average run length is shown by ARL0 . It is the average of the number of samples which should occurr before a sample shows an out-of-control condition when the process is in fact in the state of in-control. For a traditional type control charts with 3 sigma control limits, the probability of type I error which is the probability of being out-of-control of a point when the process is in fact in the control is equal to 0.0027. So, the ARL when the process is in the control is ARL0 =
1 1 = ≅ 3701. 𝑝 0.0027
(9)
It means that, averagely, after each 370 points, a point shows an alarm of out-of-control when the process is in fact in the state of in control. An average run length when the process is out-of-control is shown by ARL1 . ARL1 is the average of the number of samples which take place until a point shows an out-ofcontrol condition when the process is in fact out-of-control. ARL1 could be calculated by the following equation: ARL1 =
1 , 1−𝛽
(10)
where 𝛽 is the probability of not detecting a shift with the first point after the occurrance of a shift in the process.
7. Comparison Study Here, by using simulation with MATLAB release R2009a, a comparison study was run to compare the performance of a proposed approach with the current related approach. Proposed approach, probabilistic approach proposed by Raz and Wang [2], generalized 𝑝 chart proposed by Marcucci [7], and 𝛼-cut approach proposed by G¨ulbay and Kahraman [20] are considered in the comparison study. As Raz and Wang [2] and Taleb and Limam [3] declared that the probabilistic approach has a better performance over the membership approach; however just the probabilistic approach is considered in this comparison study. Base variable in this comparison study consists of four linguistic terms: standard (S), second choice (SC), third choice (TC), and chipped (C). Each linguistic term has its own membership function as below: 0 { { 𝜇S (𝑥) = {−𝑥 + 1 { {0
𝑥≤0 0≤𝑥≤1 𝑥 ≥ 1,
0 { { { { { {4𝑥 𝜇SC (𝑥) = { 4 4 { { − 𝑥+ { { 3 { 3 {0
𝑥≤0
1 0≤𝑥≤ 4 1 ≤𝑥≤1 4 𝑥 ≥ 1,
0 𝑥≤0 { { { 1 { { 0≤𝑥≤ {2𝑥 2 𝜇TC (𝑥) = { 1 { {−2𝑥 + 2 ≤ 𝑥 ≤ 1 { { 2 { 𝑥 ≥ 1, {0 0 { { 𝜇C (𝑥) = {𝑥 { {0
𝑥≤0 0≤𝑥≤1 𝑥 ≥ 1. (11)
Raz and Wang [2] showed that there are not any theoretical advantages over the using of different transformation techniques, so in this study fuzzy mode is used as the transformation technique for probabilistic approach. Table 2 shows the representative values for different membership functions based on fuzzy mode and fuzzy median. It also shows the relationship between the score used for ranking the production items by the inspectors and the linguistic terms used to run other approaches. As mentioned before, for generating the data and running the simulation, MATLAB release R2009a has been used. For generating the data, first random data was generated based on beta distribution with parameters 𝛼 and 𝛽. Then generated data was multiplied by 10 and at last by using floor function, we could have discrete number from 0 to 10, 𝑓 (𝑥) =
1 𝑥𝛼−1 (1 − 𝑥)𝛽−1 ; 𝐵 (𝛼, 𝛽)
0 ≤ 𝑥 ≤ 1.
(12)
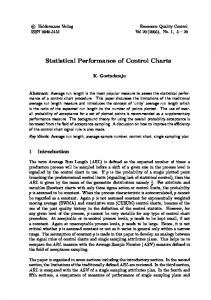
The final observations were used as the input of the fuzzy system. By using Table 1, the data for simulating the other approaches could be used. Here a beta distribution with parameter 𝛼 = 9 and 𝛽 = 2 was used. Figure 1 depicted this distribution. Tables 3, 4, 5, and 6 show the ARL1 which is obtained from a 10000 replication of generating data with sample size 5 when there is a shift equal to 0.5𝜎 to 2𝜎 in the process. Some results could be obtained from this comparison study as below: (i) proposed approach has a better performance in every cases, (ii) especially in small shifts and small sample size, the proposed approach could detect the abnormal condition faster than other approaches, (iii) comparing between generalized 𝑝 chart and probabilistic approach shows that in every case the generalized 𝑝 chart has a better performance, (iv) 𝛼-cut approach has the weakest performance among these methods.
8. Conclusion The first note in this approach is that variable quality characteristics are also better to consider as attribute and categorical quality characteristics. But, control charts for monitoring
Journal of Applied Mathematics
5 Table 2: Representative value for linguistic terms.
Score 1–4 5-6 7-8 9-10
Linguistic term S SC TC C
Fuzzy mode 0 0.25 0.5 1
Fuzzy median 0.293 0.387 0.5 1
Table 3: ARL1 for different approach when there is a shift equal to 0.5𝜎. Sample size 5 10 15 20 50
Proposed method 1.091 1.001 1.047 1.032 1.017
Probabilistic Wang 14.983 5.373 3.362 2.531 1.73
Generalized p Marcucci 27.911 21.276 6.573 5.217 1.525
𝛼-cut Gulbay 33.54 24.83 7.01 5.35 1.62
Table 4: ARL1 for different approach when there is a shift equal to 1𝜎. Sample size 5 10 15 20 50
Proposed method 1.0073 1.016 1.001 1.001 1
Probabilistic Wang 3.663 1.284 1.059 1.013 1
Generalized p Marcucci 3.721 1.391 1.102 1.032 1
𝛼-cut Gulbay 5.12 2.01 1.65 1.23 1.12
Table 5: ARL1 for different approach when there is a shift equal to 1.5𝜎. Sample size 5 10 15 20 50
Proposed method 1.0051 1.0032 1.0011 1 1
Probabilistic Wang 1.2172 1.0041 1.0026 1.0013 1.0007
Generalized p Marcucci 1.2262 1.0079 1.0038 1.0020 1.0011
𝛼-cut Gulbay 2.011 1.0821 1.0439 1.0091 1.0039
Table 6: ARL1 for different approach when there is a shift equal to 2𝜎. Sample size 5 10 15 20 50
Proposed method 1.0009 1.0008 1.0005 1 1
Probabilistic Wang 1.1181 1.0022 1.0015 1.0009 1.0001
4
3.5 3 2.5 2 1.5 1 0.5 0
0
0.1
0.2
0.3
0.4
0.5
0.6
0.7
0.8
0.9
1
Figure 1: A beta distribution with 𝛼 = 9 and 𝛽 = 2.
Generalized p Marcucci 1.1231 1.0038 1.0024 1.0011 1.0006
𝛼-cut Gulbay 1.981 1.0616 1.0291 1.0031 1.0021
attribute quality characteristics in comparison to variable control charts have some disadvantages in structure which should be solved first. The second note is for monitoring attribute quality characteristics; which because of mental inspection and human judgments, have some level of vagueness and uncertainty. This research proposed a new approach to quality control, a fuzzy approach for monitoring the process when vagueness and uncertainty arise. The case study and comparison study show the proposed approach has a better performance and could detect abnormal shifts in the process, especially in small shifts and small sample size, faster than current related approaches.
6
References [1] D. C. Montgomery, Introduction to Statistical Quality Control, John Wiley & Sons, New York, NY, USA, 6th edition, 2009. [2] T. Raz and J. H. Wang, “Probabilistic and membership approaches in the construction of control charts for linguistic data,” Production Planning and Control, vol. 1, no. 3, pp. 147–157, 1990. [3] H. Taleb and M. Limam, “On fuzzy and probabilistic control charts,” International Journal of Production Research, vol. 40, no. 12, pp. 2849–2863, 2002. [4] W. G. Cochran, “The chi square test of goodness of fit,” The Annals of Mathematical Statistics, pp. 315–345, 1952. [5] R. R. Yager and L. A. Zadeh, An Introduction to Fuzzy Logic Applications in Intelligent Systems, Kluwer Academic, 1992. [6] A. Duncan, “A chi-square chart for controlling a set of percentages,” Industrial Quality Control, vol. 7, pp. 11–15, 1950. [7] M. Marcucci, “Monitoring multinomial processes,” Journal of Quality Technology, vol. 17, no. 2, pp. 86–91, 1985. [8] L. S. Nelson, “A chi-square control chart for several proportions,” Journal of Quality Technology, vol. 19, no. 4, pp. 229–231, 1987. [9] C. W. Bradshaw Jr., “A fuzzy set theoretic interpretation of economic control limits,” European Journal of Operational Research, vol. 13, no. 4, pp. 403–408, 1983. [10] R. H. Williams and R. M. Zigli, “Ambiguity impedes quality in the service industries,” Quality Progress, vol. 20, no. 7, pp. 14–17, 1987. [11] J. H. Wang and T. Raz, “On the construction of control charts using linguistic variables,” The International Journal of Production Research, vol. 28, no. 3, pp. 477–487, 1990. [12] A. Kanagawa, F. Tamaki, and H. Ohta, “Control charts for process average and variability based on linguistic data,” The International Journal of Production Research, vol. 31, no. 4, pp. 913–922, 1993. [13] F. Franceschini and D. Romano, “Control chart for linguistic variables: a method based on the use of linguistic quantifiers,” The International Journal of Production Research, vol. 37, no. 16, pp. 3791–3801, 1999. [14] M. Laviolette, J. W. Seamanb, J. D. Barrettc, and W. H. Woodallc, “A probabilistic and statistical view of fuzzy methods,” Technometrics, vol. 37, no. 3, pp. 249–261, 1995. [15] R. G. Almond, “Discussion: fuzzy logic: better science? Or better engineering?” Technometrics, vol. 37, no. 3, pp. 267–270, 1995. [16] A. Kandel, A. Martins, and R. Pacheco, “Discussion: on the very real distinction between fuzzy and statistical methods,” Technometrics, vol. 37, no. 3, pp. 276–281, 1995. [17] W. Woodall, K. Tsui, and G. Tucker, “A review of statistical and fuzzy control charts based on categorical data,” Frontiers in Statistical Quality Control, vol. 5, pp. 83–89, 1997. [18] M. G¨ulbay, C. Kahraman, and D. Ruan, “𝛼-cut fuzzy control charts for linguistic data,” International Journal of Intelligent Systems, vol. 19, no. 12, pp. 1173–1195, 2004. [19] M. G¨ulbay and C. Kahraman, “Development of fuzzy process control charts and fuzzy unnatural pattern analyses,” Computational Statistics and Data Analysis, vol. 51, no. 1, pp. 434–451, 2006. [20] M. G¨ulbay and C. Kahraman, “An alternative approach to fuzzy control charts: direct fuzzy approach,” Information Sciences, vol. 177, no. 6, pp. 1463–1480, 2007.
Journal of Applied Mathematics [21] C.-B. Cheng, “Fuzzy process control: construction of control charts with fuzzy numbers,” Fuzzy Sets and Systems, vol. 154, no. 2, pp. 287–303, 2005. [22] M.-H. Shu and H.-C. Wu, “Monitoring imprecise fraction of nonconforming items using p control charts,” Journal of Applied Statistics, vol. 37, no. 8, pp. 1283–1297, 2010. [23] A. Pandurangan and R. Varadharajan, “Fuzzy multinomial control chart with variable sample size,” International Journal of Engineering Science, vol. 3, 2011. [24] D. Dubois and H. Prade, “Fuzzy sets—a convenient fiction for modeling vagueness and possibility,” IEEE Transactions on Fuzzy Systems, vol. 2, no. 1, pp. 16–21, 1994.
Advances in
Operations Research Hindawi Publishing Corporation http://www.hindawi.com
Volume 2014
Advances in
Decision Sciences Hindawi Publishing Corporation http://www.hindawi.com
Volume 2014
Journal of
Applied Mathematics
Algebra
Hindawi Publishing Corporation http://www.hindawi.com
Hindawi Publishing Corporation http://www.hindawi.com
Volume 2014
Journal of
Probability and Statistics Volume 2014
The Scientific World Journal Hindawi Publishing Corporation http://www.hindawi.com
Hindawi Publishing Corporation http://www.hindawi.com
Volume 2014
International Journal of
Differential Equations Hindawi Publishing Corporation http://www.hindawi.com
Volume 2014
Volume 2014
Submit your manuscripts at http://www.hindawi.com International Journal of
Advances in
Combinatorics Hindawi Publishing Corporation http://www.hindawi.com
Mathematical Physics Hindawi Publishing Corporation http://www.hindawi.com
Volume 2014
Journal of
Complex Analysis Hindawi Publishing Corporation http://www.hindawi.com
Volume 2014
International Journal of Mathematics and Mathematical Sciences
Mathematical Problems in Engineering
Journal of
Mathematics Hindawi Publishing Corporation http://www.hindawi.com
Volume 2014
Hindawi Publishing Corporation http://www.hindawi.com
Volume 2014
Volume 2014
Hindawi Publishing Corporation http://www.hindawi.com
Volume 2014
Discrete Mathematics
Journal of
Volume 2014
Hindawi Publishing Corporation http://www.hindawi.com
Discrete Dynamics in Nature and Society
Journal of
Function Spaces Hindawi Publishing Corporation http://www.hindawi.com
Abstract and Applied Analysis
Volume 2014
Hindawi Publishing Corporation http://www.hindawi.com
Volume 2014
Hindawi Publishing Corporation http://www.hindawi.com
Volume 2014
International Journal of
Journal of
Stochastic Analysis
Optimization
Hindawi Publishing Corporation http://www.hindawi.com
Hindawi Publishing Corporation http://www.hindawi.com
Volume 2014
Volume 2014