The author would like to thank A. Snowden for providing the tail section for the open-cargo door geometry. References. [1] Claus, M., Morton, S. and Cummings, ...
17th Australasian Fluid Mechanics Conference Auckland, New Zealand 5-9 December 2010
Detached-Eddy Simulation of the Dynamic Loads of C-130H with Open Cargo Bay Stefan Schmidt Flight Systems Branch, Air Vehicles Division, Defence Science and Technology Organisation, Fishermans Bend, Victoria, 3207 AUSTRALIA
Abstract
Geometry
In this paper, the dynamic effects of wake turbulence around the empennage of the C-130H caused by the open rear cargo bay are simulated using unsteady computational fluid dynamics. Avoiding the inherent deficits of approaches based on the Reynoldsaveraged Navier–Stokes equations, detached-eddy simulation is used in this study to resolve the flow structures downstream of the cargo-bay. The unsteady wake imposes dynamics loads on the aircraft structure and has implications on the fatigue life of aircraft components. The results show a strong correlation with pressure fluctuations and locations of structural stress.
The geometry of the C-130H used by DSTO has been corrected for 1‘g’ flight condition The aft end of the fuselage with the open cargo-door was modelled from point clouds and other references (sketches, pictures) then fitted onto the existing geometry. However, both geometries did not fit together and therefore these two parts had to be manually stitched together, in a tedious and labour intensive process. Note that for the simulation documented in this paper, only the rear end of the cargo bay was modelled. In reality this extends further into the main fuselage, but the main intention was to capture the external flow dynamics and the wake. However, a the full aircraft bay is likely to have an effect on the wake structure, because of long eddyturnaround times in the bay, which would prolong computing times due to the superimposed low-frequency content.
Introduction
The C-130H Hercules (see figure 1) is a four-engine turboprop military transport aircraft and is is mainly used as a logistical air lifter by the RAAF for the transportation of troops, heavy machinery or other cargo.
Mesh
Figure 1: C-130H Hercules Aircraft. Beside regular transport, in which cargo is transported from one point to a final destination without landing, this platform allows deploying cargo during flight at low speed through its rear cargo door (see figure 2). Figure 3: Cutting plane illustrating mesh resolution (Mesh 2). Table 1: Mesh details of C-130H meshes: NC -number of cells, nP -number of prism layers, h-total prism-layer height, y1 -nearwall distance and ∆W - average wake cell size. Mesh 1 2 Figure 2: View through rear cargo door. Opening the cargo doors has implications on the handling and maneuverability of the aircraft due to increased drag and the highly unsteady wake, which is the result of the changed flowfield around the fuselage. As the bay door opens it forms sharp corners and acts like a bluff body, which produces massive vortex shedding extending over multiple aircraft lengths downstream [1, 3]. This flow behaviour not only affects the flight handling qualities of the aircraft, but also has a profound effect on the aircraft structure, as fluctuating pressures act on all surfaces exposed to these flow conditions. These dynamic loads consume the fatigue life of critical structural components around the door frame.
NC 11.4 M 16.8 M
nP 6 6
h 10.4 mm 10.4 mm
y1 0.3 mm 0.3 mm
∆W 0.08 mm 0.05 mm
Despite the existence of a geometrical symmetry plane at y=0, a full three-dimensional model has to be used to account for the three-dimensional nature of turbulence in the wake. The mesh (see table 1 for details) was similar to the one used in previous simulations with the closed ramp (not shown here), but as wall resolution in terms of near-wall distance y1 , number of prism layers nP and pressure-induced separation was not the main issue in this case, a high-Reynolds number mesh (y+ ≥30) in conjunction with a statistical turbulence model employing wall functions was sufficient for this study. The same near-wall resolution was successfully used for steady loads predictions using RANS. For this type of analysis the most important area, the cargo door, ramp and downstream of the cargo bay was refined
to resolve the coherent structures expected. In order to determine the mesh sensitivity of the results, a second, finer mesh was generated, in which mainly the mesh resolution in the wake of the cargo area (∆W ) was increased (table 1). Figure 3 shows the mesh size distribution around the aircraft for the finer mesh (Mesh 2) on the symmetry plane (y=0). The high-density mesh downstream of the cargo bay ensures that turbulent structures originating around the tail and door frame are well resolved. Numerical Method
fits of Reynolds-averaged Navier-Stokes (RANS) modelling in boundary-layers with large-eddy simulation (LES) in off-wall regions. Detached-eddy simulation (DES) is able to resolve the most energy-containing flow structures in the wake of the aircraft. This DES model, previously used to model vortex breakdown on an F/A-18 [2], determines the border of RANS and LES area by a new length scale LDES which includes the local mesh size ∆ = MAX(∆x , ∆y , ∆z ) and the turbulent length scale LRANS = k3/2 /ε yielding LDES = MIN (CDES ∗ ∆, LRANS ) with CDES = 0.61 .
The flow solver (Fluent) is a finite-volume method with colocated grid arrangement and 2nd order accuracy in space and time. Diffusive fluxes are discretised by a central-differencing scheme (CDS) and convective fluxes are approximated by upwind-biased schemes, except for the momentum equations, where central differencing is used, which accounts for the nondirectional nature of turbulence. As pure CDS may result in non-physical solutions (i.e. wiggles) for Peclet-numbers Pe > 2, the applied scheme is limited to ensure these artifacts are suppressed. For each physical time step, the solution is obtained by sequentially solving the momentum equations followed by the solution of the pressure-correction equation to ensure continuity using the SIMPLE algorithm using a maximum of 20 outer iterations. An algebraic multigrid solver (AMG) efficiently reduces the residuals for inner (linear) iterations. Scalar equations are solved after mass balance has been achieved. Turbulent mixing is accounted for by a hybrid RANSLES realizable k-ε turbulence model, which combines the bene-
The fairly large time step of ∆t = 10−3 s, in conjunction with an unconditionally stable implicit time integration, was selected to limit computing times while advancing the solution to reasonable total simulation times. The time step directly affects the high-frequency limit of the resolved turbulent spectrum for a given mesh resolution. A reduction of the time step size does not capture more information as a moving material particle of certain size has certain inertia associated with it and requires a characteristic time to change its position significantly. Averages were taken over the last Tavg = 1s of simulation time.
Figure 4: Coarse Mesh (1) - instantaneous mean velocity on centreplane (a); time-averaged velocity (b) and velocity fluctuations (c).
Figure 5: Fine Mesh (2) - instantaneous mean velocity on centreplane (a); time-averaged velocity (b) and velocity fluctuations (c).
Results
The flight condition for the open cargo bay case was determined at Ma=0.2 and AoA=+5deg. While the effect of the propeller slipstream does affect wake turbulence, is not accounted for, as this issue is not the main focus of this paper. The unsteady simulation was initialized and soon after the shedding cycles started.
After a couple of characteristic time scales (τ = c/U) the flow was time-averaged to get statistical results. The simulation was carried out for over Ts = 8 sec, which was enough to cover a limited number of shedding cycles. Particularly at low frequencies, only a few cycles were captured, but in the absence of any experimental data to compare with, it was sufficient to work out the difference between the two meshes. Figures 4 and 5 (a-c) depict the mean flow velocity on the centreline of the aircraft from an aft perspective for both meshes used. The top image for each case shows an instantaneous flowfield at no specific time, whereas images (b) and (c) show the statistical values derived from time-averaging. The averaged velocity U and its root-mean-square (rms)-value u′2 reveal the strong effect of opening the cargo door. The wake is quite prolonged, despite being dampened by the mesh design and interacts with the empennage of the aircraft resulting in large dynamic loads. The mean value reveals a massive recirculation zone around the rear end of the cargo ramp, where payloads are deployed from the aircraft. The rms-values illustrate areas of large turbulent intensity. It is not surprising that the area of high levels of turbulence is linked to the location of the recirculation region within the cargo bay and the wake immediately downstream of the cargo-bay area. This does not vary much between both meshes; it is just the level of resolved turbulence, which changes. As no quantitative results are available for comparison, these result indicate that even fairly coarse meshes with smart placement of refined areas, can produce quite reasonable results.
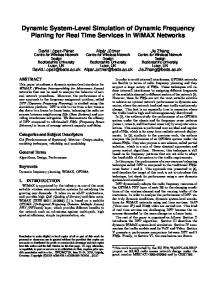
structures (i.e. eddies) in the flow. The coherent structures in the wake of the aircraft are clearly identifiable and as discussed above, the mesh refinement in that area increases the range of fine-scale turbulence resolved. Figure 8 shows the pressure fluctuations (rms-value) on the aircraft. The results show that the largest pressure fluctuations are concentrated on the underside of the horizontal tail in the area of the upper cargo door as well as at the interface between cargo bay and fuselage, where the free stream interacts with the recirculation and wake of the aircraft.
Figure 8: Fine Mesh (2) - Pressure fluctuations on the aircraft empennage. In addition, integrated surface pressures around the open door and bay area were computed for analysis of the dominant modes in the flow. Figure 9 illustrates the location of the surfaces for which time histories are recorded (some surfaces are not shown). The first 6 locations refer to the cargo bay ramp and door; the remaining ones are located within the cargo bay.
(10) (8)
Figure 6: Coarse Mesh (1) - Q=2000 Iso-surface.
9
7
(4)
5
3 1 Cargo Ramp 1 - freestream 2 - aft 3 - side-port 4 - side-starboard 5 - top
6
2
Cargo Door 6 - upper Cargo Bay 7 - front 8 - side-port 9 - side-starboard 10- top
Figure 9: Surfaces in the cargo-bay area.
Figure 7: Fine Mesh (2) - Q=2000 Iso-surface. Figures 6 and 7 show iso-surfaces of the second invariant of the velocity gradient Q > 0 and illustrate the location of turbulent
Figures 10(a,b) depict the time histories of the area-averaged pressure coefficient Cp for selected surfaces in the cargo area. For easier reading, the values associated with the cargo bay are indicated by dashed lines. It can be seen that most surfaces exhibit quite small pressure fluctuations, except the blunt rear face of the ramp door and, to a smaller extent, the upper cargo door. Mesh refinement does not change the distribution of the forces; the most noticeable differences can be found at the rear of the cargo ramp. As no flight test data was available for comparison,
-0.1
−3
5
-0.2
x 10
Cargo Ramp − freestream Cargo Ramp − aft Cargo Ramp − side−port Cargo Ramp − side−starboard Cargo Ramp − top Cargo Door − upper Cargo Bay − front Cargo Bay − side−port Cargo Bay − side−starboard Cargo Bay − top
4.5
(a)
4
-0.3
3.5 3
CP
PSD
-0.4
2.5 2
-0.5
1.5 Cargo Ramp - freestream
1
-0.2
0.5
(b)
0
-0.3
0
10
20 30 Reduced Frequency F
40
50
Figure 11: PSD of selected surfaces in the cargo area.
CP
-0.4
-0.5 Cargo Ramp - freestream Cargo Ramp - aft Cargo Ramp - side-port Cargo Ramp - side-starboard Cargo Ramp - top Cargo Door - upper Cargo Bay - front Cargo Bay - side-port Cargo Bay - side-starboard Cargo Bay - top
-0.6
-0.7
-0.8
2
2.5
3
3.5
4
4.5
5
5.5
6
6.5
7
7.5
8
8.5
9
Time [s]
Figure 10: Time history of area-averaged pressure coefficient on selected surfaces: (a) Mesh 1, (b) Mesh 2. these area-averaged pressure coefficients give an indication of dominating frequencies acting on these surfaces. The larger this reference area, the less detailed the surface pressure information that is available. Hence, local values can be much larger and the frequency response much noisier than these spatially averaged values indicate. However, often the integral net force is of more importance than local values and therefore getting the bigger picture is of more value. Figure 11 shows the power-spectral density (PSD) of all 10 pressure locations. It is evident, that the maximum level of PSD for all locations is fairly similar, except for the underside of the cargo ramp, which faces freestream conditions and therefore does not come into contact with the turbulent wake and for this reason exhibits only small pressure fluctuations. Most peaks occur in the reduced frequency range of F=1-20 (with F=f c/U, c=4.1783m, U=70m/s) equating to roughly f=16-320Hz, with some showing more than one local maximum (rear end and tops of ramp and bay). For consistency, the port and starboard side should be similar; this has not been achieved yet, because for this statistical quantity the number of samples taken is not large enough yet. Conclusion
The unsteady simulation of the flow past a C-130 with the cargo door open reveals the existence of massive flow separation aft of the cargo bay. This results in large pressure fluctuations acting on the empennage, as well as other internal structural components around the doorframe and other affected areas. As a consequence of the open cargo bay, the ramp exhibits net forces in the similar frequency range, which imposes stress on the hinges of the ramp as well as supporting structures. In order to assess the numerical results, additional data needs to be obtained. How the recorded fluctuating pressures can be translated to dynamic
structural loads, depends on the airframe structure. However, it can be expected that these flow-induced fluctuations affect the airframe and may result in resonance of structural components. Depending on the phase angles of these excitations the amplitudes can be constructive (add up) or destructive (subtract) and for this reason, until substantial validation data is available, CFD alone cannot determine the overall effect on the fatigue life of specific components. The results obtained will be analysed with other groups working on aircraft structures and we hope to link the flow patterns found in this study to the occurrence of material fatigue and cracks. The computational method of choice was detached-eddy simulation. Only three-dimensional, unsteady flow simulation is able to predict the dominant flow patterns in these types of flows, as both steady RANS as well as unsteady RANS are not able to resolve any form of turbulent detail directly. The level of turbulence or level of detail in the turbulent structures is directly related to the mesh resolution. In the near-wall region the hybrid model works in RANS-mode and does not affect the wake. For this particular case it is therefore safe to adopt the surface mesh from a high-Reynolds number RANS mesh. Acknowledgments
The author would like to thank A. Snowden for providing the tail section for the open-cargo door geometry. References
[1] Claus, M., Morton, S. and Cummings, R., Investigation into the Flow behind a C-130 with the Application of a DES Turbulence Model: Comparison between Computational and Experimental Results, AIAA 43rd Aerospace Sciences Meeting, Reno NV, 2005-0884. [2] Schmidt, S. and Levinski, O., Prediction of Aircraft Empennage Buffet Loads, in 16th Australasian Fluid Mechanics Conference, editors T. McIntyre and P. Jacobs, University of Queensland, Gold Coast, Australia, 2007, volume 1, 129–134. [3] Serrano, M., Leigh, E., Morton, S. and Squires, K., Computational Aerodynamics of the C-130 in Airdrop Configurations, 41th AIAA Aerospace Sciences Meeting and Exhibit, Reno, NV, USA, 2003-0229.