29â30, 1993. [6] M. Fowler, Refactoring: improving the design of existing code. Addison- ..... and J. Noble, âThe qualitas corpus: A curated collection of java code.
Detecting Code Smells using Machine Learning Techniques: Are We There Yet? Dario Di Nucci1,2 , Fabio Palomba3 , Damian A. Tamburri4 , Alexander Serebrenik4 , Andrea De Lucia1 1
3
University of Salerno, Italy – 2 Vrije Universiteit Brussel, Belgium University of Zurich, Switzerland – 4 Eindhoven University of Technology, The Netherlands
adoption in practice [20], [28]. In the first place, code smells detected by existing approaches can be subjectively perceived and interpreted by developers [29], [30]. Secondly, the agreement between the detectors is low [31], meaning that different tools can identify the smelliness of different code elements. Last, but not least, most of the current detectors require the specification of thresholds that allow them to distinguish smelly and non-smelly instances [20]: the selection of thresholds, hence, strongly influence the detectors’ performance. To overcome these limitations, machine-learning (ML) techniques are being adopted to detect code smells [32]. Usually a supervised method is exploited, i.e., a set of independent variables (a.k.a. predictors) are used to determine the value of a dependent variable (i.e., presence of a smell or degree of the smelliness of a code element) using a machine-learning classifier (e.g., Logistic Regression [33]). In order to empirically assess the actual capabilities of ML techniques for code smell detection, in [32] a large-scale I. I NTRODUCTION study was conducted where 32 different ML algorithms were Nowadays, the complexity of software systems is growing applied to detect four code smell types, i.e., Data Class, Large fast and software companies are required to continuously Class, Feature Envy and Long Method. The authors reported update their source code [1]. Those continuous changes that most of the classifiers exceeded 95% both in terms of frequently occur under time pressure and lead developers to accuracy and of F-Measure, with J48 and R ANDOM F OREST set aside good programming practices and principles in order obtaining the best performance. The authors interpret the results to deliver the most appropriate but still immature product as an indication that “using machine learning algorithms for in the shortest time possible [2]–[4]. This process can often code smell detection is an appropriate approach” and that the result in the introduction of so-called technical debt [5], design research problem in question is essentially solved [32]. problems likely to have negative consequences during the However, in an effort to empirically reinforce their conclusystem maintenance and evolution. sion, we analysed the reference experimental setting in [32] and One of the symptoms of the technical debt are code considered datasets containing instances affected by one type smells [6], suboptimal design decisions applied by developers of smells or non smelly instances. Furthermore, to evaluate that can negatively affect the overall maintainability of a the generalizability of the results to different contexts and the software system. Over the last decade, the research community actual capabilities of machine learning techniques for code heavily investigated (i) introduction of code smells [7], [8], smell detection, in this paper we aim at replicating the study (ii) their evolution [9]–[12], (iii) their effect on program in a more realistic scenario with datasets containing instances comprehension [13], [14] and on the change- and bug-proneness of more than one type of smells, besides non smelly instances. of the affected source code elements [15], [16], and (iv) the Our results show that with a different experimental context perception and ability of developers to address them [17]–[19]. we cannot reach the same conclusions as in [32], mainly due Moreover, several code smell detectors have been pro- to the difference in the metric distribution of our datasets with posed [20], [21]: the detectors mainly differ in the underlying respect to the datasets used in the previous work. algorithm (e.g., metric-based [22]–[25] vs. search-based techWe conclude that, when testing code smell prediction models niques [26], [27]) and for the specific metric types considered on the revised dataset, we noticed that performances are up to (e.g., product metrics [22], [23] vs. process metrics [25]). 90% less accurate in terms of F-Measure than those reported in Despite the good performance shown by the detectors, the previous study. Our findings have important implications for recent studies highlight important limitations threatening their the research community in code smell detection. On one hand, Abstract—Code smells are symptoms of poor design and implementation choices weighing heavily on the quality of produced source code. During the last decades several code smell detection tools have been proposed. However, the literature shows that the results of these tools can be subjective and are intrinsically tied to the nature and approach of the detection. In a recent work the use of Machine-Learning (ML) techniques for code smell detection has been proposed, possibly solving the issue of tool subjectivity giving to a learner the ability to discern between smelly and non-smelly source code elements. While this work opened a new perspective for code smell detection, it only considered the case where instances affected by a single type smell are contained in each dataset used to train and test the machine learners. In this work we replicate the study with a different dataset configuration containing instances of more than one type of smell. The results reveal that with this configuration the machine learning techniques reveal critical limitations in the state of the art which deserve further research. Index Terms—Code Smells; Machine Learning; Empirical Studies; Replication Study
c 2018 IEEE 978-1-5386-4969-5/18
612
SANER 2018, Campobasso, Italy RENE Track
c 2018 IEEE. Personal use of this material is permitted. Permission from IEEE must be obtained for all other uses, in any current or future media, including reprinting/ Accepted for publication by IEEE. republishing this material for advertising or promotional purposes, creating new collective works, for resale or redistribution to servers or lists, or reuse of any copyrighted component of this work in other works.
the problem of detecting code smells through the adoption of ML techniques may still be worthy of further attention, e.g., in devising proper ML-based code smell detectors and datasets for software practitioners. Structure of the paper. Section II discusses the related literature. Section III describes the reference work [32]. Section IV reports the overall methodology adopted. In Section V we report the design and results of the study aimed at analyzing the metric distribution of smelly and non-smelly elements in the dataset used in the reference work, while Section VI discusses the replication of the reference study. Section VII reports possible threats affecting our findings and how we mitigated them. Finally, Section VIII concludes the paper and outlines our future research agenda. II. R ELATED W ORK
harmfulness of code smells [57]. Furthermore, they provided a ML method for the assessment of code smell intensity, i.e., the severity of a code smell instance perceived by developers [58]. Finally, they empirically benchmarked a set of 16 ML techniques for the detection of four code smell types [32]: they performed the analyses over 74 software systems belonging to the Qualitas Corpus dataset [59]. This is clearly the reference work for our study. In this study, all the machine learners experimented with achieve high performance in a crossproject scenario, with the J48 and R ANDOM F OREST classifiers obtaining the highest accuracy. Perhaps more importantly, the evidence indicates that a hundred training examples are enough for reaching at least 95% accuracy. We aim to strengthen the empirical findings above or uncover any limitations of the reference work, so as to reinforce our understanding on whether detecting code smells using ML techniques is in fact a closed research issue.
The problem of detecting code smells [6] in source code has III. T HE R EFERENCE W ORK recently attracted the attention of multiple researchers [20]. On the one hand, empirical studies have been performed with the In [32] the authors analyze three main aspects related to the aim of understanding code smell evolution [7]–[10], [12], [34], use of machine-learning algorithms for code smell detection: their perception [17], [18], [35]–[37], as well as their impact on (i) performance of a set of classifiers over a sample of the total non-functional properties of source code [13]–[16], [38]–[40]. instances contained in the dataset, (ii) analysis of the minimum On the other hand, detection approaches have been devised: training set size needed to accurately detect code smells, and most of them rely on the analysis of structural information (iii) analysis of the number of code smells detected by different extractable from the source code [22]–[24], [41], while a recent classifiers over the entire dataset. trend is concerned with the analysis of alternative sources of In this paper, we focus on the first research question of information [25], [42] or the usage of search-based software the reference work. In the following subsections we detail the engineering methods [26], [27], [43], [44]. In the context of methodological process adopted in [32]. this paper we mainly focus on supervised methods for the detection of code smells. Thus, in this section we discuss A. Context Selection papers leveraging ML models to identify code smells. The context of the study was composed of software systems Kreimer [45] originally proposed the use of decision trees and code smells. for the detection of the Blob and Long Method code smells on The authors have analyzed systems from the Qualitas two small-scale software systems, finding that such a prediction Corpus [59], release 20120401r, one of the largest curated model can lead to high values of accuracy. The findings were benchmark datasets to date, specially designed for empirical then confirmed by Amorim et al. [46], who tested decision software engineering research. Among 111 Java systems of the trees over four medium-scale open-source projects. Later on, corpus, 37 were discarded because they could not be compiled Vaucher et al. [47] relied on a Naive Bayes technique to track and therefore code smell detection could not be applied. Hence, the evolution of the Blob smell, while Maiga et al. [48], [49] the authors focused on the remaining 74 systems. devised a SVM approach for the incremental detection of the For each system 61 source code metrics were computed at same smell which is able to reach a F-Measure of ≈80%. class level and 82—at method level. The former were used Khomh et al. [50], [51] proposed the use of Bayesian as independent variables for predicting class-level smells Data Belief Networks to detect Blob, Functional Decomposition, and Class and God Class, the latter for predicting method-level Spaghetti Code instances on open-source programs, finding smells Feature Envy and Long Method: an overall F-Measure close to 60%. Following this direction, Hassaine et al. [52] defined an immune-inspired approach for 1) God Class. It arises when a source code class implements the detection of Blob smells, while Oliveto et al. [53] relied on more than one responsibility; it is usually characterized by B-Splines for understanding the “signatures” of code smells and a large number of attributes and methods, and has several training a machine learner for detecting them. More recently, dependencies with other classes of the system. machine-learning techniques have been also adapted for the 2) Data Class. This smell refers to classes that store data detection of a specific type of code smell, i.e., the Duplicated without providing complex functionality. Code (a.k.a, code clones) [54]–[56]. 3) Feature Envy. This is a method-level code smell that Arcelli Fontana et al. [32], [57], [58] provided the most appears when a method uses much more data than another relevant advances in this field: in the first place, they theorized class with respect to the one it is actually in. that ML might lead to a more objective evaluation of the
613
D. Validation Methodology
Table I D ETECTORS CONSIDERED FOR BUILDING A CODE SMELL DATASET.
Code Smell God Class Data Class Feature Envy Long Method
Detectors iPlasma, PMD iPlasma, Fluid Tool, Antipattern Scanner iPlasma, Fluid Tool iPlasma, PMD, Marinescu [22]
4) Long Method. It represents a large method that implements more than one function. The choice of these smells is due to the fact that they capture different design issues, e.g., large classes or misplaced methods. B. Machine Learning Techniques Experimented In [32] six basic ML techniques have been evaluated: J48 [60], JR IP [61], R ANDOM F OREST [62], NAIVE BAYES [63], SMO [64], and L IB SVM [65]. As for J48, the three types of pruning techniques available in W EKA [66] were used, SMO was based on two kernels (e.g., P OLYNOMIAL and RBF), while for L IB SVM eight different configurations, using C-SVC and V-SVC, were used. Thus, in total 16 different ML techniques have been evaluated. Moreover, the ML techniques were also combined with the ADAB OOST M1 boosting technique [67], i.e., a method that iteratively uses a set of models built in previous iterations to manipulate the training set and make it more suitable for the classification problem [68], leading to 32 different variants. An important step for an effective construction of machinelearning models consists of the identification of the best configuration of parameters [69]: the authors applied to each classifier the Grid-search algorithm [70], capable of exploring the parameter space to find an optimal configuration.
To test the performance of the different code smell prediction models built, the authors applied 10-fold cross validation [71]: each of the four datasets was randomly partitioned in ten folds of equal size, such that each fold has the same proportion of smelly elements. A single fold was retained as test set, while the remaining ones were used to train the ML models. The process was then repeated ten times, using each time a different fold as the test set. Finally, the performance of the models was assessed using mean accuracy, F-Measure, and AUC-ROC [72] over the ten runs. E. Limitations and Replication Problem Statement The results achieved in [32] reported that most of the classifiers have accuracy and F-Measure higher than 95%, with J48 and R ANDOM F OREST being the most powerful ML techniques. These results seem to suggest that the problem of code smell detection can be solved almost perfectly through ML approaches, while other unsupervised techniques (e.g., the ones based on detection rules [23]) only provide suboptimal recommendations. However, we identified possible reasons for these good results: 1) Selection of the instances in the dataset. The first factor possibly affecting the results might be represented by the characteristics of smelly and non-smelly instances present in the four datasets exploited (one for each smell type): in particular, if the metric distribution of smelly elements is strongly different than the metric distribution of nonsmelly instances, then any ML technique might easily distinguish the two classes. Clearly, this does not properly represent a real-case scenario, where the boundary between the structural characteristics of smelly and non-smelly code components is not always clear [7], [29]. In addition, the authors built four datasets, one for each smell. Each dataset contained code components affected by that type of smell or non-smelly components. This also makes the datasets unrealistic (a software system usually contains different types of smells) and might have made easier for the classifiers to discriminate smelly components.
C. Dataset Building To establish the dependent variable for code smell prediction models, the authors applied for each code smell the set of automatic detectors shown in Table I. However, code smell detectors cannot usually achieve 100% recall, meaning that an automatic detection process might not identify actual code smell instances (i.e., false negatives) even in the case that multiple detectors are combined. To cope with false positives and to increase their confidence in validity of the dependent variable, the authors applied a stratified random sampling of the classes/methods of the considered systems: this sampling produced 1,986 instances (826 smelly elements and 1,160 nonsmelly ones), which were manually validated by the authors in order to verify the results of the detectors. As a final step, the sampled dataset was normalized for size: the authors randomly removed smelly and non-smelly elements building four disjoint datasets, i.e., one for each code smell type, composed of 140 smelly instances and 280 nonsmelly ones (for a total of 420 elements). These four datasets represented the training set for the ML techniques above.
2) Balanced dataset. In the reference work, one third of the instances in the dataset was composed of smelly elements. According to recent findings on the diffuseness of code smells [16], a small fraction of a software system is usually affected by code smells: e.g., Palomba et al. [16] found that God Classes represent less than 1% of the total classes in a software system. Because of the points above, we argue that the capabilities of ML techniques for code smell detection should be reevaluated. In this paper, we replicate the reference study with different datasets containing instances of more than one type of smells and with a different balance between smelly and non smelly instances.
614
IV. E MPIRICAL S TUDY D EFINITION The goal of the empirical study was to analyze the sensitivity of the results achieved by our reference work with respect to the metric distribution of smelly and non-smelly instances, with the purpose of understanding the real capabilities of existing prediction models in the detection of code smells. The perspective is of both researchers and practitioners: the former are interested in understanding possible limitations of current approaches in order to devise better ones; the latter—in evaluating the applicability of code smell prediction in practice. We pose the following research questions: •
RQ1. What is the difference in the metric distribution of smelly and non-smelly instances in the four datasets exploited in the reference work?
•
RQ2. What is the performance of ML techniques when trained on a more realistic dataset, containing different types of smells, with a reduced proportion of smelly components and with a smoothed boundary between the metric distribution of smelly and non-smelly components?
RQ1 can be considered as a preliminary analysis aimed at assessing whether and to what extent the metric distribution of smelly and non-smelly instances in the datasets used in the reference work is different. With RQ2 we aim at assessing the performance of code smell prediction techniques in a more realistic setting where the differences between smelly and non-smelly instances are less prominent. To enable a proper replication, the context of our study was composed of the same dataset and code smells used by the reference work. Thus, we took into account the 74 software systems and the four code smells discussed in Section III. V. RQ1—M ETRICS A NALYSIS We start by comparing the distributions of metrics over smelly and non-smelly code elements (RQ1). A. Design
Table II C OMPARISON OF THE METRICS FOR SMELLY AND NON - SMELLY INSTANCES . N. 1 2 3 4 5 6 7 8 9 10 11 12 13 14 15 16 17 18 19 20 21 22 23 24 25 26 27 28 29 30 31 32 33 34 35 36
Data Class p d < 0.01 Large < 0.01 Small < 0.01 Medium < 0.01 Large < 0.01 Large < 0.01 Large < 0.01 Large < 0.01 Large < 0.01 Large < 0.01 Large < 0.01 Large < 0.01 Large 1.00 Negligible 1.00 Negligible 1.00 Negligible < 0.01 Large < 0.01 Medium 1.00 Negligible < 0.01 Large < 0.01 Large 1.00 Negligible < 0.01 Large 1.00 Negligible 0.69 Small 1.00 Negligible < 0.01 Medium < 0.01 Small < 0.01 Medium < 0.01 Medium < 0.01 Small < 0.01 Small < 0.01 Medium < 0.01 Small < 0.01 Medium -
God Class p d < 0.01 Large < 0.01 Large < 0.01 Large < 0.01 Large < 0.01 Large < 0.01 Large < 0.01 Large < 0.01 Large < 0.01 Large < 0.01 Large < 0.01 Large < 0.01 Large < 0.01 Large < 0.01 Large < 0.01 Large < 0.01 Large < 0.01 Large < 0.01 Large < 0.01 Medium < 0.01 Large 1.00 Negligible < 0.01 Large < 0.01 Medium < 0.01 Large < 0.01 Large < 0.01 Large < 0.01 Large < 0.01 Large < 0.01 Large < 0.01 Large < 0.01 Large < 0.01 Large < 0.01 Large < 0.01 Small < 0.01 Medium < 0.01 Small
Feature Envy p d < 0.01 Large < 0.01 Large < 0.01 Small < 0.01 Large < 0.01 Large < 0.01 Large 1.00 Negligible < 0.01 Large < 0.01 Large < 0.01 Large < 0.01 Large < 0.01 Large < 0.01 Large < 0.01 Large < 0.01 Large < 0.01 Large < 0.01 Large < 0.01 Large < 0.01 Large < 0.01 Large < 0.01 Large < 0.01 Medium < 0.01 Medium < 0.01 Small < 0.01 Small < 0.01 Small -
Long Method p d < 0.01 Large < 0.01 Large < 0.01 Large < 0.01 Large < 0.01 Large < 0.01 Large < 0.01 Large < 0.01 Large < 0.01 Large 1.00 Negligible < 0.01 Large < 0.01 Large < 0.01 Large < 0.01 Large < 0.01 Large < 0.01 Large 1.00 Negligible < 0.01 Large < 0.01 Large < 0.01 Large < 0.01 Large < 0.01 Large < 0.01 Large < 0.01 Large < 0.01 Large < 0.01 Large < 0.01 Large < 0.01 Medium < 0.01 Medium < 0.01 Medium < 0.01 Medium < 0.01 Medium < 0.01 Medium < 0.01 Large -
Afterwards, we compared the distribution of the metrics representing smelly and non-smelly instances among them using the Wilcoxon Rank Sum statistical test [75] with pvalue = 0.05 as significance threshold. Since we performed multiple tests, we adjusted p-values using the BonferroniHolm’s correction procedure [76]. The procedure firstly sorts the p-values resulting from n tests in ascending order of values, multiplying the smallest p-value by n, the next by n − 1, and so on. Then, each resulting p-value is then compared with the desired significance level (e.g., 0.05) to determine whether or not it is statistically significant. Furthermore, we estimated the magnitude of the observed differences using Cliff’s Delta (or d), a non-parametric effect size measure [77] for ordinal data. To interpret the effect size values, we follow established guidelines [77]: small for d < 0.33 (positive as well as negative values), medium for 0.33 ≤ d < 0.474 and large for d ≥ 0.474. If the differences in the metric distributions of smelly and non-smelly instances are statistically significant and with a large effect size, then the two classes can be clearly considered as too easy to classify for any machine-learning technique.
To answer this research question, we compared the distribution of the metrics representing smelly and non-smelly instances in the dataset of the reference work. Given the amount of metrics composing class- and method-level code smells, i.e., 61 and 82, respectively, an extensive comparison would have been prohibitively expensive, other than being not practically useful since not all the metrics actually have an impact on the prediction of the dependent variable [73]. For this reason, we first reduce the number of independent variables by means of feature selection, i.e., we consider only the metrics impacting more the prediction of code smells. To this aim, we employed the widely-adopted Gain Ratio Feature Evaluation algorithm [74], identifying the features having more weight in the code B. Results smell detection. The output of the algorithm is a ranked list Table II reports the comparison of the metric distribution of with metrics having higher GainRatio, i.e., giving more weight smelly and non-smelly instances. The metrics are presented in to the prediction being ranked first. GainRatio ranges between the decreasing order of the GainRatio. For sake of readability, 0 and 1, and as cut-off point of the ranked list we selected 0.1, we avoid adding the complete metric names in the table. as recommended by Quinlan [74]. However, our online appendix [78] contains the information
615
about the relevant metrics for each dataset. It is important to note that the feature selection process detected approximatively one third of the total features as relevant: this actually means that most of the metrics present in the original dataset did not impact the prediction of code smells, but rather than might have caused overfitting of the model. Notice that in most cases the differences between the distributions are statistically significant. Analyzing Data Class, we can notice that in 26 of 34 considered metrics there is a significant difference (14 with Large effect size). Moreover looking at the first 10 features in terms of GainRatio, we can notice that in 8 out 10 case there is a Large effect size. More evident results are observable when analyzing God Class. In this case, 35 out of 36 metrics distributions are statistically different (p-value < 0.05). In particular, in 29 cases the distributions are different with a Large effect size, while in 3 cases the effect size is medium. Analyzing the method-level code smells (e.g., Feature Envy and Long Method), we can notice similar results. Indeed, in the first case, 96% of the metrics distributions filtered with GainRatio are statistically different (73% with Large effect size), while in the second case, 94% of metrics distributions are statistically different (74% with Large effect size). These results demonstrate that smelly and non-smelly instances selected in the original dataset are clearly different. Hence, the selected instances could lead to overestimate the performances of ML techniques for code smell prediction.
B J48 Pruned B J48 Unpruned B J48 Reduce Error Pruning B JRip B Random Forest B Naive Bayes B SMO RBF B SMO Poly B LibSVM C-SVC Linear B LibSVM C-SVC Poly B LibSVM C-SVC Radial B LibSVM C-SVC Sigmoid J48 Pruned J48 Unpruned J48 Reduce Error Pruning JRip Random Forest Naive Bayes SMO RBF SMO Polynomial LibSVM C-SVC Linear LibSVM C-SVC Poly
Summary for RQ1. Metrics distribution between smelly and non-smelly instances is different in most cases with Large effect size. The selection of the instances could lead to overestimate the performances of machine learning techniques in the context of bad smell prediction.
LibSVM C-SVC Radial LibSVM C-SVC Sigmoid 0.00
0.10
Accuracy
0.20
0.30
F-Measure
0.40
0.50
0.60
0.70
0.80
0.90
1.00
AUC-ROC
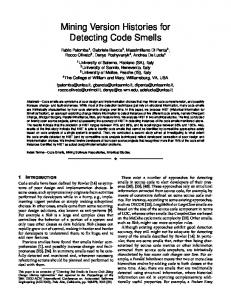
Figure 1. Data Class: Bar charts of Accuracy, F-Measure, and AUC-ROC achieved by the methods under study on the dataset we created.
VI. RQ2—R EPLICATION S TUDY RQ2 aims at evaluating whether the factors related to the construction of the dataset influence the conclusions of the reference study. Therefore, as recommended by Shull et al. we conduct a dependent replication [79]: we vary the composition of the dataset and keep all other factors (e.g., origin of the dataset, ML approaches, code smell detection tools, validation methodology) unchanged. Indeed, changing the population on which the phenomenon is tested is a common procedure in dependent replications [80]–[82]. Since none of the authors has been involved in conducting the reference study, our replication should be classified as external, a kind of replication claimed to be a “cornerstone of modern scientific disciplines” [83], and still relatively uncommon in software engineering [84]. Based on the results of our RQ1, we modify the dataset in order to (i) reduce the difference in the metrics distribution, (ii) have a less balanced dataset between smelly and non-smelly instances, and (iii) have different types of smells in the same dataset so that we can model a more realistic scenario [16].
A. Design To answer our second research question, we replicated the reference study after setting up the original dataset. Specifically, we designed our replication in two steps, described below. Dataset Setup. In RQ1, we found that the two sets of elements to predict, i.e., smelly and non-smelly ones, are very different from a statistical point of view and hence any ML approach can be expected to discriminate between them. To verify the actual capabilities of the code smell prediction models evaluated in the reference study, we built a new dataset closer to reality by merging the instances contained in the four original datasets and replicated the study on it. In this way, thea new dataset includes source code elements affected by different smells, and provides a more realistic scenario in which different code elements having a similar metric profile are affected by different design issues.
616
B J48 Pruned
B J48 Pruned
B J48 Unpruned
B J48 Unpruned
B J48 Reduce Error Pruning
B J48 Reduce Error Pruning
B JRip
B JRip
B Random Forest
B Random Forest
B Naive Bayes
B Naive Bayes
B SMO RBF
B SMO RBF
B SMO Poly
B SMO Poly
B LibSVM C-SVC Linear
B LibSVM C-SVC Linear
B LibSVM C-SVC Poly
B LibSVM C-SVC Poly
B LibSVM C-SVC Radial
B LibSVM C-SVC Radial
B LibSVM C-SVC Sigmoid
B LibSVM C-SVC Sigmoid
J48 Pruned
J48 Pruned
J48 Unpruned
J48 Unpruned
J48 Reduce Error Pruning
J48 Reduce Error Pruning
JRip
JRip
Random Forest
Random Forest
Naive Bayes
Naive Bayes
SMO RBF
SMO RBF
SMO Polynomial
SMO Polynomial
LibSVM C-SVC Linear
LibSVM C-SVC Linear
LibSVM C-SVC Poly
LibSVM C-SVC Poly
LibSVM C-SVC Radial
LibSVM C-SVC Radial
LibSVM C-SVC Sigmoid 0.00
LibSVM C-SVC Sigmoid 0.10
Accuracy
0.20
0.30
F-Measure
0.40
0.50
0.60
0.70
0.80
0.90
1.00
0.00
AUC-ROC
0.10
Accuracy
0.20
0.30
F-Measure
0.40
0.50
0.60
0.70
0.80
0.90
1.00
AUC-ROC
Figure 2. God Class: Bar charts of Accuracy, F-Measure, and AUC-ROC achieved by the methods under study on the dataset we created.
Figure 3. Feature Envy: Bar charts of Accuracy, F-Measure, and AUC-ROC achieved by the methods under study on the dataset we created.
To this aim, we firstly merged the datasets regarding God Class and Data Class for class-level code smells and secondly the ones related to Feature Envy and Long Method for method-level ones. Next we duplicated the datasets so that we obtained (i) two class-level datasets with dependent variables the presence of God Class or Data Class, respectively, and (ii) two method-level datasets with dependent variables the presence of Feature Envy or Long Method, respectively.
mean accuracy, F-Measure, and AUC-ROC achieved over 10 runs, as done in the reference work.
Replicating the study. Once we had created the four datasets, we performed exactly the same experiment as done in the reference work, thus using the same machine-learners configured in the same way. To measure the performance of the different machine-learning algorithms and compare them with the one achieved in the reference study, we computed the
B. Results Before discussing the results of this research question, it is important to note that we replicated the statistical analyses made in RQ1 on the merged dataset we created. We reported the detailed results in our online appendix [78], however we found that in our datasets smelly and non-smelly elements were much less different in terms of metric distribution than the original dataset: most of the differences between the distributions of smelly and non-smelly elements are not statistically significant or have a small/negligible effect size. In particular, comparing smell and non-smelly instances of Data Class, we found that the difference between them was reduced in 7 of the 34 considered
617
set in Weka was too high to allow the model to complete the execution in the considered time and (ii) the parameter values assigned in the reference work were not specified. First, we noticed that the accuracy of all the models is still noticeable high when compared to the results of the reference study (on average, 76% vs 96%): this is mainly due to the characteristics of the accuracy metric, which takes into account the ability of a model to classify true negative instances, possibly leading to a misinterpretation of the performance a prediction model [85]. It is worth noting that non-smelly elements in each dataset are 5/6 of the total instances as opposed to 2/3 in the original datasets. However, the F-Measure tells a different story. Indeed, the results are 90% lower than in the reference work (e.g., Random Forest), indicating that the models were not actually able to properly classify the smelliness of the analyzed code elements. This result holds for all the code smell types considered, thus confirming that in a different dataset construction scenario, the experimented models are not able to replicate the high performances achieved in the reference work. The best performance (for all the smells) is achieved by the tree-based classifiers, i.e., R ANDOM F OREST and J48: this confirms the results of the reference study, which highlighted that this type of classifiers performs better than the others. Finally, the results for AUC-ROC are different than the ones reported in the reference study. While in the reference study all classifiers had an AUC-ROC ranging from 95% to 99%, we found that instead the choice of the ML approach might be highly relevant for effectively detecting code smells, thus highlighting the need of more sophisticated ways [86], [87] to combine machine-learning approaches for an effective detection of code smells.
B J48 Pruned
B J48 Unpruned
B J48 Reduce Error Pruning
B JRip
B Random Forest
B Naive Bayes
B SMO RBF
B SMO Poly
B LibSVM C-SVC Linear
B LibSVM C-SVC Poly
B LibSVM C-SVC Radial
B LibSVM C-SVC Sigmoid
J48 Pruned
J48 Unpruned
J48 Reduce Error Pruning
JRip
Random Forest
Naive Bayes
SMO RBF
SMO Polynomial
LibSVM C-SVC Linear
LibSVM C-SVC Poly
LibSVM C-SVC Radial
LibSVM C-SVC Sigmoid 0.00
0.10
Accuracy
0.20
0.30
F-Measure
0.40
0.50
0.60
0.70
0.80
0.90
Summary for RQ2. The performance of code smell prediction models in terms of F-measure is up to 90% lower than the one reported in the reference study. The difference in the performance are mainly due to the different way to construct the datasets in the two studies, thus weakening the actual capabilities of ML techniques for code smell detection.
1.00
AUC-ROC
Figure 4. Long Method: Bar charts of Accuracy, F-Measure, and AUC-ROC achieved by the methods under study on the dataset we created.
metrics. Similar results were obtained when considering the other smells. In details, looking at God Class 9 of 36 metrics were less different, while in Feature Envy the difference was reduced in 5 of 26 metrics and in Long Method in 9 of 34 of them. Figures 1 to 4 show the performance of the code smell prediction models experimented on the merged datasets we created. For sake of space limitations, we made available the fine-grained results in our online appendix [78]. Note that due to computational reasons, in our experiment we limited the execution time to 10 minutes: an empty bar in the figures indicate that a certain classifier did not complete the computation during the allocated time. We could not run the nu-based VSM models because (i) the default parameter
VII. T HREATS TO VALIDITY In this section we discuss the threats that might have affected our empirical study and how we mitigated them. Threats to construct validity. As for potential issues related to the relationship between theory and observation, a first discussion point regards the dataset used in the study. Specifically, we exploited the same dataset used in the reference study in order to rely on the same classification of the dependent variable (i.e., the smelliness of source code elements), thus reducing the bias of a different manual classification. This dataset has been derived from the Qualitas Corpus dataset [59], and as such our study inherits the threats related to creation of the Qualitas Corpus dataset such as imprecision in the computations of the metrics for the source code elements.
618
In the context of RQ1, before comparing the distribution of the metrics in the dataset we applied a feature selection algorithm named Gain Ratio Feature Evaluation. Doing this, we did not compare all the metrics distributions, but we only limited the analysis to the relevant ones, i.e., approximatively one third of the total features. However, the missing extensive comparison does not represent an issue for our results. Indeed, the unselected features do not have an impact on the dependent variable: even in case of negligible differences between non-relevant metrics distributions of smelly and non-smelly instances, this would have not affected the performance of the experimented prediction models. As for the experimented prediction models, we exploited the implementation provided by the W EKA framework [66], which is widely considered as a reliable tool. Moreover, to faithfully replicate the empirical study in [32] we adopted the same classifiers in a best-fit configurations.
reference study is in the construction of the datasets used to train and validate the code smell classifiers. While in the reference study each dataset contained instances of one type of smells (besides non smelly components), in our study we built datasets containing instances of more than one type of smell. Another difference is in the distribution of smelly and non smelly instances in the datasets, which in our case are less balanced and contain more non smelly instances. As a result, we believe that the problem of detecting code smells using machine learning techniques is extremely relevant and with several facets remaining open. For example, more research is needed towards structuring datasets appropriately and jointly with the predictors to be used. As future work, we firstly plan to assess the impact of (i) dataset size, (ii) feature selection, and (iii) validation methodology on the results of our study. At the same, we aim at addressing these issues, thus defining new prediction models for code smell detection.
Threats to conclusion validity. Threats in this category impact the relation between treatment and outcome. A first discussion point is related to the validation methodology: in particular, we adopted the 10-fold cross validation. We are aware of the existence of other validation methodologies that might possibly provide a better interpretation of the real performance of code smell prediction models [88], however we choose a multiple 10-fold cross validation in order to directly compare our results with those achieved in the reference work. Future effort will be devoted to establish the impact of the validation technique on the results. We are also aware of other possible confounding effects like (i) data unbalance [89] and (ii) wrong data scaling [90]. However, we preferred to replicate the reference study using the same methodology as have been adopted by the authors of the reference study. As part of our future work, we plan to assess the impact of such preprocessing techniques. As for the evaluation metrics adopted to interpret the performance of the experimented models, we adopted the same metrics as in the reference study. We are aware that measures like AUC-ROC and MCC have been highly recommended by Hall et al. [85] since they are threshold-independent. Also in this case, we aimed at replicating as closer as possible the reference study to demonstrate its limitation, but we plan to investigate more in depth the performance of code smell prediction models.
R EFERENCES
Threats to external validity. With respect to the generalizability of the findings, we took into account one of the largest datasets publicly available, and containing 74 software projects coming from different application domains and with different characteristics. We are aware that our findings may and may not be directly applicable to industrial environments, however the replication of our study on closed-source and industrial projects is part of our future research agenda. VIII. C ONCLUSION AND F UTURE D IRECTIONS In this work, we presented a replicated study of the work in [32]. The main difference between our study and the
[1] M. M. Lehman, “Programs, life cycles, and laws of software evolution,” Proceedings of the IEEE, vol. 68, no. 9, pp. 1060–1076, 1980. [2] N. Brown, Y. Cai, Y. Guo, R. Kazman, M. Kim, P. Kruchten, E. Lim, A. MacCormack, R. L. Nord, I. Ozkaya, R. S. Sangwan, C. B. Seaman, K. J. Sullivan, and N. Zazworka, “Managing technical debt in software-reliant systems,” in Proceedings of the Workshop on Future of Software Engineering Research, at the 18th ACM SIGSOFT International Symposium on Foundations of Software Engineering (FSE). ACM, 2010, pp. 47–52. [3] P. Kruchten, R. L. Nord, and I. Ozkaya, “Technical debt: From metaphor to theory and practice,” IEEE Software, vol. 29, no. 6, pp. 18–21, 2012. [4] F. Shull, D. Falessi, C. Seaman, M. Diep, and L. Layman, Perspectives on the Future of Software Engineering. Springer, 2013, ch. Technical Debt: Showing the Way for Better Transfer of Empirical Results, pp. 179–190. [5] W. Cunningham, “The WyCash portfolio management system,” OOPS Messenger, vol. 4, no. 2, pp. 29–30, 1993. [6] M. Fowler, Refactoring: improving the design of existing code. AddisonWesley, 1999. [7] M. Tufano, F. Palomba, G. Bavota, R. Oliveto, M. Di Penta, A. De Lucia, and D. Poshyvanyk, “When and why your code starts to smell bad (and whether the smells go away),” IEEE Transactions on Software Engineering, 2017. [8] M. Tufano, F. Palomba, G. Bavota, M. Di Penta, R. Oliveto, A. De Lucia, and D. Poshyvanyk, “An empirical investigation into the nature of test smells,” in Proceedings of the 31st IEEE/ACM International Conference on Automated Software Engineering. ACM, 2016, pp. 4–15. [9] R. Arcoverde, A. Garcia, and E. Figueiredo, “Understanding the longevity of code smells: preliminary results of an explanatory survey,” in Proceedings of the International Workshop on Refactoring Tools. ACM, 2011, pp. 33–36. [10] A. Chatzigeorgiou and A. Manakos, “Investigating the evolution of bad smells in object-oriented code,” in Proceedings of the 2010 Seventh International Conference on the Quality of Information and Communications Technology, ser. QUATIC ’10. IEEE Computer Society, 2010, pp. 106–115. [11] R. Peters and A. Zaidman, “Evaluating the lifespan of code smells using software repository mining,” in European Conference on Software Maintenance and ReEngineering. IEEE, 2012, pp. 411–416. [12] S. Olbrich, D. S. Cruzes, V. Basili, and N. Zazworka, “The evolution and impact of code smells: A case study of two open source systems,” in Proceedings of the 2009 3rd International Symposium on Empirical Software Engineering and Measurement, ser. ESEM ’09, 2009, pp. 390– 400. [13] M. Abbes, F. Khomh, Y.-G. Gueheneuc, and G. Antoniol, “An empirical study of the impact of two antipatterns, blob and spaghetti code, on program comprehension,” in Proceedings of the 2011 15th European Conference on Software Maintenance and Reengineering, ser. CSMR ’11. IEEE Computer Society, 2011, pp. 181–190.
619
[14] A. Yamashita and L. Moonen, “Exploring the impact of inter-smell relations on software maintainability: An empirical study,” in International Conference on Software Engineering (ICSE). IEEE, 2013, pp. 682–691. [15] F. Khomh, M. Di Penta, Y.-G. Guéhéneuc, and G. Antoniol, “An exploratory study of the impact of antipatterns on class change- and fault-proneness,” Empirical Software Engineering, vol. 17, no. 3, pp. 243–275, 2012. [16] F. Palomba, G. Bavota, M. Di Penta, F. Fasano, R. Oliveto, and A. De Lucia, “On the diffuseness and the impact on maintainability of code smells: A large scale empirical study,” Empirical Software Engineering, p. to appear, 2017. [17] F. Palomba, G. Bavota, M. Di Penta, R. Oliveto, and A. De Lucia, “Do they really smell bad? a study on developers’ perception of bad code smells,” in Software maintenance and evolution (ICSME), 2014 IEEE international conference on. IEEE, 2014, pp. 101–110. [18] A. Yamashita and L. Moonen, “Do code smells reflect important maintainability aspects?” in International Conference on Software Maintenance (ICSM). IEEE, 2012, pp. 306–315. [19] D. Taibi, A. Janes, and V. Lenarduzzi, “How developers perceive smells in source code: A replicated study,” Information and Software Technology, vol. 92, pp. 223–235, 2017. [20] E. Fernandes, J. Oliveira, G. Vale, T. Paiva, and E. Figueiredo, “A reviewbased comparative study of bad smell detection tools,” in Proceedings of the 20th International Conference on Evaluation and Assessment in Software Engineering. ACM, 2016, p. 18. [21] F. Palomba, A. De Lucia, G. Bavota, and R. Oliveto, “Anti-pattern detection: Methods, challenges, and open issues.” Advances in Computers, vol. 95, pp. 201–238, 2015. [22] R. Marinescu, “Detection strategies: Metrics-based rules for detecting design flaws,” in 20th International Conference on Software Maintenance (ICSM 2004), 11-17 September 2004, Chicago, IL, USA. IEEE Computer Society, 2004, pp. 350–359. [23] N. Moha, Y.-G. Guéhéneuc, L. Duchien, and A.-F. L. Meur, “Decor: A method for the specification and detection of code and design smells,” IEEE Transactions on Software Engineering, vol. 36, no. 1, pp. 20–36, 2010. [24] N. Tsantalis and A. Chatzigeorgiou, “Identification of move method refactoring opportunities,” IEEE Transactions on Software Engineering, vol. 35, no. 3, pp. 347–367, 2009. [25] F. Palomba, G. Bavota, M. Di Penta, R. Oliveto, D. Poshyvanyk, and A. De Lucia, “Mining version histories for detecting code smells,” Software Engineering, IEEE Transactions on, vol. 41, no. 5, pp. 462–489, May 2015. [26] D. Sahin, M. Kessentini, S. Bechikh, and K. Deb, “Code-smell detection as a bilevel problem,” ACM Trans. Softw. Eng. Methodol., vol. 24, no. 1, pp. 6:1–6:44, Oct. 2014. [Online]. Available: http://doi.acm.org/10.1145/2675067 [27] W. Kessentini, M. Kessentini, H. Sahraoui, S. Bechikh, and A. Ouni, “A cooperative parallel search-based software engineering approach for code-smells detection,” Software Engineering, IEEE Transactions on, vol. 40, no. 9, pp. 841–861, Sept 2014. [28] M. Zhang, T. Hall, and N. Baddoo, “Code bad smells: A review of current knowledge,” J. Softw. Maint. Evol., vol. 23, no. 3, pp. 179–202, Apr. 2011. [29] F. A. Fontana, J. Dietrich, B. Walter, A. Yamashita, and M. Zanoni, “Antipattern and code smell false positives: Preliminary conceptualization and classification,” in Software Analysis, Evolution, and Reengineering (SANER), 2016 IEEE 23rd International Conference on, vol. 1. IEEE, 2016, pp. 609–613. [30] M. V. Mäntylä and C. Lassenius, “Subjective evaluation of software evolvability using code smells: An empirical study,” Empirical Software Engineering, vol. 11, no. 3, pp. 395–431, 2006. [31] F. A. Fontana, P. Braione, and M. Zanoni, “Automatic detection of bad smells in code: An experimental assessment.” Journal of Object Technology, vol. 11, no. 2, pp. 5–1, 2012. [32] F. Arcelli Fontana, M. V. Mäntylä, M. Zanoni, and A. Marino, “Comparing and experimenting machine learning techniques for code smell detection,” Empirical Software Engineering, vol. 21, no. 3, pp. 1143– 1191, 2016. [33] E. Alpaydin, Introduction to machine learning. MIT press, 2014. [34] F. Palomba, D. Di Nucci, A. Panichella, R. Oliveto, and A. De Lucia, “On the diffusion of test smells in automatically generated test code: An empirical study,” in Proceedings of the 9th International Workshop on
[35]
[36]
[37]
[38]
[39]
[40]
[41]
[42]
[43]
[44]
[45] [46]
[47]
[48]
[49]
[50]
[51]
[52]
[53]
620
Search-Based Software Testing, ser. SBST ’16. New York, NY, USA: ACM, 2016, pp. 5–14. F. Palomba, A. Panichella, A. Zaidman, R. Oliveto, and A. D. Lucia, “The scent of a smell: An extensive comparison between textual and structural smells,” IEEE Transactions on Software Engineering, vol. PP, no. 99, pp. 1–1, 2017. F. Palomba, A. Zaidman, R. Oliveto, and A. De Lucia, “An exploratory study on the relationship between changes and refactoring,” in Proceedings of the 25th International Conference on Program Comprehension. IEEE Press, 2017, pp. 176–185. D. Sjoberg, A. Yamashita, B. Anda, A. Mockus, and T. Dyba, “Quantifying the effect of code smells on maintenance effort,” Software Engineering, IEEE Transactions on, vol. 39, no. 8, pp. 1144–1156, Aug 2013. G. Bavota, A. De Lucia, M. Di Penta, R. Oliveto, and F. Palomba, “An experimental investigation on the innate relationship between quality and refactoring,” Journal of Systems and Software, vol. 107, no. Supplement C, pp. 1–14, 2015. [Online]. Available: http://www.sciencedirect.com/science/article/pii/S0164121215001053 F. Palomba and A. Zaidman, “Does refactoring of test smells induce fixing flaky tests?” in Software Maintenance and Evolution (ICSME), 2017 IEEE International Conference on. IEEE, 2017, pp. 1–12. F. Palomba, M. Zanoni, F. A. Fontana, A. D. Lucia, and R. Oliveto, “Toward a smell-aware bug prediction model,” IEEE Transactions on Software Engineering, vol. PP, no. 99, pp. 1–1, 2017. M. Lanza and R. Marinescu, Object-Oriented Metrics in Practice: Using Software Metrics to Characterize, Evaluate, and Improve the Design of Object-Oriented Systems. Springer, 2006. F. Palomba, A. Panichella, A. De Lucia, R. Oliveto, and A. Zaidman, “A textual-based technique for smell detection,” in Program Comprehension (ICPC), 2016 IEEE 24th International Conference on. IEEE, 2016, pp. 1–10. A. Ghannem, G. E. Boussaidi, and M. Kessentini, “On the use of design defect examples to detect model refactoring opportunities,” Software Quality Journal, vol. 24, no. 4, pp. 947–965, 2016. [Online]. Available: https://doi.org/10.1007/s11219-015-9271-9 F. Palomba, A. Panichella, A. Zaidman, R. Oliveto, and A. De Lucia, “Automatic test case generation: What if test code quality matters?” in Proceedings of the 25th International Symposium on Software Testing and Analysis. ACM, 2016, pp. 130–141. J. Kreimer, “Adaptive detection of design flaws,” Electronic Notes in Theoretical Computer Science, vol. 141, no. 4, pp. 117–136, 2005. L. Amorim, E. Costa, N. Antunes, B. Fonseca, and M. Ribeiro, “Experience report: Evaluating the effectiveness of decision trees for detecting code smells,” in Software Reliability Engineering (ISSRE), 2015 IEEE 26th International Symposium on. IEEE, 2015, pp. 261– 269. S. Vaucher, F. Khomh, N. Moha, and Y.-G. Guéhéneuc, “Tracking design smells: Lessons from a study of god classes,” in Reverse Engineering, 2009. WCRE’09. 16th Working Conference on. IEEE, 2009, pp. 145–154. A. Maiga, N. Ali, N. Bhattacharya, A. Sabane, Y.-G. Gueheneuc, and E. Aimeur, “Smurf: A svm-based incremental anti-pattern detection approach,” in Reverse engineering (WCRE), 2012 19th working conference on. IEEE, 2012, pp. 466–475. A. Maiga, N. Ali, N. Bhattacharya, A. Sabané, Y.-G. Guéhéneuc, G. Antoniol, and E. Aïmeur, “Support vector machines for anti-pattern detection,” in Automated Software Engineering (ASE), 2012 Proceedings of the 27th IEEE/ACM International Conference on. IEEE, 2012, pp. 278–281. F. Khomh, S. Vaucher, Y.-G. Guéhéneuc, and H. Sahraoui, “A bayesian approach for the detection of code and design smells,” in Quality Software, 2009. QSIC’09. 9th International Conference on. IEEE, 2009, pp. 305– 314. ——, “Bdtex: A gqm-based bayesian approach for the detection of antipatterns,” Journal of Systems and Software, vol. 84, no. 4, pp. 559– 572, 2011. S. Hassaine, F. Khomh, Y.-G. Guéhéneuc, and S. Hamel, “Ids: an immuneinspired approach for the detection of software design smells,” in Quality of Information and Communications Technology (QUATIC), 2010 Seventh International Conference on the. IEEE, 2010, pp. 343–348. R. Oliveto, F. Khomh, G. Antoniol, and Y.-G. Guéhéneuc, “Numerical signatures of antipatterns: An approach based on b-splines,” in Proceedings of the 14th Conference on Software Maintenance and Reengineering, R. Capilla, R. Ferenc, and J. C. Dueas, Eds. IEEE, March 2010.
[54] M. White, M. Tufano, C. Vendome, and D. Poshyvanyk, “Deep learning code fragments for code clone detection,” in Proceedings of the 31st IEEE/ACM International Conference on Automated Software Engineering. ACM, 2016, pp. 87–98. [55] X. Wang, Y. Dang, L. Zhang, D. Zhang, E. Lan, and H. Mei, “Can i clone this piece of code here?” in Proceedings of the 27th IEEE/ACM International Conference on Automated Software Engineering. ACM, 2012, pp. 170–179. [56] J. Yang, K. Hotta, Y. Higo, H. Igaki, and S. Kusumoto, “Classification model for code clones based on machine learning,” Empirical Software Engineering, vol. 20, no. 4, pp. 1095–1125, 2015. [57] F. A. Fontana, M. Zanoni, A. Marino, and M. V. Mantyla, “Code smell detection: Towards a machine learning-based approach,” in Software Maintenance (ICSM), 2013 29th IEEE International Conference on. IEEE, 2013, pp. 396–399. [58] F. A. Fontana and M. Zanoni, “Code smell severity classification using machine learning techniques,” Knowledge-Based Systems, vol. 128, pp. 43–58, 2017. [59] E. Tempero, C. Anslow, J. Dietrich, T. Han, J. Li, M. Lumpe, H. Melton, and J. Noble, “The qualitas corpus: A curated collection of java code for empirical studies,” in Proc. 17th Asia Pacific Software Eng. Conf. Sydney, Australia: IEEE, December 2010, pp. 336–345. [60] J. R. Quinlan, C4. 5: programs for machine learning. Elsevier, 2014. [61] W. W. Cohen, “Fast effective rule induction,” in Proceedings of the twelfth international conference on machine learning, 1995, pp. 115–123. [62] L. Breiman, “Random forests,” Machine Learning, vol. 45, no. 1, pp. 5–32, 2001. [63] G. H. John and P. Langley, “Estimating continuous distributions in bayesian classifiers,” in Eleventh Conference on Uncertainty in Artificial Intelligence. San Mateo: Morgan Kaufmann, 1995, pp. 338–345. [64] J. Platt, “Sequential minimal optimization: A fast algorithm for training support vector machines,” Microsoft Research, Tech. Rep. MSR-TR-9814, 1998. [65] C.-C. Chang and C.-J. Lin, “Libsvm - a library for support vector machines,” 2001, the Weka classifier works with version 2.82 of LIBSVM. [Online]. Available: http://www.csie.ntu.edu.tw/\~cjlin/libsvm/ [66] M. Hall, E. Frank, G. Holmes, B. Pfahringer, P. Reutemann, and I. H. Witten, “The weka data mining software: An update,” SIGKDD Explor. Newsl., vol. 11, no. 1, pp. 10–18, Nov. 2009. [Online]. Available: http://doi.acm.org/10.1145/1656274.1656278 [67] Y. Freund, R. E. Schapire et al., “Experiments with a new boosting algorithm,” in Icml, vol. 96, 1996, pp. 148–156. [68] L. Rokach, “Ensemble-based classifiers,” Artificial Intelligence Review, vol. 33, no. 1, pp. 1–39, 2010. [69] J. Bergstra and Y. Bengio, “Random search for hyper-parameter optimization,” Journal of Machine Learning Research, pp. 281–305, 2012. [70] C.-W. Hsu, C.-C. Chang, C.-J. Lin et al., “A practical guide to support vector classification,” Department of Computer Science, National Taiwan University, Tech. Rep., 7 2003. [71] M. Stone, “Cross-validatory choice and assessment of statistical predictions,” Journal of the royal statistical society. Series B (Methodological), pp. 111–147, 1974. [72] R. Baeza-Yates and B. Ribeiro-Neto, Modern Information Retrieval. Addison-Wesley, 1999. [73] R. M. O’Brien, “A caution regarding rules of thumb for variance inflation factors,” Quality & Quantity, vol. 41, no. 5, pp. 673–690, 2007. [79] F. Shull, J. C. Carver, S. Vegas, and N. J. Juzgado, “The role of replications in empirical software engineering,” Empirical Software Engineering, vol. 13, no. 2, pp. 211–218, 2008. [Online]. Available: https://doi.org/10.1007/s10664-008-9060-1
[74] J. R. Quinlan, “Induction of decision trees,” Mach. Learn., vol. 1, no. 1, pp. 81–106, Mar. 1986. [Online]. Available: http://dx.doi.org/10.1023/A:1022643204877 [75] W. J. Conover, Practical Nonparametric Statistics, 3rd ed. Wiley, 1998. [76] S. Holm, “A simple sequentially rejective Bonferroni test procedure,” Scandinavian Journal on Statistics, vol. 6, pp. 65–70, 1979. [77] R. J. Grissom and J. J. Kim, Effect sizes for research: A broad practical approach, 2nd ed. Lawrence Earlbaum Associates, 2005. [78] D. Di Nucci, F. Palomba, D. A. Tamburri, A. Serebrenik, and A. De Lucia, “Detecting Code Smells using Machine Learning Techniques: Are We There Yet?” https://figshare.com/articles/Detecting_Code_Smells_ using_Machine_Learning_Techniques_Are_We_There_Yet_/5786631, 2 2018, online appendix. [80] R. Jongeling, P. Sarkar, S. Datta, and A. Serebrenik, “On negative results when using sentiment analysis tools for software engineering research,” Empirical Software Engineering, vol. 22, no. 5, pp. 2543–2584, 2017. [Online]. Available: https://doi.org/10.1007/s10664-016-9493-x [81] J. Itkonen and M. V. Mäntylä, “Are test cases needed? replicated comparison between exploratory and test-case-based software testing,” Empirical Software Engineering, vol. 19, no. 2, pp. 303–342, Apr 2014. [Online]. Available: https://doi.org/10.1007/s10664-013-9266-8 [82] A. Swidan, A. Serebrenik, and F. Hermans, “How do scratch programmers name variables and procedures?” in 17th IEEE International Working Conference on Source Code Analysis and Manipulation, SCAM 2017, Shanghai, China, September 17-18, 2017. IEEE Computer Society, 2017, pp. 51–60. [Online]. Available: https://doi.org/10.1109/SCAM.2017.12 [83] A. Brooks, J. Daly, J. Miller, M. Roper, and M. Wood, “Replication of experimental results in software engineering,” International Software Engineering Research Network (ISERN), University of Strathclyde, Tech. Rep. RR/95/193 [EFoCS-17-95], 1995. [84] F. Q. B. da Silva, M. Suassuna, A. C. C. França, A. M. Grubb, T. B. Gouveia, C. V. F. Monteiro, and I. E. dos Santos, “Replication of empirical studies in software engineering research: a systematic mapping study,” Empirical Software Engineering, vol. 19, no. 3, pp. 501–557, Jun 2014. [Online]. Available: https://doi.org/10.1007/s10664-012-9227-7 [85] T. Hall, S. Beecham, D. Bowes, D. Gray, and S. Counsell, “Developing fault-prediction models: What the research can show industry,” IEEE Software, vol. 28, no. 6, pp. 96–99, 2011. [86] D. Bowes, T. Hall, and J. Petri´c, “Software defect prediction: do different classifiers find the same defects?” Software Quality Journal, pp. 1–28, 2017. [87] D. Di Nucci, F. Palomba, R. Oliveto, and A. De Lucia, “Dynamic selection of classifiers in bug prediction: An adaptive method,” IEEE Transactions on Emerging Topics in Computational Intelligence, vol. 1, no. 3, pp. 202–212, 2017. [88] C. Tantithamthavorn, S. McIntosh, A. E. Hassan, and K. Matsumoto, “An empirical comparison of model validation techniques for defect prediction models,” IEEE Transanctions on Software Engineering, vol. 43, no. 1, pp. 1–18, 2017. [89] N. V. Chawla, K. W. Bowyer, L. O. Hall, and W. P. Kegelmeyer, “Smote: Synthetic minority over-sampling technique,” Journal of Artificial Intelligence Research, vol. 16, no. 1, pp. 321–357, 2002. [90] A. E. Camargo Cruz and K. Ochimizu, “Towards logistic regression models for predicting fault-prone code across software projects,” in Proceedings of the 2009 3rd International Symposium on Empirical Software Engineering and Measurement. IEEE Computer Society, 2009, pp. 460–463.
621