imagery. Consequently, the detected results and the VHR satellite imagery are .... tures derived from a co-occurrence matrix based on the edge intensity, Ei.
Detection and Animation of Damage Using Very High-Resolution Satellite Data Following the 2003 Bam, Iran, Earthquake Tuong Thuy Vu,a… M.EERI, Masashi Matsuoka,a… M.EERI, and Fumio Yamazaki,b… M.EERI
The focus of this study was to thoroughly exploit the capability of very high-resolution 共VHR兲 satellite imagery such as Ikonos and QuickBird for disaster mitigation. An efficient automated methodology that detects damage was implemented to derive the rich information available from VHR satellite imagery. Consequently, the detected results and the VHR satellite imagery are attractively presented through a fly-over animation and visualization. The aim is to assist the field-based damage estimation and to strengthen public awareness. The available Ikonos and QuickBird data captured after the Bam, Iran, earthquake in December 2003 was employed to demonstrate the competence of the automated detection algorithm and fly-over animation/ visualization. These results are consistent with the field-based damage results. 关DOI: 10.1193/1.2101127兴 INTRODUCTION For decades, remote sensing techniques have been important in grasping damage information caused by earthquakes. Medium resolution satellite data like SPOT, Landsat 共Eguchi et al. 2003; Estrada et al. 2001兲 or ERS 共Matsuoka and Yamazaki 2004兲 is mainly used to identify the extent of the damage. Damaged buildings can be detected using aerial photographs 共Mitomi et al. 2000兲. Recently, very high-resolution 共VHR兲 imagery from commercial satellites such as Ikonos and QuickBird, which can be rapidly acquired, is becoming more powerful and is providing information on natural and/or man-made disasters in the early stages of their unfolding. Both visual interpretation and automated analysis are currently used to detect damaged buildings, but the latter has yet to be reliably implemented. The conventional method for detecting damage caused by an earthquake is to compare pre- and post-event images. This approach has also been developed for VHR data. For example, a new overlay method between pre- and post-event images was based on artificial neural networks 共Kosugi et al. 2000兲. However, it is unrealistic to obtain images of the stricken areas before a disaster, and archived data with clear and suitable images is limited. Therefore, this paper addresses an automated detection method that uses only post-event images so that scientists and researchers can take advantage of the ability of helicopters and airplanes to fly over the damage soon
a兲
Earthquake Disaster Mitigation Research Center, 1-5-2, Kaigandori, Wakinohama, Kobe, 651-0073, Japan Department of Urban Environment Systems, Chiba University, 1-33 Yayoi-cho, Inage-ku, Chiba 263-8522, Japan
b兲
S319
Earthquake Spectra, Volume 21, No. S1, pages S319–S327, December 2005; © 2005, Earthquake Engineering Research Institute
S320
T. T. VU, M. MATSUOKA, AND F.YAMAZAKI
after it occurs 共Aoki et al. 2001; Mitomi et al. 2001兲. This study follows previous work, and investigates the suitability of this edge-based technique 共Mitomi et al. 2002a兲, which was developed by examining the relationship between aerial images and detailed damage survey data obtained after the 1995 Kobe earthquake on VHR satellite imagery. An automated detection method for VHR satellite imagery is subsequently developed. While studying the processing techniques for remotely sensed data, it was realized that there is a gap between analyzed results and the public’s understanding. Virtual reality can help fill this gap and strengthen public awareness in disaster mitigation. Virtual reality using remotely sensed data is widely employed to assist regional and local planning 共Zhang et al. 2002兲, to make digital cultural heritage 共Gruen and Wang 2002兲, and numerous other applications. This study developed a technique that employs the Digital Terrain Model 共DTM兲, the building inventory database, and VHR satellite images for three-dimensional visualization and fly-over animation, which can assist on-site surveying and further damage assessment. After the Bam, Iran, earthquake of 26 December 2003, Ikonos and QuickBird observed the city on 27 December 2003 and 03 January 2004, respectively. QuickBird also captured the same area about eight months prior to the earthquake. These images were employed to demonstrate the competence of the project’s methods. Below is presented a description about the methodology for automated damage detection using highresolution imagery and its application for VHR satellite imagery using data from the Bam, Iran, earthquake. Also described is how the technique for making animation and visualization was applied to the Bam earthquake. METHOD OF AUTOMATED DAMAGE DETECTION The characteristics of collapsed buildings were examined by processing aerial television images taken after the 1995 Kobe, Japan, the 1999 Kocaeli, Turkey, the 1999 ChiChi, Taiwan, and the 2001 Gujarat, India earthquakes 共Mitomi et al. 2000兲. Areas with building damage were defined by color indices and edge intensities in original RGB images. However, it was difficult to apply the same threshold values used for the color indices to other images due to the differences in factors such as the amount of sunlight and local environments 共Mitomi et al. 2000兲. Upon further examination, an area-independent technique was proposed to estimate the areas with damaged buildings using edge information in local windows—such as edge variance and edge direction, and statistical textures derived from the co-occurrence matrix of the edge intensity. Since the edge information can be derived from a gray scale image and brightness, the proposed method can be applied to the VHR satellite imagery with a spatial resolution of one-meter or less. Edge intensity 共Ei兲, its variance 共Ev兲, and the ratio of the predominant direction of the edge intensity 共Ed兲 were derived from a Prewitt filter and used to detect density changes among neighboring pixels. The Prewitt filter has 3 ⫻ 3 matrices and can calculate edge intensities in eight directions 共Takagi and Shimoda, 1991兲. This filter was enlarged to a 7 ⫻ 7 matrix 共Aoki et al. 2001兲 because the densities of the neighboring pixels gently slope in high-resolution images. Ei was obtained from the maximum value in the templates for eight directions on the edges. An edge direction was defined as the
DETECTION AND ANIMATION OF DAMAGE USING VERY HIGH-RESOLUTION SATELLITE DATA
S321
Table 1. Threshold values for indices Index
Threshold values
Ev: edge variance Ed: edge direction Ta: angular second moment Te: entropy
2.0-6.8共⫻ 105兲 0.3-0.6 0.75-6.6共⫻ 10−2兲 3.5-4.2
direction of Ei, such as 0-180, 45-225, 90-270, and 135-315 degrees. Using the Ei value, Ev was calculated as a variance in a 7 ⫻ 7 pixel window. The ratio of the predominant direction of the edge elements in a 7 ⫻ 7 pixel window, Ed, was also calculated. Statistical textures of the edge intensity were calculated from the occurrence probability value. The occurrence probability P共k , l兲 is the probability that a pixel value l appears in a relative position ␦ = 共r , 兲 from a reference pixel whose value is k, where r and are relative distance and direction from the reference pixel, respectively. The occurrence probability P共k , l兲 was calculated for all combinations of pixel values 共k , l兲 against a constant ␦. This matrix is called a co-occurrence matrix 共Takagi and Shimoda 1991兲. In this study, collapsed building characteristics were investigated with edge textures derived from a co-occurrence matrix based on the edge intensity, Ei. The angular second moment 共Ta兲 and entropy 共Te兲 are represented in Equations 1 and 2 and were calculated for the condition of r = 1, which indicates neighboring pixels around a reference pixel, and four edge directions. The maximum value for the directions was defined as a representative value of the texture. In addition, a 7 ⫻ 7 pixel area was used as the window size for the texture analysis. m−1 m−1
Ta =
兺 兺 兵P共k,l兲其2
共1兲
k=0 l=0 m−1 m−1
Te = −
兺 兺 P共k,l兲log兵P共k,l兲其
共2兲
k=0 l=0
Both textures represent uniformity of the edge structure in the input panchromatic image, but have opposite trends. If P共k , l兲 is locally large in the matrix, which represents uniform texture, Ta and Te have large and small values, respectively. Collapsed buildings should show the strongest trends of non-uniformity, i.e., lowest range of Ta and highest range of Te. Table 1 shows the threshold values for the above-mentioned parameters 共Mitomi et al. 2002b兲. Pixels within the range of all threshold values corresponded to damaged buildings. This pixel-based detection also generated a vast amount of small meaningless spots that corresponded to collapsed buildings. Similar to a previous study 共Aoki et al. 2001兲, the local density of detected pixels 共Rpx兲 was employed to remove those small spots. Rpx is defined as the ratio of the detected pixels by the four threshold values ver-
S322
T. T. VU, M. MATSUOKA, AND F.YAMAZAKI
Figure 1. Results of detected areas with damaged buildings.
sus the number of pixels in a local window that approximated one building size. The local window was proportional to the resolution of the ground surface. A window of 31⫻ 31 pixels was used to calculate Rpx. DETECTING AREAS WITH COLLAPSED BUILDINGS Using this method, which is based on aerial television images, a gray scale 共brightness兲 image was prepared from the original RGB image. Ikonos and QuickBird can capture panchromatic images with very high-resolution, about 1 meter and 0.6 meter, respectively. However, both panchromatic sensors cover the visible and the near-infrared region. Therefore, high-resolution brightness images were derived from pan-sharpened color images, which were created by combining the panchromatic band and multispectral bands. To create natural color images, linear contrast stretching was used, 2% for the minimum and 98% for the maximum, and allocated band 1, 2, and 3 corresponded to blue, green, and red colors, respectively. Figures 1a and 1b show the results of the damage detection method applied to the Ikonos and QuickBird images of central Bam, respectively. Vegetated areas were removed by thresholding the NDVI 共Normalized Difference Vegetation Index兲. According to the reports of visual damage inspection from QuickBird images 共Yamazaki et al. 2005兲 and a reconnaissance field survey 共Hisada et al. 2004兲, more than 80% of buildings in southern Arg-e-Bam were classified as Grade 4 共very heavy damage兲 or 5 共destroyed兲 on the European Macroseismic Scale 共EMS 1998兲. The distribution of detected damage from Ikonos was consistent with these results. However, less damage information was detected from the QuickBird image 共Figure 1b兲. Spatial resolution and color distribution might be factors affecting the results.
DETECTION AND ANIMATION OF DAMAGE USING VERY HIGH-RESOLUTION SATELLITE DATA
S323
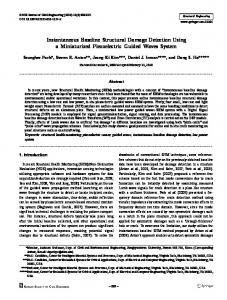
Figure 2. Distribution of detected damage areas using color-modified QuickBird image.
A re-sampled, one-meter resolution, QuickBird image provided a similar result as the original QuickBird image. Hence, spatial resolution does not affect the extraction results. Also calculated were the rates of DNs of green and blue to that of red in pansharpened images to examine the color contribution. The average rates of green and blue to red values were 0.97 and 0.95 for Ikonos, 1.03 and 1.14 for QuickBird, which implies that the QuickBird image is predominantly cyan. In fact, a QuickBird image does not look natural, but has a blue tint. Therefore, the color of the QuickBird image was modified by histogram matching with the Ikonos image. Figure 2 shows the results of damage detection using the color-modified QuickBird image and the damage distribution corresponded to the results of the aerial and field investigations. In addition, the detected results from the color-modified and re-sampled QuickBird image are similar to the results from the Ikonos image. In summary, the detection is mainly influenced by the color distribution among red, green, and blue channels. ANIMATION AND VISUALIZATION OF BAM EARTHQUAKE Briefly, the three-dimensional visualization and animation are based on overlaying VHR satellite images on the digital surface model 共DSM兲. Focusing on buildings in urban areas, DSM is generated from the digital terrain model 共DTM兲 and the building inventory database. Other features such as the trees, parks, and streets are not used to generate the DSM. For the Bam earthquake, DTM and building database were unavailable. Without DTM, it was assumed that the area was flat. Building footprints were digitized from the pre-event scene to generate the building database. Animation and visualization were processed as follows. For the preparation, the relative heights of buildings were estimated based on the extracted shadows from the pre-event scene and were registered into building database. As observed in the QuickBird scenes of Bam, most houses are low and do not differ much in height. Hence, the thickness of the extracted shadow was classified into 4 classes to
S324
T. T. VU, M. MATSUOKA, AND F.YAMAZAKI
Figure 3. The required parameters of a sensor.
estimate building heights. The extraction, classification, and registration of height into database were automatic. However, a visual inspection of the results was necessary to correct the strange appearance of some of the buildings due to the automated process being based solely on the extracted shadows. The pre-event acquired 30 September 2003 and the post-event scene acquired on 03 January 2004 were co-registered into the same reference with the DTM. Each building was extruded by its height registered in the building inventory database and became a 3-dimensional feature. The DSM was generated and converted into a grid format. The cell size of grid was the same as spatial resolution of satellite imagery. Subsequently, both pre-event and post-event images were overlaid on a grid-based DSM after being co-registered with the DTM. A linear or cubic convolution resampling method was used to paint texture on the walls of buildings. Exaggerated parameters can also be changed to create a better visualization scene. Finally, the animations for both pre-event and post-event QuickBird scenes were produced. The look angle, flight orbit, flight altitude, and flight speed are required param-
Figure 4. Illustration of determined flight orbit and time frames.
DETECTION AND ANIMATION OF DAMAGE USING VERY HIGH-RESOLUTION SATELLITE DATA
S325
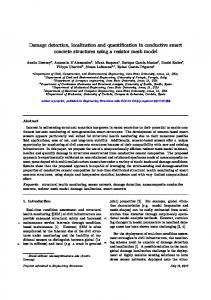
Figure 5. A captured scene of simultaneous fly-over animation.
eters for the animation 共Figure 3兲. For Bam, the horizontal, vertical look angles, and flight altitude were 5 degrees, −45 degrees, and 500 meters, respectively. A time frame was decided upon to catch the scenes. The time-series scenes were then arranged and merged for animation 共Figure 4兲. The shorter the time frame intervals, the smoother the animation is. However, short intervals increase the size of animation files and require more memory to process. Viewed in an oblique geometry, damaged buildings are clearly seen from these visualized scenes. The movies that are taken from simulated helicopter or airborne flights are easier for the public to understand and are more informative than other viewpoints. The fly-over animation can also project two cameras on the same surveying flight, which can show the scene both pre- and post-damage simultaneously 共Figure 5兲. The damage detection result was overlaid on the post-scene in this animation. CONCLUSIONS An automated damage detection algorithm was developed to detect damaged buildings from VHR satellite data. This method was used to analyze the 2003 Bam earthquake, and demonstrated the capability of the algorithm. It was found that the color distribution of the RGB channels is critical and that the color distribution depends on the characteristic of each sensor. By modifying this distribution, the method was successfully implemented with VHR satellite imagery. A proposed scheme for fly-over animation and its amazing scenes from this 2003 Bam earthquake was initially aimed to assist the field-based damage estimation team. This fly-over scheme can also be used in disaster mitigation for the public. If VHR data is acquired within a reasonable time after a catastrophe, damage estimation in an early stage is possible since the algorithm is a fully automated process. ACKNOWLEDGMENTS QuickBird and Ikonos are owned by DigitalGlobe Co., Ltd. and Space Imaging, respectively. QuickBird images used in this study were licensed and provided by Earth-
S326
T. T. VU, M. MATSUOKA, AND F.YAMAZAKI
quake Engineering Research Institute 共EERI兲, Oakland California, USA. Ikonos image was used in collaboration with Remote Sensing Technology Center of Japan 共RESTEC兲. REFERENCES1 Aoki, H., Matsuoka, M., and Yamazaki, F., 2001. Automated detection of damaged buildings due to earthquakes using aerial HDTV and photographs, Journal of the Japan Society of Photogrammetry and Remote Sensing 40 共4兲, 27-36 共in Japanese兲. Eguchi, R. T., Huyck, C. K., Adams, B. J., Mansouri, B., Houshmand, B., and Shinozuka, M., 2003. Earthquake damage detection algorithms using remotely sensed data—Application to the August 17, 1999 Marmara, Turkey earthquake, Proceedings, Seventh EERI U.S./Japan Workshop on Urban Earthquake Hazard Reduction, Maui, Hawaii. Estrada, M., Kohiyama, M., Matsuoka, M., and Yamazaki, F., 2001. Detection of damage due to the 2001 El Salvadore earthquake using Landsat images, Proceedings, Twenty-Second Asian Conference on Remote Sensing, CD-ROM. Gruen, A., and Wang, X., 2002. Integration of landscape and city modeling: The pre-Hispanic site Xochicalco, International Archives of Photogrammetry, Remote Sensing and Spatial Information Science, XXX IV Part No.: 5/W3, ISSN: 1682-1777, February. Hisada, Y., Shibayama, A., and Ghayamghamian, M. R., 2004. Building damage and seismic intensity in Bam city from the 2003 Iran, Bam, earthquake, Bulletin of Earthquake Research Institute, The University of Tokyo 共paper in review兲. Kosugi, Y., Plamen, T., Fukunishi, M., Kakumoto, S., and Doihara, T., 2000. An adaptive nonlinear mapping technique for extracting geographical changes, Proceedings, GIS2000, CDROM. Matsuoka, M., and Yamazaki, F., 2004. Use of satellite SAR intensity imagery for detecting building areas damaged due to earthquakes, Earthquake Spectra 20 共3兲, 975-994. Mitomi, H., Matsuoka, M., and Yamazaki, F., 2002a. Application of automated damage detection of buildings due to earthquakes by panchromatic television images, Proceedings, Seventh U.S. National Conference on Earthquake Engineering, CD-ROM. Mitomi, H., Matsuoka, M., and Yamazaki, F., 2002b. A study on a general automated detection method of building damage areas using aerial television images, Journal of Structural Mechanics and Earthquake Engineering, Japan Society of Civil Engineers 710 共I-60兲, 413-425 共in Japanese兲. Mitomi, H., Saita, J., Matsuoka, M., and Yamazaki, F., 2001. Automated damage detection of buildings from aerial television images of the 2001 Gujarat, India earthquake, Proceedings, IEEE 2001 International Geoscience and Remote Sensing Symposium, CD-ROM. Mitomi, H., Yamazaki, F., and Matsuoka, M., 2000. Automated detection of building damage due to recent earthquakes using aerial television images, Proceedings, The Twenty-First Asian Conference on Remote Sensing, pp.401-406. 1
Publication of this special issue on the Bam, Iran, earthquake was supported by the Learning from Earthquakes Program of the Earthquake Engineering Research Institute, with funding from the National Science Foundation under grant CMS-0131895. Any opinions, findings, conclusions, or recommendations expressed herein are the authors’ and do not necessarily reflect the views of the National Science Foundation, the Earthquake Engineering Research Institute, or the authors’ organizations.
DETECTION AND ANIMATION OF DAMAGE USING VERY HIGH-RESOLUTION SATELLITE DATA
S327
Takagi, M., and Shimoda, H., 1991. Handbook of Image Analysis, University of Tokyo Press 共in Japanese兲. Yamazaki, F., Yano, Y., and Matsuoka, M., 2005. Visual damage interpretation of buildings in Bam city using QuickBird images, Special Issue 1, 2003 Bam, Iran, Earthquake Reconnaissance Report. Edited by F. Naeim, et al. Earthquake Spectra 21 共S1兲 共Section V in this issue兲, December. Zhang, L., Feiner, J., Louy, O., Gruen, A., and Schmid, W. A., 2002. Photo-textured digital terrain models as a basis for regional and local planning, International Archives of Photogrammetry, Remote Sensing and Spatial Information Science, XXX IV Part No.: 5/W3, ISSN: 1682-1777, February.
共Received 23 November 2004; accepted 7 June 2005兲