International Journal of Scientific & Engineering Research, Volume 6, Issue 3, March-2015 ISSN 2229-5518
1397
Detection and segmentation of lung disease using Law Mask with Watershed on X-ray images Marwah Abdulmajeed Azeez, Alyaa Hussein Ali, Alaa Noori Mazhir, Sabah Noori Mazhir
Abstract— The use of an automatic system in the analysis of the x-ray images is very important for the radiologists. Many methods have been developed for detecting lung diseases, and many imaging techniques used for this purpose like computerized tomography (CT) and chest radiography (xray). The chest x-ray is considered in our search to detecting the lung tumors. Our system has implemented x-ray images as a test samples. The objective of this paper is to support efficient method to detecting lung diseases and extracting the statistical features. The low mask which is a statistical texture analysis with five matrixes are used with the color segmentation method (watershed) to extracted the tumor and analyzing its texture. The proposed technique shows the methodology has high enhancement to the image contrast that gives extra aid to radiologist to detect and classify the lung tumor.
Index Terms— Disease of lung, X-ray image, Segmentation, Law Mask, Watershed. ——————————
——————————
L
1 INTRODUCTION ungs are located on the lateral sides of the thoracic cavity and separated from each other by the mediastinum. As the left lung is physically smaller than the right lung This is because the right and left lungs exhibit some obvious structural differences since the heart projects into the left side of the thoracic cavit, the right lung is subdivided into the superior, middle, and inferior lobes by two fissures. The left lung has a medial surface indentation, called the cardiac impression that is formed by the heart [1]. Lung disease refers to disorders that affect the lungs, the organs that allow us to breathe. Breathing problems which are caused by lung disease may prevent the body from getting enough oxygen [2]. Lung cancer is a highly aggressive and frequently fatal malignancy that originates in the epithelium of the respiratory system. Smoking causes about 85% of all lung cancers. Metastasis, the spread of cancerous cells to other tissues, occurs early in the course of the disease, making a surgical cure unlikely for most patients [1]. X-ray imaging is the fastest, most common, and least expensive diagnostic. Production of digital Xrays from pictorial radiographs is becoming a common practice to maximize information and reduce the number of rejected X-rays [3]. X-rays are among the oldest sources of electromagnetic (EM) radiation used for imaging. The best known use of X-rays is medical diagnostics [4].
IJSER
————————————————
Marwah Abdulmajeed Azeez Msc.student in Physic Departemet College of Science for women,Baghdad Dr.Alyaa H.Ali BSc.1996 in physics, Msc. in1999. Phd in2004 .Asst.Prof in Digital image processing and remote Sensing ,Baghda dUniversity College of Science For Women E-mail:
[email protected] Alaa N.Mazher BSc. 2000 in Computer Science, Msc. 2003. Asst.Prof in technology Computer Science , university of Technology E-mail: Laa
[email protected] Dr.Sabah N.Mazhir, BSc.1990 in physics, Msc. in1997. Phd in 2004 Asst.Prof in Physics ,Baghda dUniversity College of Science For Women E-mail:
[email protected]
2 METHODOLOGY
Analysis of tissue is a process which is very successful in the diagnosis of medical images for abnormal lung tissue, for this reason the need for the help of x-rays and digital image processing is important, which is the way of modern diagnosis defect.
2.1 Image segmentation Image segmentation is the most difficult task in image processing. Segmentation refers to the grouping of image elements that exhibit “similar” characteristics, i.e. subdividing an image into its constituent regions or objects [5]. The thresholding process is the simplest way to segmented the x-ray image.
2.2 Law's Masks Texture Feature Extraction Feature extraction is the process of obtaining higher-level information of an image such as color, shape and texture. Texture is a key component of human visual perception The Laws method uses filter masks to extract secondary features from natural micro-structure characteristics of the image (level, edge, spot and ripple) which can then be used for segmentation or classification. Laws developed five labeled vectors which could be combined to form two dimensional convolution kernels. When convolved with a textured image these masks extract individual structural. The five Low are [6]: 1-L5=[1 4 6 4 1] level (1) 2-E5=[ -1 -2 0 2 1] edge (2) 3-S5=[-1 0 2 0 1] wave (3) 4-R5=[1 -4 6 -4 1] ripple (4) 5-M(i,j)=L5*L5(j) (5) 6- M1(i,j)=E5(i)*E5(j) (6) 7- M2(i,j)= S5(i)*S5(j) (7) 9-M3(i,j)=R5(i)*R5(j) (8) In which (i,j) are the row and column of the matrix resulted from the convolution of each vector with it self
IJSER © 2015 http://www.ijser.org
1398
International Journal of Scientific & Engineering Research Volume 6, Issue 3, March-2015 ISSN 2229-5518
3 LAW MASK WITH WATERSHED
1 4 M= 6
4 16 24
6 24 36
4 16 24
1 4 6
4 1
16 4
24 6
16 4
4 1
1 2 0
2 4 0
0 0 0
2 4 0
1 2 0 ….
4 2
2 1
M1=
2 1
M2 =
4 0 2 0
1 0 2
0 0 0
2 0 4
0 0 0
1 0 2
0 1
0 0
0 2
0 0
0 1
….
(9a)
….
(9b)
total
1 0 .5 2 .5 0 .5 0
0 .5 9 0 7 0 .5
2 .5 0 19 0 3 .5
IJSER
24 16 6 4
……
total = (M + M1 + M2 + M3) /4
1 4 6 4 1 4 16 24 16 4 M3= 6 24 36 24 0 …. 4 16 1 4
(9)
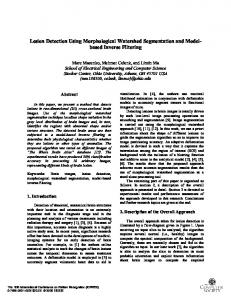
The watershed which is a color segmentation process is used to segment the images including the open and close process. Using these segmentation watershed with the five matrix which are (level, edge, wave, and ripple). Convolve with each other to produce a five matrix. Equation (9,9a,9b,9c) each matrix contains twenty five elements, calculating the average of these matrix one matrix has been produce. Convolve this matrix with the test images. The resulted images are then segmented using the watershed segmentation as shown in figure (1). Then calculated the statistical features which are Contrast, Entropy, Mean, Energy, Mean square, Correlation and Standard deviation.
0 .5 7 0 9 0 .5
0 0 .5 2 0 .5 1
(10)
(11)
(9c)
4 1
2.3 Watershed transformation Watershed transform is usually adopted for image segmentation in the area of image processing and image analysis, because it always generates closed contours for each region in the original image [7]. Watershed transform is a useful tool in image segmentation. In which watershed lines can effectively divide individual catchment basins in a gradient image and generate closed contours for each region in the original image. The methodologies of image segmentation which based upon watershed transform have been developed. Numerous researches have been conducted for obtaining watershed lines [5]. 2.4 Opening and Closing In general the opening process deals with the edges of the object; it makes them smoother by eliminating the thin edges. Opposed to opening, the closing process it also deals with the edges of the object, they merge the narrow lines and breaks the thin lines, they eliminates small gabs, and fills the holes in the contour [4].
2.5 Thresholding Thresholding is one of the simplest segmentation methods. It can extract the object from the background by grouping the intensity according to the threshold value [8].
After a series of particular convolution with selected Laws' masks, the outputs are passed to texture energy measurement filters for the analysis of the texture property of each pixel. Neighborhood based on three statistical descriptors (mean, absolute mean and standard deviation). These descriptors are computed as follows:
Mean= neighbouring pixels/ w …… (12) Absolutemea= abs(neighbouring pixels)/ w… (13) Standard deviation (neighbouring pixels mean) / w.. (14)
Where W is the window size. The operation will lead to the creation of three images corresponding to each statistical descriptor. After the windowing operation, all the obtained images are normalized in order to be presented an image. Subsequently, for each normalized image we compute three statistics; absolute mean (ABSM), mean square (MS) and entropy as follows: | ( . )| ABSM= ………. (15)
MS=
Entropy=
( . )
( . )
……….
ln ( . )) ……
(16)
(17)
Where I(x,y) is the pixel value, and M and N are image dimensions[6]. Contrast It measures the local variations in the gray-level .It returns a
IJSER © 2015 http://www.ijser.org
1399
International Journal of Scientific & Engineering Research Volume 6, Issue 3, March-2015 ISSN 2229-5518
measure of the intensity contrast between a pixel and its neighbor over the whole image. Contrast is 0 for a constant image [9]. To calculate the contrast the following steps were followed 1. Within a window (W) surrounding the pixel (x,y), determine the mean (mH) of the pixels whose gray levels are greater than the, gray value of pixel (x,y), also determine the mean (mL) of the pixels whose gray levels are less than the pixel(x,y). 2. The contrast of the image at point x,y is obtained by[10]: ( , )= ( ) ( ) … … .. (18) Correlation
It measures the joint probability occurrence of the specified pixel pairs. Returns a measure of how correlated a pixel is to its neighbor over the whole image. Range is from 1 to -1. Correlation is 1 or -1 for a perfectly positively or negatively correlated image. Correlation is null for a constant image. It is given by formula [9] [11].
R(x,y)=
( , ) ( + ,
+ )/
( , )
(19)
For this reason, correlation function R, difference image Id in certain direction d=( ) I(u,v)=sub image d( , ) = ( , ( , )
n1, n2=window size I(x,y)= Original Image R(x,y)= The resulted image
Fig 1 Shows the result of low mask with the watershed
IJSER
Table (1) gives the values for the statistical features which have been obtained from convolving the images with low mask matrix shown in equation (11). The watershed segmentation process has been applied to the resulting matrix which colored the parts of the lung with different color according to their texture. So, the tumor appear with color differed from the lung part. This method can also, separate the tumor from the lung tissue by using the color matrix.
IJSER © 2015 http://www.ijser.org
International Journal of Scientific & Engineering Research Volume 6, Issue 3, March-2015
1400
ISSN 2229-5518
4
[11] D. Radu, and D. MATEI, and M. STEFAN, and P. DAN,” Medical
CONCLUSION From our result the search contain different type of dieses each one gives different statistical features image No.1 ( Echinococcosis) has high contrast , high entropy and energy, the stander deviation, mean and correlation have low value. Since the energy gives information about the number of gray level value in the image this means our texture is infected. Image No.4 (Cancer) has low contras, low entropy and mean square. its energy is high compare with other cases also mean and correlation these gives indication that each dieses behave in different way because each feature give indication about the behavior of the texture.
images classification for skin cancer diagnosis based on combined texture and fractal analysis ”. WSEAS TRANSACTIONS on BIOLOGY and BIOMEDICINE, ISSN: 1109-9518 Issue 3, Volume 7, July 2010. [12] Loay.A. Georg, Laith A. Al-Ani and Alyaa H. Ali June2014 "Cloud Height Classification Using Texture Analysis of Meteosat Image:. Journal of Baghdad For Science. Vol11,No.2,PP652-659
REFERENCES [1] M. Mckinley, V. D. O’Loughlin, “Human Anatomy’’, Glendale com[2]
[3]
[4] [5]
[6] [7]
[8]
[9] [10]
munity college, Indiana university, ISBN 0_07_249585_5, Qm23.2.M38 pp: 773-784, 2006. R. M. Castellan, M.D., R. E. Manrow, T. Richards, M.D. and J. J. Smith, M.S.N, R.N., A.O.C.N., M. White, Sc.D., “Lung Disease”, M.P.H. Division of Respiratory Disease Studies National Institute for Occupational Safety and Health1, Ph.D. Associate Director, Office of Cancer Content Management National Cancer Institute2, Medical Officer Centers for Disease Control and Prevention3, Nurse Consultant National Cancer Institute4, Branch Chief, Epidemiology and Applied Research Division of Cancer Prevention and Control Centers for Disease Control and Prevention5, pp:1;November 29,2010. Dr. K. I. Jassam, and professor, M. Carr, “REMOVAL OF RANDOM NOISE FROM CONVENTIONAL DIGITAL X-RAY IMAGES”, Researcher, the Institute of Islamic Medicine for Education and Research Panama City, FL. , Department of Surveying Engineering University of Maine Orono, ME. USA Commission No: VII, PP: 113, 1992. R. C. Gonzalez, University of Tennessee, R.E. Woods Med Data Interactive, “Digital Image Processing”, Third Edition, New Jersey 07458, 2008. S. Beucher, “The Watershed Transform Applied to Image Segmentation”, Proceedings of the Pfefferkorn Conference on Signal and Image Processing in Microscopy and Microanalysis, pp. 299–314, September 1991. A. E heba, "statistical Analysis of laws mask texture features for cancer and water lunng detection" ,IJCSI international journal of computer science issues, vol.10, issue 6, No 2,November 2013. B. Manisha, and R.K. Krishna and V. E. Pise.. “Image Segmentation by Improved Watershed Transformation in Programming Environment MATLAB”. International Journal of Computer Science & Communication Vol. 1, No. 2, July-December 2010, pp. 171-174. S. Rujikietgumjorn, “SEGMENTATION METHODS FOR MULTIPLE BODY PARTS”, PROJECT IN LIEU OF THESIS Presented for the, Master of Science Degree, The University of Tennessee, Knoxville, pp:8 ,July 31, 2008. S. L. Nitin, and R.T. Manoj,”A computer based feature extraction of lung Nodule in chest x-ray image”. International journal of bioscience. Biochemistry and bioinformatics, vol.3, No.6, November 2013. H.A. Alyaa, “Clouds height classification using texture analysis of meteosat images”. A Thesis, Al-nahrain university, Physics 2004.
IJSER
IJSER © 2015 http://www.ijser.org