International Journal of Computer Applications (0975 â 8887) ... Artificial Neural Networks (ANN), Feed forward back ... Network than Support Vector Machine.
International Journal of Computer Applications (0975 – 8887) Volume 133 – No.14, January 2016
Detection of Cardiomyopathy using Support Vector Machine and Artificial Neural Network Rabiya Begum
Manza Ramesh R.
M.phil Student, Dept of CS & IT , Dr.BAMU Aurangabad.
Assistant Professor, Dept of CS & IT Dr.BAMU Aurangabad.
ABSTRACT With the growing needs of Medical diagnosis, recently several software tools and various algorithms have been proposed by the researchers for developing effective medical Expert systems. Diagnosing of heart disease like Cardiomyopathy is one of the important issue Cardiomyopathy refers to diseases of the heart muscle. These diseases enlarge the heart muscle or make it thicker and more rigid than normal. As cardiomyopathy worsens, the heart becomes weaker. It's less able to pump blood through the body and maintain a normal electrical rhythm. This can lead to heart failure or irregular heartbeats called arrhythmias which can be detected by analyzing ECG Signals. This paper describes aiming to develop an automated system for diagnosing of Cardiomyopathy using support vector machine and feed forward backpropagation technique. ECG data collected from Online PTB diagnostic ECG database ,preprocessing is applied for noise Cancellation and baseline correction then four time based features have been extracted and finally classification is been performed using Support vector machines and Artificial neural Networks. Results Shows that Feed forward backpropagation giving 98% accuracy for Healthy and 85% for Cardiomyopathy and Support Vector Machines gives 94.11 % accuracy for Healthy and 60 % accuracy for cardiomyopathy.
using ECG investigation .ECG refers to Electrocardiogram a noninvasive method in medical diagnosis it is the process of recording the electrical activity of the heart over a period of time using electrodes placed on a patient's body[3][4]. These electrodes detect the tiny electrical changes on the skin that arise from the heart muscle depolarizing during each heartbeat .In a conventional 12 lead ECG, ten electrodes are placed on the patient's limbs and on the surface of the chest. The overall magnitude of the heart's electrical potential is then measured from twelve different angles ("leads") and is recorded over a period of time (usually 10 seconds). In this way, the overall magnitude and direction of the heart's electrical depolarization is captured at each moment throughout the cardiac cycle. A typical ECG tracing is a repeating cycle of three electrical entities: a P wave (atrial depolarization), a QRS complex (ventricular depolarization) and a T wave (ventricular repolarization). The ECG is traditionally interpreted methodically in order to not miss any important findings. [3]
General Terms Biomedical Signal Arrhythmias.
Processing,
Pattern
Recognition,
Keywords Cardiomyopathy, ECG, Support Vector Machines (SVM), Artificial Neural Networks (ANN), Feed forward back propagation Neural Network.
1. INTRODUCTION Cardiomyopathy is a particular heart situation in which the Cardiac Muscle becomes inflamed and enlarged, due to which the heart muscle is stretched and becomes weak and hence it can’t pump blood as fast as it should and if the heart muscle becomes too weak, it may develop heart failure. [1] There are many different types of Cardiomyopathy, caused by a range of factors from coronary heart disease to certain drugs. All these causes can lead to irregular heartbeats, heart failure, heart valve problems, and other complications. The Common symptoms of Cardiomyopathy are dyspnea (breathlessness) and peripheral edema (swelling of the legs). Cardiomyopathy is a significant clinical problem which is mainly generated by Volume/diastolic overload. To accommodate the increased blood volume, the heart chambers may stretch or dilate. Valvular regurgitation and congestive heart failure are two conditions that contribute to chamber dilation [2]. The person having cardiomyopathy shows irregular heartbeat called as Arrhythmias in Medical terminology. These can be detected
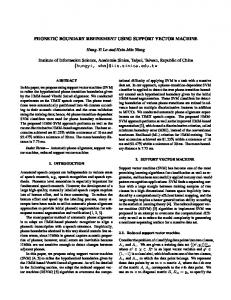
Figure 1: Normal Sinus Rhythm The proposed system uses two techniques for classification Support Vector Machine and Feed forward backpropagation Neural Network the classification performance is Evaluated in terms of Accuracy, Sensitivity and positive pridictive. The comparative study of Results shows better classification accuracy using Feed forward backpropagation Neural Network than Support Vector Machine. The paper is organized as follows, Section 2 describes Literature Review, Section 3 describes the details of Methodology and materials, Section 4 presents the Results and Discussion and final conclusion is given in section 5.
2. LITRATURE REVIEW In an effort of automated detection of heart diseases various research and algorithms have been developed those are based on ECG data analysis and classification. Digital signal analysis, Fuzzy Logic methods, Artificial Neural Network, Hidden Markov Model, Genetic Algorithm, Support Vector Machines, Self-Organizing Map, Bayesian are various
29
International Journal of Computer Applications (0975 – 8887) Volume 133 – No.14, January 2016 classification techniques proposed and under Evaluation each technique is having its own advantages and disadvantages. Mirela Ovreiu and Dan Simon (2012) shown that the clinical ECG data can be classified as Cardiomyopathy and Non Cardiomyopathy using neuro-fuzzy network training by biogeography-based optimization(BBO) and got 60 % accuracy on test data[5]. Ahmad Shukri.M.H et al (2012) proposed a method for detection of Cardiomyopathy with Elman Neural Network .In his approach he took total of 600 ECG beat samples from an established online database. Nine time-based descriptors from leads I, II and III were used for training, testing and validation of the network structures. A total of five hidden-node node structures were tested with four different learning algorithms. Results show that all the network structure managed to achieve more than 90% classification accuracy. The fastest convergence was achieved with the Levenberg-Marquardt algorithm with an average of 16 epochs [6]. a similar approach for detecting cardiomyopathy is proposed by Ali M.S.A.M (2012) they used Multilayered Perception Network for classification, they worked on PTB diagnostic ECG database which includes data for normal, cardiomyopathy and other arrhythmias .they trained total 600 beats and test five different MLP structures, four different algorithms were implemented to obtain the best classification accuracy and results showed that the Levenberg Marquardt Algorithm Gives Highest average Classification accuracy of 98.9%.[7].. A. T. SAYAD et al (2014) presented diagnostic system for Heart disease using data mining and artificial neural network (ANN) techniques. From the ANN, a Multilayer perceptron neural network along with back propagation algorithm is used to develop the system and works efficiently. [8]. V .K. Srivastava et al (2013) presented the system based on the application of Neuro Fuzzy network for reliable heartbeat classification on the basis of the ECG wave form. The potential of accuracy rate for Neuro Fuzzy system as ECG diagnostic decision aid is very high.[9]. Lai Khin Wee et al (2009) developed the automation data capturing and sending system based on digitized ECG image that enables the patient monitoring process with the medical devices without any wire connections. The output of the developed program is a self-generated report which including patients’ information and heart rate. It will then be send through the internet connection to the user’s recipients. [10] K.S.Kavitha et al (2010) proposed a system for detection of heart disease based on feed forward neural network architecture and genetic algorithm in their work they uses Genetic algorithm for training that Overcomes the problem of local minima with backpropagation algorithm.[11]. Mrs. B. Anuradha and V.C.Veera Reddy(2005) proposed arrhythmia Classification using Fuzzy Classifier they showed that The cardiac arrhythmia classification using fuzzy logic approach has given better performance results when compared to analytical method and using artificial neural networks for classification. More over problems associated with conventional neural network arch such as learning rate limitation and difficulty in selecting the optimal number of hidden units are eliminated [12].Anand Kumar Joshi et al (2014) in his review paper focused on analysis of ECG signals for Arrhythmia and abnormalities. And concluded that the DWT discrete wavelets transform analyzes the ECG signals and neural networks are the efficient classifier for arrhythmias [13].
3. METHODOLOGY AND MATERIALS
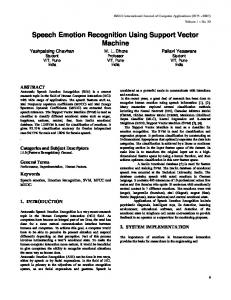
Figure 2: Proposed System Methodology
3.1 Data Acquisition The system works on total 63 subjects ECG data which is obtained from online PTB diagnostic ECG database The database contains 549 records from 290 subjects (aged 17 to 87, mean 57.2; 209 men, mean age 55.5, and 81 women, mean age 61.6; ages were not recorded for 1 female and 14 male subjects). Each subject is represented by one to five records [14]. The proposed work uses signals of 49 healthy subjects and 14 cardiomyopathy subjects.
3.2 Preprocessing Preprocessing is the task of data preparation for feature extraction that refines the data by removing the unwanted artifacts. Two dominant artifacts present in ECG recordings are: (1) high-frequency noise caused by electromyogram induced noise, power line interferences, or mechanical forces acting on the electrodes; (2) baseline wander (BW) that may be due to respiration or the motion of the patients or the instruments. These artifacts severely limit the utility of recorded ECGs and thus need to be removed for better clinical evaluation. In this method we had applied the Band pass filters with 0.5 to 45 Hz that is the cutoff low frequency to get rid of baseline wander and the cut off frequency to discard high frequency noise. Then Moving average Filters are applied for further enhancement. [𝑖] =
1 M
𝑀−1 j=0 x
i + j ----------- (1)
Equation of the moving average filter In this equation, x [ ] is the input signal, y [ ] is the output signal, and M is the number of points used in the moving average. This equation only uses points on one side of the output sample being calculated. [15].
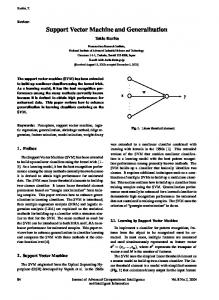
(a)Raw Signal
(b)preprocessed Signal Figure 3: Raw and Preprocessed Signal
30
International Journal of Computer Applications (0975 – 8887) Volume 133 – No.14, January 2016 After filtering Different Quality measures Like MSE, PSNR and SNR are applied to judge the quality of signals for noise removal and baseline correction. Table 1: MSE, PSNR and SNR values of ECG Signals. Signal ID
MSE
PSNR
SNR
s0311lrem(Healthy) 0.006272987 70.19006
1.01541
s0402lrem(Healthy) 0.000469348 81.44985
0.589849
s0420_rem(Cardio) 0.000711506 79.64302
1.229599
s0456_rem(Cardio) 0.000553734 80.73179
0.282322
3.3 Feature Extraction The extracted feature from the ECG signal plays a vital in diagnosis of Cardiomyopathy. The development of accurate and quick methods for automatic ECG feature extraction is of major importance. One cardiac cycle in an ECG signal consists of the P-QRS-T waves. The duration of the waves and the time Intervals of the Waves are of Importance to detect abnormality or Arrhythmias in an ECG. Detection of P wave, QRS complex wave is difficult as ECG signal varies with time due to psychological conditions and presence of noise the proposed feature extraction scheme uses Adaptive thresholding method for detecting the p wave, QRS complex and T waves of an ECG signal [16].
Figure 4 : Signal with P –QRScomplex and T waves Detected Once the peaks are detected, it is possible to calculate the subsequent intervals of the waves for detecting arrhythmias.
In this study The Four Time based features PR interval, QT interval, RR interval and QRS interval are calculated.
Table 2: Normal and Calculated range of ECG wave Intervals Sample No
PR Interval
QT
Normal Range
0.12 to 0.20 s
2
Interval
RR Interval
QRS Interval
Disease Detected
0.35 to 0.44 s
0.6 to 1.0 s
0.08 to 1.0s
Healthy
0.083636
0.378336
0.9218
0.129364
Cardiomyopathy
3
0.100167
0.436942
0.853091
0.087583
Cardiomyopathy
4
0.089667
0.193913
0.841667
0.069083
Cardiomyopathy
5
0.04
0.37819
0.725071
0.144929
Cardiomyopathy
11
0.1462
0.503417
0.9721
0.0932
Cardiomyopathy
34
0.129
0.335154
1.0345
0.097
Healthy
35
0.1161
1.383794
1.034778
0.1025
Healthy
36
0.144909
0.324022
0.908545
0.059455
Healthy
31
International Journal of Computer Applications (0975 – 8887) Volume 133 – No.14, January 2016 37
0.138
0.261558
0.9595
0.06
Healthy
38
0.142
39
0.103615
0.351099
0.9744
0.085727
Healthy
0.337534
0.770923
0.052923
40
Healthy
0.107231
0.410371
0.785154
0.080462
Healthy
41
0.118615
0.269958
0.782154
0.055538
Healthy
42
0.137091
0.322694
0.967364
0.089273
Healthy
43
0.113615
0.391447
0.781692
0.082231
Healthy
3.4 Classification
of the first class
The Extracted Features PR, RR, QT and QRS intervals are normalized before classification, two classification methods Support vector Machines and Feed forward backpropagation neural networks are applied and finally the performance is measured using some statistical metrics.
Or of the second. This can be rewritten as:
3.4.1 Support Vector Machines Support vector machine (SVM) is a novel learning Machine introduced first by Vapnik [17] Support Vector Machine is based on the concept of decision planes that define decision boundaries. A decision plane is one that separates between a set of objects having different class memberships. SVM supports both regression and classification tasks and can handle multiple continuous and categorical variables. [18]. in this study we had used Linear SVM as we are having only two classes. Given some training data , a set of points of the form
We can put this together to get the optimization problem: Minimize (in w ,b) subject to (for any
)
Where the is either 1 or −1, indicating the class to which the point belongs. Each is a -dimensional real vector. We want to find the maximum-margin hyperplane that divides the points having points
from those having
. Any hyperplane can be written as the set of satisfying
Where denotes the dot product and the (not necessarily normalized) normal vector to the hyperplane. The parameter determines the offset of the hyperplane from the origin along the normal vector .If the training data are linearly separable, we can select two hyperplanes in a way that they separate the data and there are no points between them, and then try to maximize their distance. The region bounded by them is called "the margin". These hyperplanes can be described by the equations [19]
and Geometrically, the distance between these two hyperplane is
Figure 4: Maximum-margin hyperplane and margins for an SVM trained with samples from two classes. Samples on the margin are called the support vectors.
3.4.2 Feed forward Backpropagation Neural Network The feed forward, back-propagation architecture was developed in the early 1970’s by several independent sources (Werbor; Parker; Rumelhart, Hinton and Williams) [20]. This independent co development was the result of a proliferation of articles and talks at various conferences which stimulated the entire industry[17].The backpropagation algorithm (Rumelhart and McClelland, 1986) is used in layered feedforward ANNs. This means that the artificial neurons are organized in layers, and send their signals “forward”, and then the errors are propagated backwards. The network receives inputs by neurons in the input layer, and the output of the network is given by the neurons on an output layer. There may be one or more intermediate hidden layers.
, so to maximize the distance between the planes we want to minimize . As we also have to prevent data points from falling into the margin, we add the following constraint: for each either
32
International Journal of Computer Applications (0975 – 8887) Volume 133 – No.14, January 2016 and Total 86 % classification accuracy is obtained. In ANN classification all the dataset are divided into 70% training, 15% Testing and 15% validation datasets. The network is having 8 input layers, 20 hidden layers and one output layer the system is trained using Levenberg-Marquardt algorithm the best classification accuracy is achieved up to 12 epochs. We are getting 98% accuracy for Healthy and 85% for Cardiomyopathy and total 95% classification accuracy. The results are described in Table 4. Table 4: Classification Results.
Classifier
Support Vector Machines
Accuracy
86.36
Healthy
Cardiomyopathy
Se
Pp
Se
Pp
94.11
88.88
60
75
97.95
85.76
85.71
92.30
Figure 5: Neural network classifier architecture The backpropagation algorithm uses supervised learning, which means that we provide the algorithm with examples of the inputs and outputs we want the network to compute, and then the error (difference between actual and expected results) is calculated. The idea of the backpropagation algorithm is to reduce this error, until the ANN learns the training data. The training begins with random weights, and the goal is to adjust them so that the Error will be minimal. [21].
3.5 Performance Evaluation Three Statistical performance Measures are applied those are accuracy, sensitivity, positive predictive. These parameters are defined using 4 measures True Positive (TP), True Negative (TN), False Positive (FP), and False Negative (FN)[22]. TP (True Positive): Cardiomyopathy detection matches with decision of physician. TN (True Negative): both classifier and physician advised absence of Cardiomyopathy. FP (False Positive): system labels a healthy case as a Cardiomyopathy. FN(False Negative): system labels a Cardiomyopathy as healthy Accuracy: Accuracy is the ratio of number of correctly classified Samples, and is given by Accuracy= (TP+TN) / N ×100-------------- (2) Total number of cases are N Sensitivity: Sensitivity refers to the rate of correctly classified positive. Sensitivity may be referred as a True Positive Rate. Sensitivity should be high for a classifier. Se = TP / (TP+FN) ×100--------- (3) Positive predictive: Positive predictive is probability that disease is present when test is positive, which is by how much amount disease is correctly predicted. Pp = TP/ (TP+FP) ×100-(4)
4. RESULTS AND DISCUSSION In SVM classification linear SVM is applied all the dataset is divided into Training dataset having total 46 samples and testing dataset having 17 samples. We are getting 94.11 % accuracy for Healthy and 60 % accuracy for cardiomyopathy
Feed forward backpropagation Neural Network
95.2
5. CONCLUSION AND FUTURE WORK The proposed system works on the ECG signals taken from online PTB diagnostic ECG database total 63 subject’s signals are obtained for Healthy and cardiomyopathy. Initially the signals are preprocessed for removal of high frequency noise and baseline correction. Adaptive thresholding method is then applied for the detection of P-QRS and T waves and the Intervals of the waves are calculated and taken as the features for the detection of cardiomyopathy and provided as Input to both classifiers SVM and ANN. Both the classifiers efficiently detect cardiomyopathy with good classification accuracy. Neural networks are the best classifier giving the highest classification accuracy 95%.wher as SVM giving 86 % accuracy. In future the proposed system can be enhanced for more accurate results by using the advanced feature extraction techniques like DWT also the more classification methods can be applied to compare the performance. Finally the system can be updated to detect all four types of cardiomyopathy.
6. ACKNOWLEDGEMENTS The author thanks to Physionet and the experts who have contributed in development of PTB diagnostic ECG database.
7. REFERENCES [1] National Heart Foundation http://www.heartfoundation.org.au.
of
Australia
[2] Cardiomyopathy, Healthline Networks http://www.healthline.com/health/heartdisease/cardiomy opathy#1 [3] Electrocardiography, Wikipedia https://en.wikipedia.org/ wiki/Electrocardiography [4] EKG http://www.vitatech.net/glossary/ekg/ [5] Mirela Ovreiu ,Daniel J.Simon” Cardiomyopathy Detection from Electrocardiogram Features” Electrical & Computer Engineering Faculty,Publications Electrical & Computer Engineering Department ,Cleveland State University 2012. [6] Ahmad Shukri, M.H.; Ali, M.S.A.M. ;Noor, M.Z.H. ; Jahidin, A.H.“Investigation on Elman neural network for
33
International Journal of Computer Applications (0975 – 8887) Volume 133 – No.14, January 2016 detection of cardiomyopathy” Control and System Graduate Research Colloquium (ICSGRC), 2012 IEEE [7] M.S.A.MegatAli,C.Z.A.CheZainal,A.Husman,M.F.Saaid ,M.Z.H.Noor,andA.H.Jahidin ”Detection of Cardiomyopathy Using Multilayered Perceptron Network”n8thInternationalColloquim on Signal Processing and its Applications.2012 IEEE. [8] A. T. Sayad, P. P. Halkarnikar” Diagnosis Of Heart Disease Using Neural Network Approach” Proceedings of IRF International Conference,13th April-2014. [9] V.K.Srivastava, Dr. Devendra Prasad” Dwt - Based Feature Extraction from ecg Signal” American Journal of Engineering Research (AJER) 2013Volume-02, Issue-03. [10] Lai Khin Wee, Yeo KeeJiar, EkoSupriyanto ”Electrocardiogram Data Capturing System and Computerized Digitization using Image Processing Techniques” International Journal Of Biology And Biomedical Engineering Issue 3, Volume 3, 2009. [11] K.S.Kavitha , K.V.Ramakrishnan , Manoj Kumar Singh” Modeling and design of evolutionary neural network for heart disease detection” IJCSI International Journal of Computer Science Issues, Vol. 7, Issue 5, September 2010. [12] Mrs.B.Anuradha,V.C.VeeraReddy Arrhythmia Classification Using Classifiers”Journal of Theoretical and Information Technology 2005 - 2008 JATIT
”Cardiac Fuzzy Applied
[13] Anand Kumar Joshi1, Arun Tomar2, Mangesh Tomar3” A Review Paper on Analysis of Electrocardiograph (ECG) Signal for the Detection of Arrhythmia Abnormalities” International Journal of Advanced Research in Electrical, Electronics and Instrumentation Engineering Vol. 3, Issue 10, October 2014.
IJCATM : www.ijcaonline.org
[14] www.physionet.org/PTB. [15] N. Siddiah, T.Srikanth and Y. Satish Kumar “Nonlinear filtering in ECG Signal Enhancement” International Journal of Computer Science & Communication Networks ,ISSN 2249-5789,Volume:02;Issue:01; 2012. [16] http://www.mathworks.com/matlabcentral/fileexchange/ 72-peakdetect [17] Shaikh Abdul Hannan,V. D. Bhagile, R. R. Manza, R. J. Ramteke ”Diagnosis and Medical Prescription of Heart Disease Using Support Vector Machine and Feed forward Backpropagation Techniques” (IJCSE) International Journal on Computer Science and Engineering Vol. 02, No. 06, 2010, 2150-2159. [18] http://www.statsoft.com/Textbook/Support-Vector Machines. [19] https://en.wikipedia.org/wiki/Support_vector_machine. [20] Veerendra Singh and S. Mohan Rao, “Application of image processing and radial basis neural network techniques for ore sorting and ore classification”. Mineral. Eng., 18: 1412-1420, 2005[29]. [21] Artificial Neural Networks for Beginners by Carlos Gershenson [22] P. Keerthi Priya, Dr.G.Umamaheswara Reddy” MATLAB Based GUI for Arrhythmia Detection Using Wavelet Transform” International Journal of Advanced Research in Electrical,Electronics and Instrumentation Engineering(An ISO 3297: 2007 Certified Organization) Vol. 4, Issue 2, February 2015. [23] S.Karpagachelvi, Dr.M.Arthanari, Prof. & Head, M.Sivakumar,” ECG Feature Extraction Techniques - A Survey Approach” International Journal of Computer Science and Information Security,Vol. 8, No. 1, April 2010
34