5050
IEEE TRANSACTIONS ON WIRELESS COMMUNICATIONS, VOL. 8, NO. 10, OCTOBER 2009
Intelligent RFID Tag Detection Using Support Vector Machine Minho Jo, Member, IEEE, Hee Yong Youn, Senior Member, IEEE, and Hsiao-Hwa Chen, Senior Member, IEEE
Abstract—RFID Tag detection/recognition is one of the most critical issues for successful deployment of RFID systems in diverse applications. The main factors influencing tag detection by RFID reader antenna include tag position, relative position of reader, read field length, etc. In this paper, we analyze the characteristics of tag detection for a carton box object on a wooden pallet by an experimental approach based on tag signal strength, and we propose a method for predicting detection related directly to the strength of tag signal using an intelligent machine learning technique called support vector machine (SVM). The use of the proposed method is able to save time and cost by quick prediction of tag detection. Extensive experiments showed that the proposed approach can predict tag recognition for a carton box object with an accuracy at 95% for various reader heights and read field lengths. The proposed approach is effective for determining the best tag detection influencing factor conditioned on the target object with the help of detectability prediction. Index Terms—RFID, SVM, intelligent prediction of tag detection, influencing factor.
R
I. I NTRODUCTION
FID (RADIO FREQUENCY IDENTIFICATION) works based on radio communication for tagging and identifying stationary or mobile objects. Using a special antenna device called RFID reader, RFID technology allows objects to be labeled and tracked as they move from one place to another. A typical RFID system consists of tag, reader, middleware, application program, and server [1]. The application program typically handles a specific task, such as keeping track of the inventory in a warehouse or reordering the items removed from the shelves in a retail store based on inventory database. It also takes an appropriate action according to the data extracted from the tags attached on the target items such as retail products, pallets, cartons, shipments, or trucks. The middleware acts as a bridge interfacing the hardware components of the
Manuscript received October 27, 2007; revised July 14, 2008, November 15, 2008, and April 28, 2009; accepted July 16, 2009. The associate editor coordinating the review of this paper and approving it for publication was Moe Win. This work is supported by the BK 21 program, S. Korea and supported by the grant (07High Tech A01) from High-tech Urban Development Program funded by Ministry of Land, Transportation and Maritime Affairs of Korean government. A preliminary version of this paper appeared in IEEE ICST 2008. M. Jo is with the Graduate School of Information Management and Security, Korea Univ., 5 Anam-Dong, Seongbuk-Gu, Seoul, 136-701 South Korea (e-mail:
[email protected]). H. Y. Youn (Corresponding author) is with the School of Information and Communication Engineering, Sungkyunkwan Univ., 300 CheoncheonDong, Jangan-Gu, Suwon, Gyeonggi-Do, 440-746 South Korea (e-mail:
[email protected]). H.-H. Chen (Corresponding author) is with the Department of Engineering Science, National Cheng Kung University, 1 Da-Hsueh Road, Tainan City, 70101 Taiwan (e-mail:
[email protected]). Digital Object Identifier 10.1109/TWC.2009.071198
lower layer of the system architecture with the application program of the higher layer. In some works reported in the literature the application program and middleware together are considered as middleware as a whole. An RFID tag is a small radio frequency based chip possibly coupled with a microprocessor, which can communicate wirelessly with a RFID reader. The RFID reader is a powered RF device communicating with the tags on the wireless loop and one or more computers on the other side of wired infrastructure. In supply chain management and factory automation, it is possible to track the cartons and pallets by attaching a tag to each of them. Information of an object such as ID and timestamped location data can be written into the tag, and then read out from it later. Extracting data from a tag using a reader is very sensitive to several factors such as the type, location, and direction of the tag, material of the pallet, type of the contents inside the carton box, and distance between the tag and reader [2] [3] [4]. The location and direction of a tag are two most important factors determining the successful rate in reading RFID tag information. An RFID tag contains a unique ID and other data which are read by RFID reader and then transmitted to the database (DB) server. To successfully read the tag ID is also called ”RFID tag detection (or recognition)”. The probability of successful tag recognition depends on the strength of tag signal sensed by RFID reader. The stronger tag signal received by RFID reader yields the higher tag detection rate performed by RFID reader. ”Detection rate” and ”detectability” are synonyms in this paper. Tag detectability in fact gives a ratio of all tag detection trials to the number of successful tag detection trials. The distance between reader and tag is called the read field length. A relatively long distance between them provides a convenient working space. A relatively long read field length is desirable as long as the RFID reader can recognize the tags. The major problem associated with the deployment of the RFID systems in a working environment is the failure in detecting the tags. For quality of service (QoS) concern of a RFID system, tag detection at a very high successful rate will be required. The solutions for solving tag detection failure problem have been sought in the literature based mostly on the hardware of the RFID systems [5], while little has been done in maximizing the readability in a cost-effective way [6] [7] [8]. It has been suggested in the literature that finding the location and direction of RFID tag allowing maximum readability is not easy but requires time consuming trial-anderror procedures. Location and direction of a tag on an object and relative position of the reader significantly influence the readability of
c 2009 IEEE 1536-1276/09$25.00 ⃝
JO et al.: INTELLIGENT RFID TAG DETECTION USING SUPPORT VECTOR MACHINE
the tag, i.e., tag detection. Proper conditions or factors giving the best tag detection (100% detectability) should be analyzed and obtained before an RFID system is implemented. This analysis is usually performed by very time consuming trialand-error procedures, also called “experimental approach”. Currently, there is no standard established for specifying tag and reader positions, and very little research and virtually no systematic analysis on this issue has been reported so far [7] [8] [9]. Nevertheless, this is a crucial issue for the RFID systems before they can be widely used in practice. Thus, those problems have motivated us to conduct research on experimental analysis of tag detection and to propose some intelligent RFID tag detection method. In this paper, we will carry out the study in the following two steps. First, the relation of reader and tag positions with respect to tag detection is systematically investigated by an experimental approach that requires time consuming trial-and-error procedures. Then, we propose an approach for predicting tag detection related directly to the strength of tag signal using an intelligent machine learning technique called “support vector machine” (SVM) in order to eliminate tedious and timeconsuming trial-and-error procedures required for measuring tag signal strength corresponding to various tag positions on target objects. Successful tag detection depends on the strength of tag signal sensed by RFID reader. In other words, if the strength of tag signal received by RFID reader is above a certain level, a tag is considered to be detected by the RFID reader. This is the reason why we predict the strength of tag signal to know whether or not a tag is detected. We summarize the main goals and contributions of this work as follows: a) We conduct a systematic experimental analysis (based on trial-and-error procedures) of tag detection for passive RFID with a fixed tag attached on a carton box. b) The goal of the systematic experimental analysis is to find the best tag detection influencing factors. c) We propose a time saving and cost effective intelligent RFID tag detection prediction method using support vector machine algorithm. d) The goal of the proposed intelligent method based on SVM is to predict tag detection in finding out what position of tag and what height/distance of reader should be without conducting experimental analysis. Here the location of a RFID tag, height of the RFID reader, and read field length are considered as the major variables influencing the strength of received tag signal during tag detection process. The strength of tag signal with different reader heights and read field lengths can be accurately predicted by the proposed SVM approach. Jo et al. presented a back-propagation (BP) learning-based RFID tag detection approach in 2007 and 2008, respectively [7] [8]. It is noted that the performance result (with 90% accuracy) of the work carried out in 2007 was not as good as that using the SVMbased method (with 95% accuracy) proposed in this paper. The testbed environment (with water containing object on a conveyer) of the work done in 2008 was different from that considered in this research. In order to facilitate the SVM model to accurately predict the tag signal strength, it is required to train it using the existing tag signal strength
5051
data obtained through the experimental approach. Prediction of tag signal strength to replace the time consuming trial-anderror procedures (i.e., experimental approach) for tag detection allows us to make it easier to find the best influencing factors. The simulation results show that RFID tag detection prediction accuracy of the proposed intelligent approach can be as high as 95%, which is a very good figure. The rest of the paper is outlined as follows. The background and testbed environments considered in this study for RFID tag detection are discussed in Section II. The proposed schemes such as linear and non-linear SVM models are introduced in Section III. The performance evaluation with the results obtained from both experimental approach and proposed intelligent SVM approach are presented in Section IV, followed by the conclusions and remarks on the future works given in Section V. II. P RELIMINARIES FOR RFID S YSTEMS A. Structure of RFID Systems In a typical RFID system, passive tags are attached to the cartons on wooden pallet while a vertical polarization antenna is attached to the RFID reader. The RFID reader and a tag can communicate with each other with different frequencies, and currently most RFID systems operate on unlicensed spectrum bands. The commonly used frequencies include low frequency band (125 KHz), high frequency band (13.56 MHz), ultra high frequency band (860∼960 MHz), and microwave frequency band (2.4 GHz). The typical RFID readers are able to read the tags only on a single frequency, but multimode readers are becoming cheaper and more popular and they are capable of reading the tags at different frequencies [10]. The factors influencing tag detection include: (i) the contents of the object, (ii) the type, location, and direction of a tag, (iii) the material of pallet, (iv) the read field length, (v) the height, power, type, gain, and the number of antennas, (vi) the frequency range, (vii) the height and power of reader, and (viii) the working environment of the RFID system, etc. Among them, the location and direction of tag, reader height, and read field length are three most important factors. They are thus selected as the influencing factor variables in modeling and analysis of the scheme proposed in this paper. In the study carried out for finding the best tag position of an object (e.g., a carton box here), the goal is to select one of the six sides of the box, i.e., front (F), left (L), right (R), back (BK), bottom (BT), and top (T), with the strongest allowed tag signal. The tag strengths corresponding to various tag locations on one of the six different sides, antenna height, and read field length are collected and analyzed in this study. The RFID systems used in the experiments are Intermec IF 4 for RFID reader, RFID patch antenna, and Rafsec ShortDipole for tags, and their specifications are given as follows: a) RFID Reader: 902∼928 MHz frequency, reading rate of 50 tags/sec. b) RFID Antenna: 865∼928 MHz frequency, 6 dBi gain, vertical polarization. c) RFID Tag: 915 MHz frequency, EPC Class 1 Gen 2, Rafsec ShortDipole product. d) A single RFID antenna is used with an RFID reader.
5052
IEEE TRANSACTIONS ON WIRELESS COMMUNICATIONS, VOL. 8, NO. 10, OCTOBER 2009
of them are uncorrelated. The model describes a hyperplane in a 𝑘-dimensional space of the regressor variables [11]. A multiple linear regression model for our problem, based on the experimental data of the RFID tag strength, is proposed as follows: 𝑧=𝛾+
Antenna
𝛽𝑖𝑗𝑘 𝑥𝑖𝑗𝑘 + ∅1 𝑦1 + ∅2 𝑦2 + 𝜀,
(2)
𝑖=1 𝑗=1 𝑘=1
0 ~ 2.2 m
1.0 ~ 2.0 m
Fig. 1.
4 ∑ 6 ∑ 10 ∑
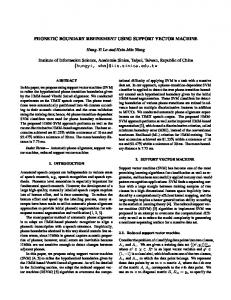
The RFID tag detectability testbed environment.
B. Operational Environment Without losing generality, the contents inside the cartons are assumed to be neither metal nor water, such as books or cloths. The experiment carried out was conducted with a typical load/unload dock of a building. Four cartons form a layer of 2 × 2 array and ten layers of them are stacked on a wooden pallet, as shown in Fig. 1. The size of a carton is 52 cm × 36 cm × 22 cm. In order to check the sensitivity of antenna height with respect to tag readability, the antenna is placed at three different heights; 0 m (the bottom of the stack), 1.1 m (the middle point of the stack), and 2.2 m (the top of the stack). The read field length varies from 1 m, 1.5 m, to 2 m. The antenna height and length of read field vary while the tags are located at different sides of each carton. Next, we will present the proposed approach for predicting the tag signal strength and tag detection capability. III. T HE P ROPOSED S CHEME To detect RFID tags efficiently, an intelligent prediction method is proposed. The proposed approach uses support vector machine (SVM) to predict the strength of tag signal for tag identification. In this section, we present two different models applied for the tag strength prediction, including linear model and support vector machine model. In the next section, the performance evaluation of the proposed approaches is given. As we did not know whether the experimental tag detectability data can be explained by a simple linear regression model yet, we checked it first by the regression analysis before going to the SVM approach which can be well fitted to a non-linear classification problem. A. Linear Regression Prediction Model First, multiple linear regression method is applied to check if the prediction model is linear. The general multiple linear regression formulation fitting the model can be written as: 𝑧 = 𝛽0 + 𝛽1 𝑥1 + 𝛽2 𝑥2 + ⋅ ⋅ ⋅ + 𝛽𝑘 𝑥𝑘 + 𝜀,
(1)
where 𝛽0 is a constant, the unknown parameters 𝛽𝑖 (𝑖 = 1, . . . , 𝑘) are regression coefficients, 𝑥𝑖 is the regressor variable, and 𝜀 is a random prediction error component such that we have 𝐸[𝜀] = 0 and 𝑉 [𝜀] = 𝜎 2 . Assume that all
where 𝛾 is a constant, 𝑦1 stands for the height, 𝑦2 is the read field length, ∅1 and ∅2 are regression coefficients, 𝑥𝑖𝑗𝑘 is the tag position (such that 𝑖 is a box position index, 𝑗 stands for tag side, and 𝑘 represents layer), and 𝜀 is a random error. We would like to check how closely the model can be linearly fitted to the RFID tag strength data using SPSS [12]. The statistical results obtained from SPSS show that it is not appropriate to predict the RFID tag strength by the linear model with a very low 𝑅 square value of 0.244 with a standard error of 0.712. Here, the 𝑅 square value represents the percentage of the variability in the data used by the linear model [11]. Standard error is a measure of the precision (standard deviation) of the sample (tag strength data) mean. For a better understating of 𝑅2 , let us suppose that there is a single dependent variable or output 𝑧 which depends on 𝑘 independent regressor variables (input data), 𝑥1 , 𝑥2 , . . ., 𝑥𝑘 (for our case, 𝑥𝑖𝑗𝑘 , 𝑦1 , 𝑦2 ). 𝑛 ∑
𝑅2 =
(ˆ 𝑧𝑗 − 𝑧¯)2
𝑗=1 𝑛 ∑
,
0 < 𝑅2 ≤ 1
(3)
2
(𝑧𝑗 − 𝑧¯)
𝑗=1
where 𝑧¯ is the mean of 𝑧 and 𝑧ˆ is the predicted value of 𝑧, respectively. The quantity 𝑅2 is called the coefficient of determination which is often used to judge the adequacy of a linear regression model [11]. If the regressor 𝑥 is a random variable, then 𝑅 is just the correlation between 𝑧 and 𝑥. For example, if 𝑅2 = 0.9337, then 93.37 percent of the variability in the data is accounted for by the linear regression model. It is generally said that the linear regression model can be recommended for predicting the output if 𝑅2 is higher than 0.7. A low 𝑅 square result means that the linear regression model does not fit well to the experimental data. Therefore, we conclude that the multiple linear regression approach is not appropriate for solving this problem. B. Support Vector Machine Model The SVM (Support Vector Machine) technique has been successfully applied to a wide range of non-linear classification problems. The SVM was originally derived from the statistical learning theory [13], and has been widely applied to the real-world applications recently. It has been used for novelty detection and many other applications [14]. The neural networks have also been successfully applied for classification and regression problems. However, it has been generally accepted that the SVM technique outperforms the neural network methods for solving the classification problems [15] [16] [17] [18]. Compared to the neural networks, the SVM model allows to train a model with a smaller amount of training datasets
JO et al.: INTELLIGENT RFID TAG DETECTION USING SUPPORT VECTOR MACHINE
{x | +b}= +1 Plus Plane
Plus Predict Zone
5053
Eq. (6) and the constraints, Eqs. (7) and (8):
Support Vector
{x | +b}= -1 Minus Plane
min Error Vector
j
Support Vector
Maximize Margin Support Vector
Origin Minus Predict Zone
𝑥𝑖 ⋅ 𝑤 + 𝑏 ≥ +1, for 𝑦𝑖 = +1,
(7)
𝑥𝑖 ⋅ 𝑤 + 𝑏 ≥ −1, for 𝑦𝑖 = −1.
(8)
Eqs. (6) and (7) can be formulated into one set of inequalities, or
Error Vector
|b|/||w||
(6)
subject to
Support Vector i
∥ 𝑤 ∥2 , 2
{x | +b}=0 Optimal Hyperplane
𝑦𝑖 (𝑥𝑖 ⋅ 𝑤 + 𝑏) − 1 ≥ 0, for ∀𝑖
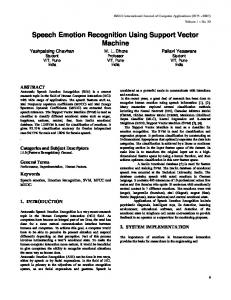
2) Non-Separable Case: As shown in Fig. 2, 𝜉𝑖 and 𝜉𝑗 lying across the plus plane or minus plane generate errors because the linear hyperplane can not classify them. We can slightly modify the optimization problem to add a penalty called the slack variable 𝜉𝑖 for violating the classification constraints, or
Fig. 2. Support vectors and optimal classification hyperplane for the case of two classes.
with a large dimension to achieve global optimality. It is also relatively easy to equalize the error. 1) Separable Case: We start with a simple example case where the training datasets are linearly separable. The main idea with the SVM is to find an optimal classifier or an 𝑁 dimensional hyperplane that maximizes the margin between two classes while minimizing the upper bound of error, as shown in Fig. 2. There is no need to minimize the error in the linear classification case because all examples can be separated completely by a linear separator. With two classes, let 𝑥 ∈ ℜ𝑛 and 𝑦 ∈ {−1, 1} be the training instances for input and target, respectively. We also introduce 𝑤 ∈ ℜ𝑛 and 𝑏 ∈ ℜ which are weight vectors and bias, respectively. The separating hyperplane can be expressed in terms of 𝑤 and 𝑏 as: 〈 〉 𝑤, 𝑥 + 𝑏 = 0, (4) 𝑤1 𝑥1 + 𝑤2 𝑥2 + ⋅ ⋅ ⋅ + 𝑤𝑛 𝑥𝑛 + 𝑏 = 0, where 𝑤 is normal to the hyperplane. The decision function of Eq. (4) for the optimal hyperplane is 〈 〉 𝑓 (𝑥) = 𝑠𝑖𝑔𝑛 𝑤, 𝑥 + 𝑏 = 0. (5) Let us label the training dataset as {𝑥𝑖 , 𝑦𝑖 } 𝑖 = ∣𝑏∣ 1, 2, ⋅ ⋅ ⋅ , 𝑙, 𝑥𝑖 ∈ ℜ𝑛 , 𝑦𝑖 ∈ {1, −1}. As shown in Fig. 2, ∥𝑤∥ is the length of the perpendicular line from the hyperplane to the origin. ∥ 𝑤 ∥ is the Euclidean norm of 𝑤. In particular, the 2 . The margin between the plus plane and minus plane is ∥𝑤∥ data points lying on the plus plane and minus plane closest to the hyperplane, are called support vector. The plus plane and minus plane are parallel to each other, i.e., they have the same normal and no training data points fall between them. For the linearly separable cases, the SVM algorithm simply finds a separating hyperplane of the maximum margin, 2 . This can be performed by minimizing i.e., maximizing ∥𝑤∥ 2 ∥ 𝑤 ∥ with all training data satisfying the objective function,
(9)
min
𝑙
∑ ∥𝑤∥ +𝐶 𝜉𝑖 , 2 𝑖=1 2
(10)
subject to the relaxed classification constraints: 𝑦𝑖 (𝑥𝑖 ⋅ 𝑤 + 𝑏) − 1 + 𝜉𝑖 ≥ 0,
(11)
where 𝜉𝑖 ≥∑ 0 is the distance of error vectors to their correct places, and 𝑙𝑖=1 𝜉𝑖 is a parameter which controls the trade-off between the margin and the error. A dual Lagrange multiplier optimization problem of the primary optimization problem, Eqs. (10) and (11), can be formulated as follows: max 𝐿𝐷 (𝛼) =
𝑙 ∑
𝛼𝑖 +
𝑖=1
𝑙 1 ∑ 𝛼𝑖 𝛼𝑗 𝑦𝑖 𝑦𝑗 (𝑥𝑖 ⋅ 𝑥𝑗 ), (12) 2 𝑖=1,𝑗=1
subject to 𝑙 ∑
𝛼𝑖 𝑦𝑖 = 0,
and
0 ≤ 𝛼𝑖 ≤ 𝐶.
(13)
𝑖=1
It is noted that the Lagrange coefficient, 𝛼𝑖 , is bound by the trade-off parameter 𝐶. The concept of the non-separable case can be extended to the non-linear classification problem through mapping of the non-linear training datasets into a much higher dimensional space, i.e., 𝑥𝑖 → Φ(𝑥𝑖 ). The nonlinear input space is mapped into the linear feature space so that the data can be separated by the linear optimal hyperplane. The decision function for the optimal hyperplane can be written as 𝑓 (𝑥) =
𝑙 ∑
[ ] 𝛼𝑖 𝑦𝑖 Φ(𝑥) ⋅ Φ(𝑥𝑖 ) + 𝑏 .
(14)
𝑖=1
The mapping is easily made by a kernel function, 𝐾(𝑥, 𝑥𝑖 ) = Φ(𝑥) ⋅ Φ(𝑥𝑖 ) [19] [20]. The kernel functions to be used in this research can be polynomial function and Gaussian radial basis function (RBF) which are good enough for predicting non-linear tag detection rates.
5054
IEEE TRANSACTIONS ON WIRELESS COMMUNICATIONS, VOL. 8, NO. 10, OCTOBER 2009
IV. P ERFORMANCE E VALUATION A. Experimental Approach To verify the performance of the proposed intelligent prediction approach, the prediction accuracy is calculated by comparing the results of the experimental method to those of the proposed approach. First, an experiment was conducted with a single carton box to identify the best tag location at a side of the carton box. Here, each side of the box is partitioned into a grid of squares of exactly the same size as the tag. The tag is located at each grid point and the tag signal strength is measured. The strength of tag signal is analyzed by the Instant EPC Hotspot which provides tag signal strength in both visual and numerical modes. The measured tag strengths turn out to be the same regardless of the position on a side of the carton box. Therefore, one position of the grid of a side can be randomly selected. We next find the best side for tag detection among the six sides of a carton. In each picture of the data for six sides shown above, the horizontal stripe represents the data where tags in a row are located at the upper and lower positions of each respective side. The lighter stripe of more than 4 dB tag strength represents stronger signal than the darker stripe, implying better tag detection. It is noted that the front and back sides yield the strongest signal (higher than 9 dB). On the contrary, the top and bottom sides show darker stripes, implying that the reader might fail to read the tags. The test for tag detectability was then taken for the cartons stacked in ten layers on a pallet as shown in Fig. 1. The measured tag signal strength is classified into three grades, depending on the magnitude of signal such as Grade-A, GradeB, and Grade-C, and we explain it as follows. a) Grade-A: Over 9 dB tag strength which is high enough for tag detection. b) Grade-B: 4 dB ∼ 9 dB tag strength which has no trouble to be recognized. c) Grade-C: Below 4 dB tag strength which is insufficient for tag detection. The tables given below show the tag strength for different tag locations, reader heights, and read field lengths. It is noted in Fig. 1 that four cartons are laid out in a layer as a 2 × 2 array, and each of them is marked as Front Left, Front Right, Back Left, and Back Right positions. Grade-A and Grade-B entries in the table represent tag detection capability while Grade-C cells do fail to detect the tag. The tag detectability test was conducted with the antenna height of 0 m, 1.1 m, and 2.2 m, and the read field length of 1 m, 1.5 m, and 2 m, respectively. We measured tag signal power by using Instant EPC Hotspot, varying with different influencing factor conditions in the environment as shown in Fig. 1. We tried to place a tag on each of six sides of a carton box and then measured the tag signal power. This measurement was repeated with different reader heights and read field lengths. The experimental results were then analyzed to find the best condition for tag detection. 1) Case-1: Height=2.2 m, Read Field Length=1 m: Table I illustrates the test results. Since the antenna is located at the same height as the top layer (the 10th layer), most tags in the upper layers (the 6th ∼ 10th layers) are recognized except for
the tags at the bottom (BT) or top (T) side of the box. We can thus identify that the direction of tag is quite sensitive to the readability. Of course, if the read field length is shorter than one meter, more tags could be read even though less work space is allowed. The tags attached to the front (F) or back (BK) side of the carton show little difference with respect to tag detection. The bottom and top sides are not recommended as the place for tag attachment. 2) Case-2: Height=2.2 m, Read Field Length=1.5 m: Since antenna gain is reduced due to increased read field length in this case, a smaller number of tags are recognized if compared with Case-1. In general, similar results as Case-1 are obtained as summarized in Table II. 3) Case-3: Height=1.1 m, Read Field Length=1 m: As illustrated in Table III, the largest number of tags are recognized in this case of all three cases compared so far, since the antenna height is equal to the middle position of the stack and the read field length is the shortest. The desirable sides are again front and back sides regardless of the position of the carton in a layer. The tag strength of the 1st, 2nd, 8th, and 10th layers is not strong enough, which might be compensated by reducing the read field length or placing another antenna. Similar test results were obtained for other values of reader height and read field length. The top and bottom side tags are hardly recognized while the tags at all other sides are recognized easily. The antenna height which is equal to the middle point of the stack is preferred to detect the largest number of tags as expected. A short read field length controls the trade-off between the detectability and space requirement. B. Intelligent Prediction Approach The experimental approach described above is very timeconsuming, and substantial amount of manual operations should be required for accurate experiment results with various reader heights and read field lengths. We now perform tag detection using the proposed intelligent SVM approach. The accuracy of the intelligent prediction of RFID tag detection with the proposed approach is verified by the simulation results. The simulation was carried out using SVMlight Version 6.01 [21]. The first step of simulation is to train the intelligent SVM model using the tag detection data obtained from the experimental approach described earlier. The second step is to let the trained SVM model detect the tag by predicting the tag signal strength. The prediction accuracy is calculated by comparing the predicted tag detection data with the actual tag detection data. We use two kernel functions such as polynomial function and Gaussian radial basis function (RBF). The polynomial kernel function is ) ( )𝑑 ( (15) 𝐾 𝑥, 𝑥𝑖 = 𝑥 ⋅ 𝑥𝑖 + 1 , where 𝑑 is a non-negative integer representing the degree of polynomial kernel function. The RBF kernel is )} { ( ( ) 1 2 , 𝛾 ≥ 0, 𝛾 = 𝐾 𝑥, 𝑥𝑖 = exp 𝛾 − ∥ 𝑥 − 𝑥𝑖 ∥ . 2𝜎 2 (16) A total of 4800 training examples are used. According to the results of RFID tag detection obtained by the experimental
JO et al.: INTELLIGENT RFID TAG DETECTION USING SUPPORT VECTOR MACHINE
5055
TABLE I M EASURED TAG STRENGTHS FOR C ASE -1. Lay er 1 2 3 4 5 6 7 8 9 10
F C C C C C A A A A A
BK C C C C C B B B B B
Front Left Box L R T C C C C C C C C C C C C C C C C C C C B C B B C B B C B B C
BT C C C C C C C C C C
F C C C C C A A A A A
Front Right Box BK L R T C C C C C C C C C C C C C C C C C C C C B C C C A B C C A B B C A B B C A B B C
BT C C C C C C C C C C
F C C C C C B A A A A
BK C C C C C B B A A A
Back Left Box L R T C C C C C C C C C C C C C C C C C C C B C B B C B B C B B C
BT C C C C C C C C C C
F C C C C C B A A A A
Back Right Box BK L R T C C C C C C C C C C C C C C C C C C C C B C C C B B C C A B B C A B B C A B B C
BT C C C C C C C C C C
BT C C C C C C C C C C
F C C C C C C A B A A
Back Right Box BK L R T C C C C C C C C C C C C C C C C C C C C C C C C B C C C C C C C A B B C A B B C
BT C C C C C C C C C C
BT C C C C C C C C C C
F C C A A A A A A C C
Back Right Box BK L R T C C C C C C B C A A B C A A B C A A B C A A B C A A B C A A B C C C B C C C C C
BT C C C C C C C C C C
TABLE II M EASURED TAG STRENGTHS FOR C ASE -2. Lay er 1 2 3 4 5 6 7 8 9 10
F C C C C C C B A A A
BK C C C C C C C B A A
Front Left Box L R T C C C C C C C C C C C C C C C C C C C C C C B C B B C B B C
BT C C C C C C C C C C
F C C C C C C B A A A
Front Right Box BK L R T C C C C C C C C C C C C C C C C C C C C C C C C C C C C B B C C A B B C A B B C
BT C C C C C C C C C C
F C C C C C C C B A A
BK C C C C C C C C A A
Back Left Box L R T C C C C C C C C C C C C C C C C C C C C C C C C B B C B B C
TABLE III M EASURED TAG STRENGTHS FOR C ASE -3 [8]. Lay er 1 2 3 4 5 6 7 8 9 10
F C B A A A A A A B C
BK C C A A A A A A C C
Front Left Box L R T C C C C B C A A C A A C A A C A A C A A C A A C C B C C C C
BT C C C C C C C C C C
F C B A A A A A A B C
Front Right Box BK L R T C C C C C C B C A A A C A A A C A A A C A A A C A A A C A A A C C C B C C C C C
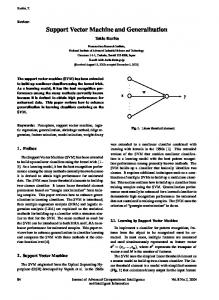
approach, the output grades of top (T) and bottom (BT) sides of all boxes are eliminated from training because the data are identical regardless of the antenna height and read field length, being not meaningful for training. As mentioned earlier, in this paper, the grade (class) of both A and B of RFID tag strength allows the detection of RFID tag, while the grade of C does not. Table IV lists all possible combinations of the grades of measured and predicted signal strength. Thus the target output considers two classes, i.e., tag detection (’A’ and ’B’ are equal, above 4 dB) or not (’C’, blow 4 dB). Fig. 3 shows the SVM tag detection prediction model proposed in this paper. The training examples consist of five input features (variables) of read field length (𝑥1 ), antenna height (𝑥2 ), box position (𝑥3 ), box side (𝑥4 ), and layer (𝑥5 ). The output (target) variable (𝑦) is successful detection (above 4 dB tag signal power) or not. The input variables and target variable pairs of the training set determine the unknown parameters of the decision function, 𝑓 (𝑥), and the objective function in the decision block. As an example of training, a training data set, a training pair of three input variables
BT C C C C C C C C C C
F C C A A A A A A C C
BK C C A A A A A A C C
Back Left Box L R T C C C C B C B A C B A C B A C B A C B A C B A C C B C C C C
TABLE IV P REDICTION ACCURACY. Measured signal strength A B C A B A C B C
Predicted signal strength A B C B A C A C B
Accuracy Correct Correct Correct Correct Correct Incorrect Incorrect Incorrect Incorrect
𝑥1 = 1.5 m (read field length), 𝑥2 = 2.2 m (antenna height), and 𝑥3 = 1 (front left box position), 𝑥4 = 6 (bottom (BT) box side), and 𝑥5 = 5 (the 5th layer) with output 𝑦 = 1 (successful detection) will be applied to determine all unknown variables of the decision function 𝑓 (𝑥), which is used to optimize the object function. The prediction accuracy is verified with different kernel parameter values, or 𝑑=1, 2, 3, 4, for the polynomial function
5056
IEEE TRANSACTIONS ON WIRELESS COMMUNICATIONS, VOL. 8, NO. 10, OCTOBER 2009
TABLE V P REDICTION ACCURACY OF THE PROPOSED MODELS .
Read field length
x1
(Height, Length) (0 m, 1.3 m)
Antenna height
(0 m, 1.7 m)
x2 Successful tag detection or not
Box position
x3 Box side
f(x) and Objective Function
y
(1.1 m, 1.3 m) (1.1 m, 1.7 m) (2.2 m, 1.3 m)
x4
(2.2 m, 1.7 m)
Prediction Accuracy Polynomial (𝑑 = 3) RBF (𝛾 = 0.1) 𝐶 = 0.01 𝐶 = 50 95.63(86.88) 96.25(88.75) 𝐶 = 0.01 𝐶 = 10 93.75(85.00) 95.63(86.88) 𝐶 = 0.1 𝐶 = 500 88.75(75.63) 90.63(81.25) 𝐶 = 100 𝐶 = 100 67.50(65.00) 88.75(76.25) 𝐶 = 0.1 𝐶 = 1000 95.00(85.63) 96.25(90.00) 𝐶 = 100 𝐶 = 100 83.13(78.75) 87.50(78.75)
Layer
x5
Fig. 3.
Proposed SVM tag detection prediction model.
kernel and 𝛾=0.01, 0.1, 0.5, 1, 5, 10, 15 for the RBF kernel. We use the cross-validation to tune the parameters of the kernel functions and the trade-off parameter, {𝐶, 𝑑, 𝛾} [22]. The cross-validation is to find the parameters yielding the optimal solutions. The hybrid algorithm is applied here for the cross-validation [23]. Different degrees of the polynomial function, 𝑑, are applied with a fixed 𝐶 value, {𝑑 = 1, 2, 3, 4 ∣ 𝐶 = 2000}. Li. et al. showed that a relatively large 𝐶 value of 2000 can work well for most cases [24]. With 𝑑 value giving the best result (𝑑 = 3 in our problem), we proceed with different 𝐶 values {0.01, 0.1, 100 ∣ 𝑑 = 3}. In the same way, the hybrid-algorithm is applied for RBF kernel: {𝛾 = 0.01, 0.1, 0.5, 1, 5, 10, 15 ∣ 𝐶 = 2000} and {𝐶 = 1, 10, 50, 100, 500, 1000, 2000 ∣ 𝛾 = 0.1}. The accuracy of the trained intelligent SVM model is verified by new test examples which have not been used for training. The tested parameter pairs (i.e., height and read field length) are (0 m, 1.3 m), (0 m, 1.7 m), (1.1 m, 1.3 m), (1.1 m, 1.7 m), (2.2 m, 1.3 m), and (2.2 m, 1.7 m). A total of 960 samples were used to verify the prediction accuracy of the proposed SVM approach. The trained SVM model predicts the tag signal strength class corresponding to the input features for each pair (of height, read field length). The predicted grades are then compared with the measured ones. C. Prediction Results and Analysis We first conduct the prediction with the polynomial function kernel. Using the hybrid algorithm of cross-validation, the RFID tag signal for each position with different values of antenna height and read field length is predicted with 𝑑 = 1, 2, 3, 4 and fixed 𝐶 = 2000 as the first step. The accuracy of prediction is presented in Fig. 4a. The accuracy of prediction accounts for the performance of the proposed SVM model. The accuracy of prediction is the ratio between all test samples and correctly predicted samples. The shaded bars represent different 𝑑 values. 𝑋-axis stands for pair of height and read field length. It is noted that the cubic function kernel with 𝑑 = 3 shows better performance than the other cases. Thus, we proceed
with different trade-off values 𝐶 = 0.01, 0.1, 100 with the fixed 𝑑 (=3) in the second step. The results of prediction with the cubic function are provided in Fig. 4b. The results with 𝐶 = 0.01 and 0.1 are relatively good for all (height, length) pairs except for (1.1 m, 1.7 m). However, the tag detectability of (1.1 m, 1.7 m) pair can be predicted well by the RBF kernel presented as follows. Now we are ready to conduct the tag detection prediction with RBF kernel in the same way as the polynomial function kernel. We use {𝛾 = 0.01, 0.1, 0.5, 1, 5, 10, 15 ∣ 𝐶 = 2000}, i.e., applying SVM with different 𝛾 values and a fixed large 𝐶 value of 2000. The results of the prediction accuracy are shown in Fig. 5a. For a short read filed length of 1.3 m, 𝛾 values of 0.1 and 0.5 provide better results than other 𝛾 values, such as 1, 5, 10 and 15. 𝛾 values of 1, 5, 10 and 15 are more effective for a longer distance (i.e., 1.7 m). Since 𝛾 values of 0.1 and 0.5 yield good results, we apply 0.1 for 𝛾 in the following case study. We next check the prediction accuracy with = different 𝐶 values and fixed 𝛾=0.1, i.e., {𝐶 1, 10, 50, 100, 500, 1000, 2000 ∣ 𝛾 = 0.1}. The results are shown in Fig. 5b. As observed from Fig. 5b, a 𝐶 value with 𝛾 = 0.1 does not significantly influence the accuracy of prediction. Table V compares the polynomial and RBF kernel models of SVM. It is noted that the RBF kernel model gives more accurate prediction than the polynomial function Kernel. The prediction accuracy is higher than 90% except for (1.1 m, 1.7 m) and (2.2 m, 1.7 m) pairs. However, the prediction accuracy for both pairs can be improved to 95% with 𝛾 = 10 and 𝐶 = 2000, and 93.13% with 𝛾 = 1 and 𝐶 = 2000, respectively. The prediction accuracy of the proposed scheme is sufficiently high, being enough to be implemented in real environment. It is said that more than 85% of prediction is desirable for the practical field application. For our problem, we suggest that more than 90% of prediction be applied to the practical field because a failure of RFID tag detection may miss the important tag information. However, if multiple tags are used, due to fail-safe it is not necessary that prediction accuracy should be made that high. On the other hand, multiple tags will give higher costs. According to the previous researches, it is generally considered that the RBF kernel performs better than the polynomial function kernel. In our problem, the RBF kernel shows a better performance than the polynomial
Prediction accuracy (%)
JO et al.: INTELLIGENT RFID TAG DETECTION USING SUPPORT VECTOR MACHINE
5057
100 90 80 70 60 50 40 30
1
2
3
4
d (0m, 1.3m) (0m, 1.7m) (1.1m, 1.3m)
(1.1m, 1.7m) (2.2m, 1.3m) (2.2m, 1.7m)
Prediction accuracy (%)
(a) Prediction accuracy with different 𝑑 values with fixed 𝐶 (=2000) for the polynomial kernel function.
100 90 80 70 60 50
0.01
0.1 C
(0m, 1.3m) (0m, 1.7m) (1.1m, 1.3m)
100 (1.1m, 1.7m) (2.2m, 1.3m) (2.2m, 1.7m)
(b) Prediction accuracy with different 𝐶 values while 𝑑=3 for the polynomial kernel function. Fig. 4.
Prediction accuracy results-I.
function kernel too.
Based on our simulations with RBF kernel function, there is no significant dependency in prediction accuracy between kernel parameter/trade-off parameter and read filed length/antenna height pair. Thus, we could not run simulations with pre-knowledgeable and pre-determined kernel/trade-off parameters but we were suggested to proceed to find the best prediction with some variable kernel/trade-off parameters. However, it is noted that the prediction accuracy shows instability for all length/height pairs if 𝛾 is below 0.1. In order to find appropriate parameters for the best and most stable prediction accuracy, we have to resort to a time-consuming trial-error method with all possible cases. However, to avoid the time-consuming trials, it is suggested to apply the crossvalidation to save time considerably as shown in this research.
V. C ONCLUSIONS Position of a RFID tag on an object and the relative position of reader antenna significantly influence tag readability. In this paper we have analyzed the factors influencing tag signal (eventually influencing tag detectability) based on the results obtained by experiments. Then we propose an intelligent method using SVM for the prediction of RFID tag detectability. Extensive simulations have been conducted to verify the prediction accuracy of the proposed approach. It predicts tag detectability fairly accurately for various values of reader height and read field length. Based on the predicted tag detectability, the best tag position, reader height, and read field length that maximize the number of recognized tags can be found. The proposed approach has been tested for the RFID tag on a carton box with non-water/non-metal contents. More studies on different kinds of contents such as metal, water, and clothes will be carried out in the future. Other
IEEE TRANSACTIONS ON WIRELESS COMMUNICATIONS, VOL. 8, NO. 10, OCTOBER 2009
Prediction accuracy (%)
5058
100 95 90 85 80 75 70 65
0.01 0.1
0.5
1 γ
(0m, 1.3m) (0m, 1.7m) (1.1m, 1.3m)
5
10
15
(1.1m, 1.7m) (2.2m, 1.3m) (2.2m, 1.7m)
Prediction accuracy (%)
(a) Prediction accuracy with different 𝛾 values with fixed 𝐶(= 2000) using RBF kernel.
100 95 90 85 80
1
10
50
100 C
(0m, 1.3m) (0m, 1.7m) (1.1m, 1.3m)
500 1000 2000 (1.1m, 1.7m) (2.2m, 1.3m) (2.2m, 1.7m)
(b) Prediction accuracy with different 𝐶 values with fixed 𝛾(= 0.1) using RBF kernel. Fig. 5.
Prediction accuracy results-II.
different environments to be considered for further research include asphalt-paved road nearby traffic lights and container ship yard and so on. In particular, we have experienced some difficulties in tag detection which is very sensitive to the asphalt-paved road environment with traffic lights. Thus, we will do further research on the tag detection problems in the other environments in the future. R EFERENCES [1] Rajit Gadh, “The state of RFID: heading toward a wireless Internet of artifacts,” ComputerWorld, August 11, 2004. [2] J. L. M. Flores, S. S. Srikant, B. Sareen, and A. Vagga, “Performance of RFID tags in near and far field,” in Proc. IEEE International Conference on Personal Wireless Communications 2005 (ICPWC 2005), pp. 353357, Jan. 2005. [3] B. Jiang, K. P. Fishkin, S. Roy, and M. Philipose, “Unobtrusive longrange detection of passive RFID tag motion,” IEEE Trans. Instrumentation and Measurement, vol. 55, no. 1, pp. 187-196, Feb. 2006.
[4] Techsolutions: “Application note: RFID solutions for pallet tracking,” http://www.techsolutions.co.za/PDF/Application%20Note%20Pallet%20 TrackingV1 3.pdf [5] “RFID passport shield failure demonstration,” http://www.flexilis.com/download/RFIDPassportShieldFailureDemonstra tion.pdf, June, 2006. [6] A. Pidwerbetsky and R. Anthony Shober, “Angle of position object location system and method,” United States Patent Reference 6046683, Jan. 2007, http://www.patentstorm.us/patents/7170412-claims.html [7] M. Jo, C.-G. Lim, and E. W. Zimmers, “RFID tag detection on a water content using a back-propagation learning machine,” KSII Trans. Internet and Information Systems, vol. 1, no. 1, pp. 19-32, Dec. 2007. [8] M. Jo and H. Y. Youn, “Intelligent recognition of RFID tag position,” IET Electron. Lett., vol. 44, no. 4, pp. 308-310, Feb. 2008. [9] J.-H. Park and B.-H. Lee, “RFID application model and performance for postal logistics,” LNCS, vol. 4537, pp. 479-484, Aug. 2007. [10] K. Curran, H. Derek, P. Mee, and T. Ian, “An RFID enabled wide area gaming architecture,” in Proc. 4th MiNEVA Workshop in Sintra, Lisboa, Portugal, pp. 43-57, June 2006. [11] C. L. Montgomery, Design and Analysis of Experiments. New York: John Wiley & Sons, 2003. [12] SPSS, http://www.spss.com/spss/index.htm, SPSS Inc., Chicago, IL, USA, 2008.
JO et al.: INTELLIGENT RFID TAG DETECTION USING SUPPORT VECTOR MACHINE
[13] V. N. Vapnik, Statistical Learning Theory. New York: John Wiley & Sons, 1998. [14] V. N. Vapnik, The Nature of Statistical Learning Theory, 2nd ed. New York: Springer-Verlag, 1999. [15] F. Qi, C. Bao, and Y. Liu, “A novel two-step SVM classifier for voiced/unvoiced/silence classification of speech,” in Proc. 2004 International Symposium on Chinese Spoken Language Processing, pp. 7780, Dec. 2004. [16] J. Y. Lai, A. Sowmya, and J. Trinder, “Support vector machine experiments for road recognition in high resolution images,” LNAI 3587, pp. 426-435, 2005. [17] C. Wang, C. Wu, and Y. Liang, “Medicine composition analysis based on PCA and SVM,” LNCS 3612, Springer-Verlag, pp. 1226-1230, 2005. [18] X. Zhang et al., “Application of support vector machines of classification of magnetic resonance images,” International J. Computers and Applications, 2006. [19] R. Duda, P. Hart, and D. Stork, Pattern Classification, 2nd ed. New York: John-Wiley, Section 5.11, 2001. [20] T. Joachims, “Support vector and kernel methods,” SIGIR 2003 Tutorial, Cornell University, 2003. [21] T. Joachims, SVMlight Version 6.01, Department of Computer Science, Cornell University, 2004. [22] C.-W. Hsu et al., “A practical introduction to support vector classification,” Department of Computer Science and Information Engineering, National Taiwan University, 2003. [23] H. Li, S. Wang, and F. Qi, “SVM model selection with VC bound,” LNCS 3314, Springer-Verlag, pp. 1067-1071, 2004. [24] H. Li, S. Wang, and F. Qi, “Minimal enclosing sphere estimation and its application to SVMs model selection,” IEE Intl. Symposium on Neural Networks, 2004. Minho Jo received the B.S. degree in industrial engineering from Chosun University, South Korea, and the Ph.D. degree in computer networks from the Department of Industrial and Systems Engineering, Lehigh University, Bethlehem, PA, U.S.A. in 1994. He worked as a Staff Researcher with Samsung Electronics, South Korea, and was a Professor at the School of Ubiquitous Computing and Systems, Sejong Cyber University, Seoul. He is now a Research Professor at the Graduate School of Information Management and Security, Korea University, Seoul, South Korea. Prof. Jo is Executive Director of the Korean Society for Internet Information (KSII) and Board of Trustees of the Institute of Electronics Engineers of Korea (IEEK), respectively. He is Founding Editor-in-Chief and Chair of the Steering Committee of KSII T RANSACTIONS ON I NTERNET AND I NFORMATION S YSTEMS . He serves as an Editor of IEEE N ETWORK . He is Editor of the J OURNAL OF W IRELESS C OMMUNICATIONS AND M OBILE C OMPUTING, and Associate Editor of the J OURNAL OF S ECURITY AND C OMMUNICATION N ETWORKS published by Wiley, respectively. He serves on an Associate Editor of the J OURNAL OF C OMPUTER S YSTEMS , N ETWORKS , AND C OMMUNICATIONS published by Hindawi. He served as Chairman of IEEE/ACM WiMax/WiBro Services and QoS Management Symposium, IWCMC 2008. Prof. Jo is the TPC Chair of IEEE Vehicular Technology Conference 2010 (VTC 2010-Fall). He is General Chair of International Ubiquitous Conference, and Co-Chair of the International Conference on Ubiquitous Convergence Technology. He is Technical Program Committee of IEEE ICC 2008 & 2009 and IEEE GLOBECOM 2008 & 2009 and TPC Chair of CHINACOM 2009 Network and Information Security Symposium. His current interests lie in the area of wireless sensor networks, RFID, wireless mesh networks, security in communication networks, machine intelligence in communications, WBAN (Wireless Body Area Networks), ubiquitous and mobile computing.
5059
Hee Yong Youn received the B.S. and the M.S. degrees in Electrical Engineering, Seoul National University, in 1977 and 1979, respectively. He received the Ph. D. degree from Computer Science and Engineering, University of Massachusetts at Amherst in 1988. He had been a professor of Univ. of Texas at Arlington until 1999. He is now a Professor of School of Information and Communication Engineering, Sungkyunkwan University, South Korea, and Director of Ubiquitous Computing Technology Research Institute. His research topics include ubiquitous computing, WSN, middleware, and has published more than 200 papers. Among them, he received best paper award from 1988 IEEE Int’l Symp. on Distributed Computing and 1992 Supercomputing, respectively. He is a senior member of IEEE. Hsiao-Hwa Chen is currently a full Professor in Department of Engineering Science, National Cheng Kung University, Taiwan, and he was the founding Director of the Institute of Communications Engineering of the National Sun Yat-Sen University, Taiwan. He received BSc and MSc degrees from Zhejiang University, China, and Ph.D. degree from University of Oulu, Finland, in 1982, 1985 and 1990, respectively, all in Electrical Engineering. He has authored or co-authored over 300 technical papers in major international journals and conferences, five books and several book chapters in the areas of communications, including the books titled Next Generation Wireless Systems and Networks (512 pages) and The Next Generation CDMA Technologies (468 pages), both published by John Wiley and Sons in 2005 and 2007, respectively. He has been an active volunteer for IEEE various technical activities for over 20 years. Currently, he is serving as the Chair of IEEE ComSoc Radio Communications Committee, and the Vice Chair of IEEE ComSoc Communications & Information Security Technical Committee. He served or is serving as symposium chair/co-chair of many major IEEE conferences, including VTC, ICC, Globecom and WCNC, etc. He served or is serving as Associate Editor or/and Guest Editor of numerous important technical journals in communications. He is serving as the Chief Editor (Asia and Pacific) for Wiley’s W IRELESS C OMMUNICATIONS AND M OBILE C OMPUTING (WCMC) Journal and Wiley’s I NTERNATIONAL J OURNAL OF C OMMUNICATION S YSTEMS , etc. He is the founding Editor-in-Chief of Wiley’ S ECURITY AND C OMMUNICATION N ETWORKS journal (www.interscience.wiley.com/journal/security). He is also an adjunct Professor of Zhejiang University, China, and Shanghai Jiao Tong University, China. Professor Chen is a recipient of the Best Paper Award in IEEE WCNC 2008.