Int. J. Advanced Networking and Applications Volume:02, Issue:02, Pages:636-639 (2010)
636
Fire Detection Using Support Vector Machine in Wireless Sensor Network and Rescue Using Pervasive Devices Dr. .M.Mohamed Sathik Associate Professor, Department Of Computer Science, Sadakkathullah Appa College , Tirunelveli E-mail:
[email protected] M.Syed Mohamed Research Scholar, Manonmaniam Sundaranar University, Tirunelveli E-mail:
[email protected] A.Balasubramanian Research Scholar, Manonmaniam Sundaranar University, Tirunelveli E-mail:
[email protected] ----------------------------------------------------------------ABSTRACT---------------------------------------------------------------In the recent days, environment is polluted day by day due to various factors. One of the causes is smokes during the massive fires. Using Wireless Sensor Networks (WSN) fire can be detected earlier and also initiate the rescue operation before it becomes fire. In this paper, we will examine the possibility Support Vector Machine (SVM) for detecting the Fire which has large data sets. It is achieved by using the sketch of classes distribution which is obtained by using Minimum Enclosing Ball(MEB). This approach has many distinctive advantages on dealing with large data sets particularly forest fire data sets. Also, the Support Vector Machine has gained profound interest among the researchers because of its accuracy and the same is extremely important in this Forest Fire context as the cost of misclassification using a classifier is very high. Hence, this approach using multi class Support Vector Machine shows a higher accuracy in detecting the Forest Fire. The experimental result also shows a better accuracy in predicting the Forest Fire. Further, the rescue process will be initiated through the pervasive devices which are placed around the fire sensational area. This process will suppress the fire sensation and protect the field from the fire. We are including an architectural level procedure for implementing the rescue process. Keywords - Multi classification, Large dataset, Pervasive rescue devices, Support Vector Machine, Wireless Sensor Networks, ---------------------------------------------------------------------------------------------------------------------------------------------------------Date of Submission: May 16, 2010 Revised: August 05, 2010 Date of Acceptance: August 27, 2010 ---------------------------------------------------------------------------------------------------------------------------------------------------------I. Introduction
The Forests play a crucial role for sustaining the human environment and Forest fires are among the largest dangers for forest preservation It is widely reported [3] that a total of 77,500 wildfires burned 6,790,000 acres in USA during the year 2004. Hence, it is necessary to detect and predict forest fire more promptly and accurately in order to minimize the loss of Forests, Wild animals and Peoples in the Forest fire. It is a well known fact that the satellite based monitoring is a popular method to detect Forest fire now [5]. But, the very long scan period and low resolution of satellites [1] restrict the use and effectiveness of the satellite based forest fire detection .More over, the difficulty of using Satellites based method is that it can not forecast forest fires before the fire is spread uncontrollable and sometimes the poor weather conditions (e.g. clouds) will seriously decrease the accuracy of satellite-based forest fire detection..Hence, Wireless Sensor Networks are used to forecast forest fire detection. Wireless sensor networks have been used in a variety of
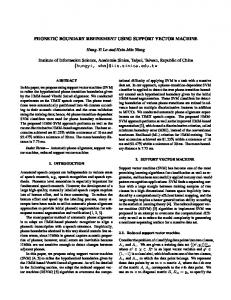
applications such as habitat monitoring, forest fire detection etc, 1.1 Wireless Sensor Network The challenges in the hierarchy of detecting the relevant quantities, monitoring and collecting the data, assessing and evaluating the information, formulating meaningful user displays, and performing decision-making and alarm functions are enormous. The information needed by smart environments is provided by Wireless Sensor Networks,[4] which are responsible for sensing as well as for the first stages of the processing hierarchy. Sensors can be easily deployed using aircraft in large areas like, forest and the main advantage of Sensor Network is that it has selforganizing capabilities. In applications like in forest, running wires or cabling are usually impractical. The architecture of Wireless sensor Network is shown below for forest fire detection. A sensor network is required that is fast and easy to install and maintain. Smart sensors [4]are used which provides extra functions beyond those necessary for generating a correct representation of the sensed quantity including signal conditioning, signal processing, and decision-making/alarm functions. Objectives for smart
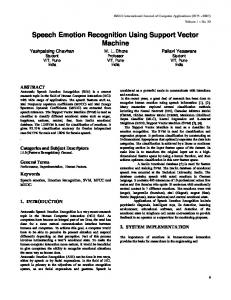
Int. J. Advanced Networking and Applications Volume:02, Issue:02, Pages:636-639 (2010) sensors include moving the intelligence closer to the point of measurement, making it cost effective to integrate and maintain distributed sensor systems. The Wireless Sensor Networks shown in Fig.1 are usually composed of a few sinks and a large quantity of inexpensive, small and efficient sensor nodes which are densely deployed in a forest. Sensor nodes collect measured data (e.g., Temperature, Humidity) and send to their respective cluster nodes that collaboratively process the data by constructing the network. In this paper, we considered Temperature and Humidity only as very high temperature and low humidity are the key factors for forest fire. Wind speed, vegetation type were not considered. 2. Support Vector Machine A Support Vector Machine (SVM) performs classification by constructing an N-dimensional hyper plane that optimally separates the data into two categories. Support Vector Machine (SVM) models are a close cousin to classical multilayer perception neural networks. Using a kernel function, SVM’s are an alternative training method for polynomial, radial basis function and multi-layer perception classifiers in which the weights of the network are found by solving a quadratic programming problem with linear constraints, rather than by solving a non-convex, unconstrained minimization problem as in standard neural network training. 2.1 A Two-Dimensional Example Before considering N-dimensional hyper planes, let’s look at a simple 2-dimensional example. Assume we wish to perform a classification, and our data has a categorical target variable with two categories. Also assume that there are two predictor variables with continuous values. If we plot the data points using the value of one predictor on the X axis and the other on the Y axis we might end up with an image such as shown below. One category of the target variable is represented by rectangles while the other category is represented by ovals as shown in Fig.2.In this example, the cases with one category are in the lower left corner and the cases with the other category are in the upper right corner; the cases are completely separated. The SVM analysis attempts to find a 1-dimensional hyper plane (i.e. a line) that separates the cases based on their target categories.
Sensors Cluster Header
Sink Manager Node
Fig 1Architecture of Wireless Sensor Network
637 There are an infinite number of possible lines; two candidate lines are shown in Fig 2. The question is which line is better, and how do we define the optimal line.
Fig 2 Groups of Classification The dashed lines drawn parallel to the separating line mark the distance between the dividing line and the closest vectors to the line. The distance between the dashed lines is called the margin. The vectors (points) that constrain the width of the margin are the support vectors. The following Fig.3 illustrates this.
. Fig 3 Margin of Support Vectors. An SVM analysis finds the line (or, in general, hyper plane) that is oriented so that the margin between the support. 3.MULTI-CLASSIFICATION USING CLASSES DISTRIBUTION The problem of multi-classification for SVM, does not present an easy solution. In order to apply SVM to multi classification problems, it is necessary to change the problem to multiple binary classification problems. There are two popular approaches to solve the multi-class classification based in SVM. 1) “one versus one” method (OVO). This method constructs 0.5 k(k-1) hyper planes for k-class problem , where each one is trained with just two-class data sets. 2) “one versus all” method (OVA). This algorithm constructs k hyper planes for k-class problem. The i-th hyper plane is trained with the samples between the i-th class and the rest data. After the multi-hyper planes are obtained, a test sample is labeled by means of maximum output among the k hyper planes (classifiers). There different methods to measure the maximum output, the principal difference between them is how to fuse together all classifiers.
Int. J. Advanced Networking and Applications Volume:02, Issue:02, Pages:636-639 (2010) 3. 1 BINARY-CLASS SVM ALGORITHM Firstly, we select a predefined number of data from the original data set using a random selection method, and these selected data are used in the first stage SVM to obtain approximate support vectors. Secondly, the algorithm detects the closest support vectors (SVs) with different class labels and constructs a ball from each pair of SVs with different label using minimum enclosing ball method. Then the points enclosed in these balls are collected, we call this process data recovery, and these recovered data constitute the class distribution which will be used to train the final SVM classification algorithm. Thirdly, the second stage SVM is applied on recovery data to get a more precise classification result. 3.1.1 SELECTING INITIAL DATA: After random selection, we denote the data set of selected samples as C. We may divide C into two subsets, one contains positive labels, and the other contains negative labels 3.1.2 THE FIRST STAGE SVM CLASSIFICATION: In the first stage SVM classification we use SVM classification with SMO algorithm to get the decision hyper plane 3.1.3 DATA RECOVERY: Note that, the original data set is reduced significantly by random selection. In the first stage SVM classification, the training data set is only a small percentage of the original data. This may affect the classification precision, i.e., the obtained decision hyper plane cannot be precise enough, a refined process is necessary. However, at least it gives us a reference on which data can be eliminated. Some useful data hasn’t been selected during the random selection stage. So, a natural idea is to recover those data which are located between two support vectors with different label, and using the recovered data to make classification again. Firstly, we propose to recover the data by using a set pairs of support vectors with different label, where each chosen pair has the minimum distance allowed (mda) between each pair. In this way, the algorithm finds the minimum distance (md) between two support vectors with different label and calculate the mda. Secondly, we construct the balls using core sets from each pair of support vectors and we use this balls in order to catch all the data points (near of classification hyper plane) contained in the original input data set. 3.1.4 THE SECOND STAGE SVM CLASSIFICATION: Taking the recovered data as new training data set, we use again SVM classification with SMO algorithm to get the final decision hyper plane. Note that, the original data set is reduced significantly by random selection and the first stage SVM. The recovered data should consist of the most useful data from the SVM optimization viewpoint, because the data far away from the decision hyper plane has been eliminated. On the other hand, almost all original data near the hyper plane are included by our data recovery technique, the hyper plane should be an approximation of the hyper plane of an normal SMO with all original training data set.
638 4. PERFORMANCE ANALYSIS The Table 1 shows the performance analysis of MEB approach. Out of 50,000 samples, our approach using MEB gives 99.9% accuracy in 93.6 seconds and for 1,00,000 samples the accuracy remains the same compared to LIBSVM and Simple SVM. For 10,00,000 samples , our approach using MEB overrides other because of high training and testing time. our approach
#
t
50,0 00 1,00, 000 5,00, 000 10,0 0,00 0
Acc
93.6
99.9
145
99.9
316
99.9
517
99.9
LIBSVM
t 46.5 7 ---
Simple SVM
t
Acc 99.9 ---
--
107. 91 257. 91 685. 6 --
Acc 99.9 99.9 99.9
--
--
t = time in seconds, Acc = accuracy Table 1 Performance of Classifiers 5. RESCUE OPERATION ARCHITECTURE
Fig 4 Hybrid architecture of Early Fire Detection. If any event occurs ( Changes in the fire attributes / Ignition of fire ) that information is received by the nearest sensors and the report is transferred via MOTE to the base station. Base station receives the data and analyzes the report with the existing statistics as shown in Fig.4. If it is the threat, the rescue devices deployed around the field nearest to the event will be initiated through mobile devices and also send the rescue forces to event location. The rescue devices will immediately start the rescue operation to suppress the sensation of fire / fire. 6. CONCLUSION In this paper we present a novel multi SVM classification on approach for large data sets using classes distribution. In order to reduce SVM training time for large data sets, one fast first stage of SVM is introduced to reduce training data. A minimum enclosed ball process overcomes the drawback that only parts of the original data near the support vectors are trained.
Int. J. Advanced Networking and Applications Volume:02, Issue:02, Pages:636-639 (2010) Experiments done with several large synthetic and real world data sets, show that the proposed technique has great advantage when the input data sets are very large. The rescue operation through pervasive devices starts the rescue operations immediately after the identification of threat. So, these devices will suppress the fire sensation before it excels into fire. REFERENCES [1] http://modis.gsfc.nasa.gov/, MODIS Web. [2] http://www.nifc.gov / fireinfo / 2004 / index.html, “ Wild Land Fire Season 2004 Statistics and Summaries,” National Interagency Coordination Center. [3]http://www.wrh.noaa.gov/sew/fire/olm/nfdrs.htm, “National Fire Danger Rating System.” [4] I.F. Akyildiz, W. Su, Y. Sankarasubramaniam, and E. Cayirci, “Wireless sensor networks: a survey,” Computer Networks, vol. 38, no. 4, pp. 393- 422, March, 2002. [5] Z. Li, S. Nadon, J. Cihlar, “Satellite detection of Canadian boreal forest fires: development and Zpplication of the algorithm,” International Journal of Remote Sensing, vol. 21, no. 16, pp. 3057-3069, 2000. [6] Jair Cervantes, Xiaoou Li, Wen Yu “Multi-Class SVM for Large Data Sets Considering Models of Classes Distribution” [7]. P. Kumar, J. S. B. Mitchell, and A. Yildirim. “Approximate minimum enclosing balls in high dimensions using core-sets,” ACM Journal of Experimental Algorithmics, 8, January 2003. [8] J.Platt, “Fast training of support vector machine using sequential minimal optimization,” Advances in Kernel Methods: support vector machine, MIT Press, Cambridge, MA, 1998. [9]. P. Kumar, J. S. B. Mitchell, and A. Yildirim. “Approximate minimum enclosing balls in high dimensions using core-sets,” ACM Journal of Experimental Algorithmics, 8, January 2003 [10]http://www.nellai.info/projects/data.htm [11] IvorW. Tsang ,James T. Kwok “Very Large SVM Training using Core Vector Machines” [12] Jair Cervantes, Xiaoou Li , Wen Yu “ Multi-Class SVM for Large Data Sets Considering Models of Classes Distribution”
639