Hydrogen reduction of lunar regolith has been proposed as a viable ... detail with lunar regolith simulants such as JSC-1A by NASA and other organizations.
47th AIAA Aerospace Sciences Meeting Including The New Horizons Forum and Aerospace Exposition 5 - 8 January 2009, Orlando, Florida
AIAA 2009-1389
Development and Validation of a Model for Hydrogen Reduction of JSC-1A U. Hegde 1 and R. Balasubramaniam 2 National Center for Space Exploration Research, Cleveland, Ohio, 44135 S. Gokoglu 3 NASA John H. Glenn Research Center, Cleveland, Ohio, 44135
Hydrogen reduction of lunar regolith has been proposed as a viable technology for oxygen production on the moon. Hydrogen reduces FeO present in the lunar regolith to form metallic iron and water. The water may be electrolyzed to recycle the hydrogen and produce oxygen. Depending upon the regolith composition, FeO may be bound to TiO2 as ilmenite or it may be dispersed in glassy substrates. Some testing of hydrogen reduction has been conducted with Apollo-returned lunar regolith samples. However, due to the restricted amount of lunar material available for testing, detailed understanding and modeling of the reduction process in regolith have not yet been developed. As a step in this direction, hydrogen reduction studies have been carried out in more detail with lunar regolith simulants such as JSC-1A by NASA and other organizations. While JSC1A has some similarities with lunar regolith, it does not duplicate the wide variety of regolith types on the moon, e.g., it contains almost no ilmenite. Nonetheless, it is a good starting point for developing an understanding of the hydrogen reduction process with regolith-like material. In this paper, a model utilizing a shrinking core formulation coupled with the reactor flow is described and validated against experimental data on hydrogen reduction of JSC-1A. Nomenclature c c1
= =
molar concentration of hydrogen in particle (moles/m3) molar concentration of water (moles/m3)
cs cx
=
molar concentration of hydrogen at reaction surface (moles/m3)
=
molar concentration of hydrogen at location x in reactor (moles/m3)
c0
=
D ΔH k L N P r rp rs Rr t tD tR
= = = = = = = = = = = = =
molar concentration of hydrogen at upstream end of regolith bed (moles/m3) effective gas diffusion coefficient (m2/s) endothermic heat of reaction (Joules/mole) equilibrium constant length of regolith bed (m) number of regolith particles in the bed gas pressure (Pa) regolith particle radial coordinate (m) regolith particle radius (m) radius of reaction surface (m) internal radius of reactor (m) time (s) intra-particle diffusion time (s) reactor residence time (s)
1
Principal Researcher, Mail Stop 110-3, Associate Fellow AIAA Research Associate Professor, Mail Stop 110-3 3 Senior Scientist, Mail Stop 77-5 1 American Institute of Aeronautics and Astronautics 2
Copyright © 2009 by the American Institute of Aeronautics and Astronautics, Inc. The U.S. Government has a royalty-free license to exercise all rights under the copyright claimed herein for Governmental purposes. All other rights are reserved by the copyright owner.
T = u = Vbed =
temperature (K) velocity through reactor (m/s) volume of regolith bed (m3)
Vvoid= x = α = ε = ρa =
void volume in regolith bed (m3) axial coordinate (m) particle conversion void fraction in regolith bed molar concentration of FeO in regolith (mol/m3)
I. Introduction major objective of lunar in-situ resource utilization (ISRU)1-3 is production of oxygen from lunar regolith. Mare basalts containing oxygen include olivine, ilmenite, and pyroxene.4 Energy has to be supplied to remove the oxygen, i.e., the associated chemical reactions are endothermic. Free energy considerations show that the iron containing minerals require the least energy input for this purpose.5 Various technologies have been proposed for the chemical conversion. These include ilmenite reduction by hydrogen, molten electrolysis, and carbothermal reduction using methane.6,7 The reduction processes involve solid-gas reactions. Such systems are well developed for earth applications but mainly for the purpose of metal extraction, as opposed to water vapor and oxygen extraction for lunar applications. In addition, in the lunar context, the reactor must interface with the other sub-system processes such as upstream regolith extraction and beneficiation and downstream electrolysis and phase separation in a way that establishes the most favorable balance between efficiency, robustness, and equivalent system mass. A need exists, therefore, to establish an analytical framework to couple these sub-systems together. The building blocks of this framework are the individual sub-system models. This paper discusses the development and validation of a generalized analytical model of the chemical reactor sub-system. While the developed methodology should be applicable to different gas-solid reactors, only the reduction of FeO by hydrogen will be considered here. FeO occurs in lunar regolith as ilmenite, particularly in titanium-rich mare basalts, or may be found dispersed in the glassy phase of lunar regolith particles. The overall gas-solid reaction considered between FeO and hydrogen is given by:
A
FeO + H 2 ⇔ Fe + H 2O
(A)
The formed water is electrolyzed in the electrolyzer subsystem to produce oxygen. The temperature of the reaction is one of the important parameters of the process. The sintering and melting temperature of lunar regolith is noted to be in the range of 1370-1670 K.6,8 However, hydrogen reduction has been found to be effective at lower temperatures also, e.g., in the range of 970-1270 K.9 Therefore, while three-phase (gas-liquid-solid) reactors for hydrogen reduction may be applicable at post-melt temperatures, these are not considered here and attention is restricted to gas-solid interactions. The equilibrium characteristics of the above reduction reaction have been studied to some extent. An expression for the equilibrium constant as a function of the reaction temperature alone has been provided:10
k = 10( −2126.1 / T + 0.6439)
(1)
More recently, computational studies have suggested a pressure dependence of the equilibrium constant11 but the pressure sensitivity has been found to be much less than the temperature sensitivity. This is reasonable since gasphase moles are conserved in the reaction. The reaction rate and chemical kinetics of the reduction process appear to be much less studied. There is consensus that the reaction rate is of Arrhenius type and an activation energy for the forward reaction has been estimated as 18.8 kcal/mole.12 As noted earlier, the conversion is endothermic and energy needed for conversion, ΔH, has been estimated to be 11kJ/mol.9 According to Eq. (1), the equilibrium constant for the temperature range of interest is of the order of 0.1. This suggests that substantial excess hydrogen beyond the stoichiometric value is needed to completely reduce the regolith. Therefore, a closed system where a batch of regolith and a fixed amount of hydrogen are placed in a vessel and allowed to react is not practical because of the large volume of hydrogen required to provide the needed oxygen 2 American Institute of Aeronautics and Astronautics
for realistic regolith batch amounts. Thus, an open system where a batch of regolith is treated with flowing hydrogen is considered here. Some hydrogen reduction testing of Apollo-returned samples have been conducted. However, the amount of lunar regolith available for testing and analysis is restricted so that a detailed understanding of the various processes involved has not been developed. To get around this restriction, NASA has developed different regolith simulants from earth-based soils. A comparison of available simulants with some of the Apollo-returned samples has been provided.13 Recently, NASA-sponsored hydrogen reduction studies have been conducted with the simulant JSC-1A. JSC-1A has an FeO content of 11.2% by weight of simulant which would result in 2.8% water upon complete conversion with hydrogen.13 The primary objective of this paper is to develop and validate a model of the hydrogen reduction process. A model was previously formulated by the authors14 in terms of the following overall steps: (i) inflow of pure hydrogen into the regolith containing reactor, (ii) reaction of hydrogen with the FeO portion of the regolith, and (iii) outflow of left-over hydrogen and produced water vapor. Step (ii) is the gas-solid reaction step which is the key to the conversion. Results of regolith particulate analysis conducted on Apollo-returned samples6 suggest that the particles are not completely solid but have some porosity that would enable gases to diffuse into the particles, i.e., the FeO portion can be essentially completely converted with the reduced iron remaining behind in the particulates. It may also be noted that JSC-1A has a large glass content with FeO dispersed in the glass phase. The diffusion of gases in the glass phase is expected to be the controlling feature for the reduction process. These observations support utilization of a “shrinking core” diffusion-reaction model15 for the gas-solid reduction process. This model is then coupled with the inflow/outflow of gases to complete the reactor sub-system model. In this paper, the model is considered first and a closed-form expression for the FeO conversion is obtained for the case of a well-stirred reactor. Two key parameters appear in the expression: (i) a diffusion time related to the diffusion of gases in the interior of the regolith particles, and (ii) a residence time of the gases in the reactor. It is found that for high levels of conversion or for a relatively small ratio of residence time to diffusion time, the governing parameter is the diffusion time. Validation experiments have been carried out at Pacific Northwest National Laboratory (PNNL)16 and at Lockheed Martin (LM)17 and are briefly described in Section 3. A factor F defined in Section 2 which is related to the diffusion times for different particle sizes is derived from the PNNL data in conjunction with the model. Following this step, the obtained factor F is input to the model and used to predict the conversion rates in the LM experiments. Although the LM experiments are at significantly larger scale than the PNNL experiments, the comparison of model results with the LM experiments is remarkably good.
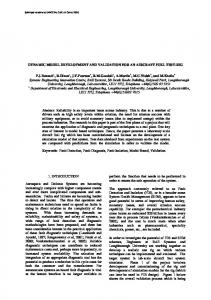
II. Model Description The shrinking core model as envisioned here is schematically depicted in Fig. 1. Conversion proceeds from the exterior particle surface inward. As the reaction progresses into the interior of the particle, the reactant and product gases must diffuse through the particle matrix structure formed after the conversion.
Unreacted core Radius of reaction surface, rs(t)
Particle radius, rp Figure 1. Shrinking core model configuration
3 American Institute of Aeronautics and Astronautics
The diffusion of hydrogen in the particle interior between rp and rs is considered. Assuming quasi-steady behavior, and an effective diffusion coefficient, D, for the gases in the interior particle matrix, the concentration, c, of hydrogen varies according to
∂ 2 ∂c (r D ) = 0 ∂r ∂r
(2)
Boundary conditions for c have to be provided at the core (reaction) surface radius, rs, and at the exterior particle radius, rp. Note that the particle typically preserves its original (unreacted) size even during the reaction process as the main constituents (i.e., the non-FeO portion) are largely unaffected. The hydrogen flux is related to the conversion of FeO at the reaction surface. With ρa being the molar concentration of FeO in the unreacted particle, the conversion of FeO by the flux of hydrogen is given by
d 4 ∂c ρ a πrs3 = 4πrs2 D ] rs dt 3 ∂r Solving for rs yields
3[1 − α ]2 / 3 − 2[1 − α ] − 1 = −
(3)
6 D[c x − cs ]t ρ a rp2
(4)
where α is defined as .
α = 1−
3 s 3 p
r r
(5)
For an inwardly directed diffusive flux of hydrogen to exist within the reacted portion of the particle matrix, the value of [cx - cs] must be greater than zero. Assuming that the rate of gas diffusion in the particles is much slower than the reaction rate, hydrogen and water may be taken to be in equilibrium at the reaction surface resulting in the following relationship:14
cs =
c0 (1 + k )
(6)
It is assumed that the regolith particles form a bed in the reactor. The packing of the particles is characterized by the linear loading, N/L, of the particles. For example, the loading for a packed bed will be greater than that for a fluidized bed. It is assumed that the gas flow through the bed is characterized by a bulk flow velocity, u and the species (i.e., hydrogen or water) concentration is a function of only the distance along the bed length, x. The hydrogen concentration, cx, is a function of x due to depletion by the reaction. Neglecting inter-particle gas diffusion in the bulk flow, the convection of hydrogen is related to its depletion by reaction in the following manner:
πRr2 u
∂c x ∂c N = 4πrs2 D( ) rs ∂x ∂r L
(7)
In the well-stirred reactor, both the gas species concentrations and α are independent of location. The value of cx may then be identified with c(L) and the solution of Eq. (7) in conjunction with Eqs. (5) and (6) yields:
4 American Institute of Aeronautics and Astronautics
c( L) =
c0 {1 + 1+ k
k
} D [1 − α ] L [1 + 3(1 − ε )( 2 ) ] rp [1 − (1 − α )1 / 3 ] u
(8)
1/ 3
and, correspondingly, the water concentration at the outlet is given by
c1 ( L) =
kc0 {1 − 1+ k
1
} D [1 − α ] L [1 + 3(1 − ε )( 2 ) ] rp [1 − (1 − α )1 / 3 ] u
(9)
1/ 3
where ε is the bed void fraction. The equation for α is obtained by substituting Eq. (8) for cx in Eq. (4):
3[1 − α ]2 / 3 − 2[1 − α ] − 1 = −
Ft D [1 − α ]1 / 3 L ] [1 + 3(1 − ε )( 2 ) rp [1 − (1 − α )1/ 3 ] u
(10)
where, the factor F is given by
F =6
c0
k D ρ a (1 + k ) rp2
(11)
For the case when the residence time, L/u, of the gases is small compared to the diffusion time, rp2/D, of gases in the particle matrix the equation for α becomes
3[1 − α ]2 / 3 − 2[1 − α ] − 1 = − Ft
(12) It may be noted that the time required for high conversion (i.e., as α approaches unity) is also given by Eq. (12). In practice, this means that unless the residence time is large compared to the diffusion time, the time for complete conversion is governed only by the diffusion time of the gases inside the particles. This implies that the factor F is a characteristic descriptor of the reduction process. Examination of the expression for F allows for the following observations: (a) F has units of s-1 (b) the equilibrium constant is for Reaction (A) which is, presumably, not simulant dependent (c) the FeO concentration, ρa, is simulant dependent but should be relatively invariant from sample to sample of the same simulant (d) the hydrogen concentration, c0, in the reactor is a parameter of the experiment and is operator dependent; it is a function of the reactor pressure, P, and temperature, T (e) the particle size, rp, is an effective particle radius. There is generally no ambiguity about particle size for a relatively narrow size range; however, when the particle size range is broad, experiments need to be done to characterize the effective particle size. One way of doing this is to compare the conversion time for a wellcharacterized particle size with that of the size sample of interest as will be noted in Section IV below (f) if the factors in (a) –(d) above are known, then F may be directly related to D, the effective diffusion coefficient of the gases in the particle by Eq. (11).
III. Validation Experiments Results from the developed model have been compared with data provided by NASA. Two sets of experiments were considered: (i) The first set of experiments was conducted at PNNL16 in a tube reactor of internal diameter 1.64 cm and placed in an oven heated to the desired temperature. The simulant batch size was 5 grams. Argon was flowed through the sample during the heating process and served to remove any trapped moisture in the sample. Upon reaching the desired temperature, the flow of argon was turned off, and the hydrogen flow was established. During the reduction process both the hydrogen flow and temperature were kept constant. Experiments were conducted for two flow rates of hydrogen (equivalent to 0.5 cm/s and 1 cm/s velocity under standard conditions), 5 American Institute of Aeronautics and Astronautics
and for reduction temperatures in the range of 800 -1000 C. The reduction time was approximately 4 hours in most cases. In order to investigate JSC-1A particle size effects, tests were conducted with particles sieved for three different sieve sizes as well as with unsieved JSC-1A. The test matrix is shown in Table 1 where the test points are numbered as in the original PNNL report for traceability.
Run #
Sorting
Temp deg C
Gas Velocity (std cm/s)
74
none
1000
1.0
76
none
900
1.0
77
none
800
1.0
80
none
900
0.5
81
none
1000
0.5
82
none
800
0.5
87
>400 mesh
1000
0.5
88
>400 mesh
1000
0.5
90
200-400 mesh
1000
0.5
91 60-115 mesh 1000 0.5 Table 1. PNNL test matrix. 400 mesh = 38 microns.], 200 mesh = 75 microns, 115 mesh = 106 microns, and 60 mesh = 250 microns.
The PNNL test results were used primarily to assess whether the model captured the reduction process and water production rate characteristics and to obtain quantitative values for the factor F. (ii) The second set of experiments were conducted by LM in a rotating reactor configuration.17 The reactor section was cylindrical with an inner diameter of approximately 15 cm and length of approximately 25 cm. The simulant (unsieved JSC-1A) loading was 1.5 kg/batch . The reactor and simulant were brought up to temperature by external heating. Gas flow was provided through a central tube. The inlet flow was impacted onto a plate and suitable placement of the exhaust tube in conjunction with reactor rotation appeared to mix the gas well with the regolith. The rotation rate of the reactor was a few rotations per second. Argon was flowed during the heat up to remove any trapped moisture. Subsequently, the inert gas flow was turned off and the hydrogen flow (3- 5 slpm) was turned on. The LM test results were used to validate the model quantitatively using the value of F obtained from the PNNL experiment set.
IV. Results and Discussion A. PNNL Data Analysis The PNNL data in conjunction with the model are utilized to investigate the effects of particle size, temperature,
Figure 2. Measured and model predicted conversion vs. time for JSC-1A sub-400 mesh particles at 1000 C.
6 American Institute of Aeronautics and Astronautics
and velocity and obtain quantitative values for the factor F (See Eqns. (11) and (12)) . 1) Baseline Results First consider the data from Runs 87 and 88 of the PNNL matrix as a baseline. The two test points are essentially the same given the statistical nature of the particle sizes and shapes and serve to verify the repeatability of the results. In addition, these tests utilize the smallest particle sizes and the highest temperature (1000 C) in the test matrix and are expected to take the least time for complete conversion. In Fig. 2, a conversion of unity represents a water production of 2.8% by mass of the simulant sample, as noted earlier. These small particles are all reduced completely in the reaction time of about four hours. Equation (12) is used to find a fit for F that recovers the behavior of the conversion vs time curve during the latter stages of the reduction process. A good fit for the two sets of data is given by F = (1/15,000) s-1. Using this value of F, the model prediction for the conversion is also plotted as a function of time and compared to the experimental results for Runs 87 and 88 in Fig. 2. It is seen that with this value of F, Eq.(12) Figure 3. Measured conversion vs. time for JSC-1A somewhat overpredicts the conversion initially but the particles of different sizes at 1000 C. conversion after a time of approximately 45 minutes is captured very well. For the small particle sizes used here, the first 45 minutes represents a conversion of about 0.6. The difference between the model and tests 87 and 88 is less than 5% at later times. 2) Effects of Particle Size Tests 88 (< 38 microns sieve), 90 (38-75 microns sieve), and 91 (106-250 microns sieve) provide information on conversion times at the same temperature (1000 C) for different particle sizes (i.e., effective particle diameters). The experimentally obtained values of conversion vs time for the different sizes are plotted in Fig. 3. As is clearly seen, the conversion at a given time is less as the particle size increases. The values of the factor F for the larger sizes (Runs 90 and 91) may be obtained from fitting of the conversion vs time curve as before (e.g., see Fig. 4 for the case of Run 91) and are found to be: F = (1/58,400) s-1 (for Run 90) (1/175,550) s-1 (for Run 91) Other than the particle size, the test conditions are identical. Thus, the above variation in F is caused by changes in the particle size alone. The effective particle sizes for Run 90 and 91 may be estimated from the experimentally derived values of F and from Eq. (11) by noting that the only Figure 4. Measured and model predicted conversion vs. time variable in these tests is the particle radius rp. It is for JSC-1A 60-115 mesh particles at 1000 C. found that for Run 90, the effective particle size is 2.0 times the effective particle size for Run 88 (and Run 87) and for Run 91 it is 3.4 times the effective particle size for Run 88. For example if we let the effective 7 American Institute of Aeronautics and Astronautics
particle size for Run 88 be 38 microns ( the largest value allowed by the corresponding mesh), then, according to the model, for Run 90 it is 76 microns and for Run 91 it is 129 microns. The value of 76 microns for Run 90 is practically coincident with the upper size for the mesh. However, the value of 129 microns is smaller than the 250 microns upper size for the corresponding mesh. It is possible that the larger particle sizes in the simulant deviate appreciably from spherical allowing for a smaller characteristic size. 3) Results for Unsieved JSC-1A at 1000 C Run 81 has the same conditions as Runs 87, 88, 90 and 91 except it is conducted with unsieved JSC-1A. By fitting Eq. (12) to the data, we can get a value for the factor F for unsieved JSC-1A at 1000 C which can be related to the effective particle size of the unsieved simulant. The value of F is found to be F = (1/90,000) s-1 for Run 81 4) Effects of Temperature and Velocity Runs 81, 80, and 82 have been conducted with unsieved simulant but with different temperatures, i.e., 1000 C, 900 C, and 800 C, respectively, with a flow rate of 0.5 cm/s (evaluated at standard conditions). Runs 74, 76 and 77 are duplicates of the previous runs except that the flow velocity is increased to 1 cm/s (evaluated at standard conditions). Figures 5 and 6 plot the conversion as a function of time for two of the temperatures (900 C and 800 C, respectively) and for both the 0.5 cm/s and 1.0 cm/s cases. Also plotted in the figures are the corresponding fits from the model. The following values of F are obtained: F = (1/90,000) s-1 for 1000C (1/150,000) s-1 for 900 C (1/430,000) s-1 for 800 C.
Figure 5. Measured and model predicted conversion of unsieved JSC-1A particles at 900 C for two different hydrogen flow rates.
It is clear from the data that as the operating temperature is reduced, the conversion in a given amount of time is also reduced. Initially, the higher flow rate results in a higher conversion rate. However, after 1 – 2 hours, the higher flow rate and lower flow rates yield essentially the same conversion in agreement with the model. 5) Fit for F An Arrhenius fit for F, i.e., a linear relationship between log(F) and 1/T where T is the operating temperature in degrees Kelvin, may be derived from the PNNL data. One of the reasons for employing an Arrhenius fit is that the factor F contains the equilibrium constant k which has in the past10 been fitted by an Arrhenius expression. The equation for F is found to be
log( F ) = −
10761 − 2.8808 T
Figure 6. Measured and model predicted conversion of unsieved JSC-1A particles at 800 C for two different hydrogen flow rates.
(13)
8 American Institute of Aeronautics and Astronautics
and it is plotted in Fig. 7. An approximate error band (+/- 7%) in log(F) based upon the spread in the data is also shown in Fig. 7. This is equivalent to approximately +/- 20% error in F B. LM Data and Model Validation The LM data have been obtained in a much larger scale setup than the PNNL data, as noted earlier. However, all of the factor parameters that control the factor F are the same for both setups. The only exception is that some of the LM tests have been conducted at temperatures lower than 800 C which was the lowest temperature for the PNNL tests. The equation for the factor F (Eq. (13)) is strictly valid in the 1273 K 1173 K 1073 K range of 800 C – 1000 C which is the Figure 7. Arrhenius fit for the factor F for unsieved JSC-1A in temperature range of the PNNL experiments. range of 800 C1000 C (i.e., 1073 K 1273 K). the temperature The LM experiments which are in this temperature range are categorized as in-range and those at lower temperatures are categorized as out-of-range. Both categories are considered in the following discussion. 1) In-Range Predictions In-range LM data are available at temperatures of 970 C, 950 C, 925 C, 900 C, and 800 C. Figures 8-12 compare the model predictions of conversion vs time with the measured data. As before, a conversion of unity represents 2.8% water yield. Predictions are made using values of F at the higher and lower error bars. With the exception of some discrepancy at later times for the 900 C and 925 C cases, the “in-range” LM data are in very good agreement with the model predictions. It may also be noted that the predictions at earlier times in the conversion process appear to agree better with the LM data than with the PNNL data. This may be due to better mixing of hydrogen with the simulant in the rotating reactor configuration as compared to the tube reactor which may lead to decreased effects of residence time (see Eqns. (10) –(12)). Figure 8. Measured and predicted conversion vs. time for unsieved JSC-1A at 970 C.
9 American Institute of Aeronautics and Astronautics
Figure 9. Measured and predicted conversion vs. time for unsieved JSC-1A at 950 C.
Figure 11. Measured and predicted conversion vs. time for unsieved JSC-1A at 900 C.
Figure 10. Measured and predicted conversion vs. time for unsieved JSC-1A at 925 C.
Figure 12. Measured and predicted conversion vs. time for unsieved JSC-1A at 800 C.
10 American Institute of Aeronautics and Astronautics
2) Out-of-Range Predictions Out-of-range LM data are available for temperatures of 700 C and 600 C. For lack of any alternatives, the Arrhenius fit for F (Eq.(13)) is used. Model comparisons with the LM data are shown in Figs. (13) and (14). It is seen that the agreement remains good at 700 C. However, at 600 C, the model with the assumed fit for F underpredicts the results. It is possible that there may be temperature variations in the reaction rate and F which are not captured by the model or the Arrhenius fit at this temperature. Note that experiments show that 600 C appears to be a lower temperature limit for measurable hydrogen reduction of JSC-1A.16,1
Figure 13. Measured and predicted conversion vs. time for unsieved JSC-1A at 700 C.
V. Conclusion A model has been developed for hydrogen reduction of JSC-1A and validated against data from two separate investigations with vastly different experimental scales. It is shown that a single factor, F, related to the gas diffusion coefficient inside the particle, controls the conversion rate at high conversion fraction or for small gas residence time in the regolith bed. Decreasing the particle size and increasing the reaction temperature both result in more rapid conversion under these conditions. An Arrhenius fit for the factor F has been obtained and shown to be accurate in the temperature range of 700 C- 1000 C (i.e., 973K -1273 K). The developed model can serve as a starting point for understanding the hydrogen reduction process for various types of lunar regolith but experimental data will be required to obtain the factor F for these regolith types. This model is also useful for overall hydrogen reduction system studies and optimization.
Figure 14. Measured and predicted conversion vs. time for unsieved JSC-1A at 600 C.
Acknowledgments The authors gratefully acknowledge the support of this work by the In-Situ Resource Utilization Project which is a part of the NASA Exploration Technology Development Program. U. Hegde and R. Balasubramaniam were supported under NASA Contract No.NNC08BA08B with the National Center for Space Exploration Research. The authors greatly appreciate the encouragement and insights offered by K. Sacksteder and D. Linne of NASA Glenn Research Center, and useful discussions with E. Santiago-Maldonado of NASA Kennedy Space Center during the course of this work. The authors also thank T. Simon of NASA Johnson Space Center who monitored and arranged for access to the PNNL and Lockheed Martin data which were critical for the model validation efforts.
References 1
Sanders, G. B., Larson, W. E., Sacksteder, K. R., and Mclemore, C., “NASA In-Situ Resource Utilization (ISRU) ProjectDevelopment & Implementation,” AIAA Paper No. 2008-7853, AIAA SPACE 2008 Conference & Exposition, San Diego, California, September 2008.
11 American Institute of Aeronautics and Astronautics
2 Larson, W. E., Sanders, G. B., Sacksteder, K. R., Simon, T. M., and Linne, D. L., “NASA’s In-Situ Resource Utilization Project: A Path to Sustainable Exploration,” IAC-08-A3.2.B13, International Astronautical Congress, Glasgow, Scotland, October 2008. 3 Sanders, G. B., Larson, W. E., Sacksteder, K. R., Simon, T. M., and Linne, D. L., “Open Architecture for Lunar Surface Systems-Challenges & Opportunities In Design, Integration, And Partnerships,” IAC-08-D3.2.1, International Astronautical Congress, Glasgow, Scotland, October 2008. 4 Heiken, G. H., Lunar Sourcebook, Cambridge University Press, NY, 1991. 5 Taylor, L. A., and Carrier, W. D. III, “Production of Oxygen on the Moon: Which Processes are Best and Why,” AIAA Journal, 30, (12), 2858-2863, (1992). 6 McKay, D. S., and Allen, C. C., “Hydrogen Reduction of Lunar Materials for Oxygen Extraction on the Moon,” AIAA Paper No. 96-0488, American Institute of Aeronautics and Astronautics, Washington, DC, 1996. 7 Rice, E.E., Hermes, P. A., and Musbah, O. A., “Carbon Based Reduction of Lunar Oxides for Oxygen Production,” AIAA Paper No. 97-0890, American Institute of Aeronautics and Astronautics, Washington, DC, 1997. 8 Chambers, J. G.,“Quantitative Mineralogical Characterization of Lunar High-Ti Mare Basalts and Soils for Oxygen Production,” Journal of Geophysical Research, 100, 14391-14401, (1995). 9 Yoshida, H., Watanabe, T., Kanamon, H., Yoshida, T., Ogiwara, S., and Eguchi, K.,“Experimental Study on Water Production by Hydrogen Reduction of Lunar Soil Simulant in a Fixed-Bed Reactor,” in Proceedings of Space Resources Roundtable II, Golden, Colorado, 2000. 10 Williams, R. J., and Erstfeld, T. E., “High Temperature Electrolyte Recovery of Oxygen from Gaseous Effluents from the Carbochlorination of Lunar Anthracite and the Hydrogenation of Ilmenite: A Theoretical Study,” NASA TM 58214, NASA, Washington, DC, 1979. 11 Altenberg, B. H., Franklin, H. A., and Jones, C. H.,“Thermodynamics of Lunar Ilmenite Reduction,” in Proceedings of the XXIV Lunar and Planetary Science Conference, Lunar and Planetary Institute, Houston, TX, 1993, pp. 27-28. 12 Butler,E. E., Debelak, K. A., and Roth, J. A., “Kinetics of Ilmenite (FeTiO3) Reduction with Hydrogen,” in Proceedings of Space Resources Roundtable III, Golden, Colorado, 2001. 13 Hill, E., Mellin, M. J., Deane, B.,Liu, Y., and Taylor, L. A., “Apollo Sample 70051 and High-and Low-Ti Lunar Soil Simulants MLS-1A and JSC-1A: Implications for Future Lunar Exploration,” Journal of Geophysical Research, 112, E02006, doi:10.1029/2006JE002767, 2007. 14 Hegde, U., Balasubramaniam, R., and Gokoglu, S., “Development of a Reactor Model for Chemical Conversion of Lunar Regolith,” Proceedings of the Space Technologies and Applications International Forum, Albuquerque, New Mexico, February 2007. 15 Levenspiel, O.,ChemicalReaction Engineering,Wiley, NY, 1972. 16 Dagle, R., Holladay, J., Wilcox, W., and Wegeng, R., “Application of Microtechnology to NASA: Regolith Reduction Task Update”, Pacific Northwest National Laboratory Report, Project# 52199, August 2007. 17 Clark, D. L., “Integrated In-Situ Resource Utilization for Human Exploration-Propellant Production for the Moon and Beyond,” Monthly Report, Lockheed Martin LOP-2005-0102, August 2007.
12 American Institute of Aeronautics and Astronautics