Development of a Physically based Flood Forecasting System on the Upper and ... based on MIKE 11 river modelling software and the Flood Watch forecasting ...
Development of a Physically based Flood Forecasting System on the Upper and Middle Odra Alfred Dubicki and Kinga Stronska Institute of Meteorology and Water Management, Wroclaw, Poland Jerzy Niedbala Institute of Meteorology and Water Management, Krakow, Poland Andrzej Nalberczynski Regional Water Development Authorities, Wroclaw, Poland Andrzej Lewandorski GEOMOR, Gdansk, Poland Gregers Jørgensen and Terry van Kalken DHI – Water and Environment, Flood Management Department, Denmark and UK.
ABSTRACT: As a result of extreme rainfall events during July 1997, a devastating flood affected much of southern Poland, with flood levels exceeding previous records in many places. The flood was particularly severe within the Odra River basin and extensive flooding occurred on the floodplains outside the main river channel. This paper describes the implementation of a flood forecasting system for the upper and middle Odra basin based on MIKE 11 river modelling software and the Flood Watch forecasting system. The Odra River is characterised by a complex river network, a large number of fixed and moveable hydraulic structures (more than 95 on the main river and approximately 430 when all tributaries are included) as well as 14 flood storage reservoirs (polders). The development of an efficient, fast and reliable forecasting system for this complicated river basin therefore requires a careful balance between accurate representation of the flood wave movement and extent and the need for rapid forecasts. The Institute of Meteorology and Water Management, Wroclaw commenced operational flood forecasting using the newly developed model in March 2000. Forecasts of 48 hour duration are issued each morning at 19 water level stations along the Upper and Middle Odra. In August 2000 the coverage will be extended to incorporate an additional 17 locations including a number of important flood control reservoirs, with the duration of the forecast also extended to 72 hours. A pre-requisite for the accuracy of these forecasts includes a reliable meteorological forecast and upstream inflow forecast from the Czech Republic. 1
BACKGROUND
The extensive flooding experienced during 1997 has highlighted the value of adopting modern flood management tools in Poland. Based on a request from the Ministry of Environmental Protection, Natural Resources and Forestry in Warsaw, the Danish Environmental Protection Agency (DEPA),
in early 1998, decided to finance the transfer of Danish flood management technology to Poland (see /1/ Project Folder). The 6.4 million danish kroner (approx. US$1m.) project comprises the transfer of flood management technology - software, hardware, comprehensive training and expertise, to Poland. In addition, DEPA is
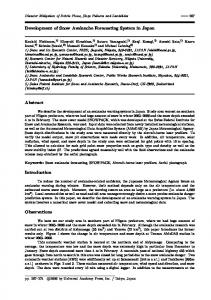
also supporting a similar flood management project in the Czech Republic. The aim is not only to provide state of the art flood management technology to the two countries but also to encourage co-ordination of flood prevention activities, which will provide substantial benefits for the population and property in the Odra and Vistula River basins. The project focuses on strengthening the capabilities of the Polish authorities in the use of modern flood management technology. The participating institutes in Poland are the Institute of Meteorology and Water Management (IMGW) with their branch offices in Wroclaw, Krakow and Warsaw and the Regional Water Board (RZGW) with their branch offices in Wroclaw and Krakow. The consulting company GEOMOR is acting as local consultants throughout the project. DHI has provided a flood management system and consulting services including training. The project has supplied flood forecast management systems that are now installed at the participating institutions. 2 DEVELOPMENT OF THE MODELLING SYSTEM 2.1 The MIKE 11 Flood Forecasting System The MIKE 11 Flood Forecasting System, MIKE 11 FF, (DHI 2000) is designed to perform the calculations required to predict the variations in discharge and water levels in a river system as a result of catchment rainfall and tributary inflows. All model calculations required for issuing a forecast are done automatically by utilising a number of individual modules. These are: Mean Areal Rainfall Calculation This module calculates the mean areal rainfall from point rainfall in a number of sub-catchments within the model area. The mean areal rainfall is used as input to the Rainfall Runoff module. Rainfall Runoff module The rainfall runoff calculation is based on the NAM model (see figure 2.1).
Figure 2.1 Structure of the NAM model with the extended altitude distributed snow model.
The NAM rainfall-runoff model (/2/ Nielsen and Hansen 1973) is a deterministic, conceptual, lumped model representing the land phase of the hydrological cycle. It is based on both physical and semi-empirical formulations to describe the interrelationship between snow storage, surface storage, intermediate storage and groundwater storage. Using the mean areal rainfall and evaporation as input, the NAM model calculates sub-catchment inflow to the river system. Hydrodynamic module The hydrodynamic (HD) module contains an implicit finite difference computation of unsteady flows in the rivers based on the Saint Venant equations. The formulation can be applied to branched and looped networks and quasi two-dimensional flow simulation on flood plains. The hydrodynamic module predicts water levels, river discharges and reservoir inflows, based on NAM-calculated lateral inflow and additional inflow from external boundaries. Automatic updating An automatic updating routine within the MIKE 11 FF module is used to minimise the deviations between observed and simulated discharges/water levels at the time of forecast. (/3/ Rungø, Refsgaard
and Havnø). The MIKE 11 FF module includes an updating procedure, which can identify both phase and amplitude deviations between measured and simulated data, and apply compensating corrections
stations. The NAM simulated runoff from these catchments is included as lateral inflow along Odra and the lower part of the tributaries. Runoff from the remaining 14 catchments are included as point inflows to the HD model at the upstream boundaries.
2.2 Model set-up A comprehensive MIKE 11 flood forecasting model (/4/ MIKE 11 Reference Manual) for the Upper and Middle Odra has been prepared (see figure 2.2).
Catchment Rainfall Daily values of rainfall for a 3 year period 19951997 from 85 stations in the catchment have been checked and analysed. In each sub-catchment mean area rainfall was calculated based on Thiessen weight polygons (typically based on the nearest 4-5 rain gauges). Analysis of the rainfall showed a trend of a 9% increase in rainfall for each 100m increase in elevation. This correction was introduced in each snow zone as described in the snow melt section. Evaporation Daily values of potential evaporation have been used for 5 stations in the area. In each catchment the nearest evaporation station was selected.
Figure 2.2
MIKE 11 Flood Forecasting model - Odra River
The model encompasses a total catchment area of 41,000 km2. The river system included in the model includes 510 km of the upper and middle Odra starting from the Czech border (at Chalupki) and ending close to the German border (at Polecko). In addition the model includes the downstream sections of the 14 most important tributaries. 2.3 Rainfall Runoff Modelling Catchment delineation The Odra catchment included in the model has been subdivided into 23 sub-catchments as shown on figure 2.2. The delineation of the upstream catchments (green colour) has been based on the topographical boundary for each tributary upstream of a reliable discharge gauging station as shown on figure 2.2. The 9 downstream catchments, located within the HD model area (yellow colour), have been prepared for each 50-100 km length of river based on the topographical area between 2 gauging
Snow melt The NAM model with its extended altitude, distributed snow model was used (see figure 2.1) to calculate the snowmelt from the catchment. Using temperature and precipitation data as input, the snowmelt module maintains individual snow storages and calculates accumulation and melting of snow for each altitude zone (see figure 2.1). Each sub-catchment was subdivided into altitude zones in 100 metre steps. In each altitude zone the following corrections were applied: • Temperature dry: -0.6 degrees/100m • Temperature wet: -0.4 degree/100m • Precipitation: +9%/100m Calibration of the NAM model The NAM model has been calibrated using the NAM auto-calibration routine on 14 upstream catchments for the period 1995-1997 (green catchments on figure 2.2). An example of the calibration from one of these catchments is shown on figure 2.3. This figure shows that a good agreement has been obtained between observed and simulated values. In general good agreements have also been reached for other catchments.
Odra Olza Ruda Klodnica Osobloga Mala Panew Stobrawa Nysa Klodska Olawa Sleza Widawa Bystrzyca Kaczawa Barycz Bobr
530300 36700 12700 7290 27400 17100 12300 111400 28800 36800 11200 12800 20600 17500 74500
Polecko Cieszyn Ruda Lenarowice Raclawice Turawa Karlowice Bardo Olawa Borow Krzyzanowice Jarnoltow Piatnica Osetno Zagan
2020 1122 1172 1204 1231 1304 1325 2103 2201 2301 2502 2404 2603 2703 2810
All boundaries are discharge (inflow) boundaries, except Polecko, which is a water level boundary. Figure 2.3 Example on NAM calibration. Olza catchment. Upper figure: Comparison between measured and simulated runoff. Lower figure: Comparison between accumulated values.
Parameters from the calibrated catchments have been transposed to the ungauged catchments in the basin. In general the mountain catchments have higher specific runoff than the lower altitude regions due to the higher rainfall in the mountains. Additionally, the storage capacity of the surface zone and the root zone is less in the mountains causing a higher proportion of runoff. Important parameters for surface storage, rootzone storage and overland flow are: Parameter Surface storage Rootzone stor. Overland flow
Mountains Catchments 10 mm 100 mm 20 hours
Lower tributaries 15 125 mm 30-50 hours
Lowland catchments 15-20 mm 150-200 mm 40-72 hours
Extent and Model Boundaries The hydrodynamic (HD) model of the Odra extends from the upstream boundary at Chalupki to the downstream boundary at Polecko, a total distance of 510 km. Table 2.1 Indicates the main boundaries to the model. Table 2.1 Main Hydrodynamic Boundaries on the Odra Upstream Boundary River Upstream Chainage Station Name No. 20700
Chalupki
Model set-up on the Wroclaw water system. Cross Sections Cross sections for the Odra river were obtained from the IMGW (Wroclaw) and Regional Water Board in Wroclaw, who had used them for an in-house modelling exercise. Cross section spacing is generally around 1000m except for within Wroclaw where the cross section spacing reduces to 300-500 m. Cross sections generally extend to and beyond river embankments.
Figure 2.4
2.4 Hydrodynamic Modelling
Odra
River Alignment The modelled alignment for the Odra River and its tributaries was taken from the GIS coverage supplied by Regional Water Management Board, Wroclaw. In addition a series of 1:50.000 maps showing the extent of the 1997 flood have been used to prepare floodplain flow branches. Figure 2.4 shows, as an example, the model setup for the Wroclaw area.
1101
River structures The Odra river is maintained as a navigable river from the mouth upstream as far as Kozle (Ch
97200). To this end a large number of sluice and lock structures have been constructed on the river. In addition, many of the towns along the river have constructed flood defence works in the form of bypass and diversion channels. A small number of run-of-river hydroelectric plants have also been constructed in a number of places, such as Wroclaw, Brzeg and Brzeg Dolny. Navigation structures mainly comprise a lock located alongside a gated structure with the aim to maintain a given navigation depth upstream to within a 50 cm band. Figure 2.5 shows a typical structure at Opatawice, upstream of Wroclaw. The retractable segment gate is lowered into the structure foundation during high flows in the river.
Figure 2.5
Figure 2.6
Inlet Sluice to Polder near Wroclaw.
Floodplain Schematization Flood embankments along many reaches of the Odra River protect floodprone areas from inundation during moderate flood events. During major floods, such as occurred in 1997, these embankments may be overtopped, bypassed or breached. This leads to the situation where the water level on the floodplain outside the embankments differs from the water level in the river. In order to model this phenomena accurately, the floodplain flow paths needed to be included in the model as separate channels running parallel to the main river. Figure 2.7 indicates an area where floodplains have been schematised as separate flow channels.
Opatawice Moveable Gate
All important structures have been included in the model. A total of 30 structures are modelled as moveable control structures, which are operated for navigation during low flows, with special rules being applied during flood periods. Polders Along the Odra river floodplain a number of low lying areas or polders are used as active flood mitigation reservoirs during higher river flows. These areas are generally embanked and incorporate a mixture of both fixed and moveable inlet and outlet structures, which are operated according to a predefined set of rules. Figure 2.6 shows the inlet structure of a polder near Trestno. The 10 most important polders and associated structures are included in the model setup.
Figure 2.7
Typical Floodplain Schematization
Floodplain levels were extracted at relatively coarse intervals from spot levels on 1:50000 maps of the river basin. The extent of the floodplain was estimated using the extent of the 1997 flood, which had been mapped following that disastrous event. The floodplains are joined to the river by link channels. These simulate the flow over the river embankments and onto the floodplain. Link channels have generally been located where local depressions
in the longitudunal profile of the embankments are evident. The bed level of the link channel has been set to the embankment level at these points, while the width has generally been set to between 100-500 metres. The link channel widths are generally subject to calibration. Where the floodplain channel terminates, low level, narrow link channels connect the floodplain back to the river. These simulate drainage structures, pumps etc which would be used to evacuate water from behind the embankments in times of overtopping and excessive local rainfall runoff. The bottom level of these draining links has been set to the bed level of the floodplain to ensure total drainage of the floodplain.
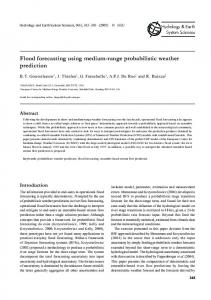
upsteam of Wroclaw, where it is evident that the floodplain levels obtained from the topo maps do not provide sufficient accuracy to allow a better calibration in this area. In addition the cross sections used in the model date from surveys undertaken 2030 years ago and this may also be a contributory factor in the calibration. Despite these problems, a excellent calibration was obtained in many stations, particularly in the upstream areas. Figure 2.8 shows the calibration at Miedonia gauge.
Reservoirs The 3 most important reservoirs have been included in the model. These are Nysa and Otmuchow on the Nysa Klozka River and Turawa reservoir. The model incorporates the main flow control structures of these reservoirs including their operating rules in order to accurately simulate structure operation. Calibration of the Hydrodynamic model The model has been calibrated at 14 important water level stations for the 1997 flood. This flood exceeded all previous records on many gauges along the river and as streamflow gauging was not practicable during this disaster, accurate quantification of river discharge has not generally been possible. During the 1997 flood many of the embankments protecting properties on the Odra floodplain were breached, making calibration of this event more difficult. Nevertheless it was felt necessary to attempt a calibration due to the importance of this flood. Inflows to the model were taken from recorded discharges on the Odra and main tributaries, with ungauged flows being generated from the NAM rainfall runoff model. During the calibration it was found that the flows on the floodplain played a major role in the progression of the 1997 flood, including flows into and out of the larger polders. Hence the link channels which control the flow between river and floodplain were adjusted iteratively until the best agreement between simulated and observed water levels on the river was obtained. Some inconsistencies exist in the area
Figure 2.5 Simulated and observed (red) water levels at Miedonia, July-August 1997
3
IMPEMENTATION OF FLOOD WATCH FOR REAL TIME OPERATION IN POLAND
3.1 Introduction Flood Watch is a decision support system for realtime flood forecasting combining an advanced time series data base with the MIKE 11 hydrodynamic modelling and real-time forecasting system, MIKE 11 FF, together with the Geographical Information System (GIS), ArcView (/5/ Flood Watch Reference Manual) The integration of a flood forecasting system in a GIS environment provides a very powerful tool for real-time flood forecasting and flood warning. Once the database is established and the graphical display of stations configured, Flood Watch allows for the fast and easy handling of the procedures involved in the management of a real-time flood forecasting and warning system. Flood Watch can run in a fully automatic mode by means of a built-in task scheduler, or in a manual mode, where the operator
controls the system. Figure 3.1 shows a schematic outline of the Flood Watch System.
The graphical display in ArcView is automatically updated with the most recent flood information. In addition forecasts can be produced as graphs of measured and forecast water levels and discharges, as printed bulletins or saved in HTML format for display on an Intranet or the Internet. 3.2 Customisation of Flood Watch As the first step in the setup of Flood Watch on the Odra, various thematic maps were collected for use in the graphical display. These include: • rivers, catchments and reservoirs • topography (1 km grid) • cities • borders
Figure 3.1
Schematic outline of Flood Watch
Referring to figure 3.1, the flow of data from input of data to the output of a forecast occurs as follows: Input Telemetry data is imported to Flood Watch from the hydro-meteorological network through the data conversion module. Import of data can be run automatically or manually. Quantitative forecasts of precipitation, and inflow to upstream boundaries in the forecasting period can be imported by means of the data entry module. Processing Before issuing a forecast, processing of the input data is generally required. The following tools are available to augment this process: • Interpolation of input data • Consistency check of data • Gap filling of input simulation data • Q/H calculation and data shifting Modelling Once a request for a forecast is made (either manually or via the task scheduler) the system will automatically extract the required data from the Flood Watch database to MIKE 11. The model simulation is then automatically executed and the MIKE 11 simulated forecasts are transferred back to the Flood Watch database for display and further dissemination. Output
Afterwards all real time stations in the area were established in the Flood Watch database. Historical data from significant flood periods were also transferred to the database. The database includes: • 138 Water level/discharge stations (14 of these stations in the Czech Republic) • 118 Rainfall stations (33 of these stations in the Czech Republic) Temperature data and snow cover data are also collected at some locations of the rainfall stations. Thematic maps with the location of stations were then prepared in ArcView from the Flood Watch configuration tools. The following themes are included in the setup from which a display of historical or real time data from the Flood Watch data base can be made: • station status of water level, discharge, rainfall, temperature and snow cover • surface map of rainfall • surface map of temperature • surface map of snow cover Figure 3.2 shows an example of the station status during the July flood in 1997. On July 8 the flood situation was alarming, which can be seen on the map where the water level status is displayed as: • red triangle : alarm • yellow triangle : warning • green triangle : normal The rainfall status (see figure 3.2) is presented with blue filled circles where the darkest blue indicates more than 50 mm rainfall during the last 24 hours. It
appears from the figure that rainfall has been very high in the mountains during the last 24 hours. 4
REAL TIME OPERATION
4.1 Daily operation This section describes, as an example on real-time operation, the daily procedure, as was used to prepare the forecast on 30 May 2000.
Figure 3.2
Flood Status map - 8 July 1997.
For real-time operation, the streaming of data within the Flood Watch system shown in figure 3.1 has been established. This includes station lists for each component in the data flow, which are prepared by means of the Flood Watch configuration tools. The setup includes. • list of telemetric stations, which are imported to Flood Watch • list of stations where boundary estimates are specified for forecast simulations • list of real time stations to be included in the forecast simulation • list of forecast stations to be transferred from the MIKE 11 simulation • a predefined forecast bulletin • list of forecast stations to be shown in graphs • a predefined Flood Watch layout within ArcView to be shown on a HTML page.
Receiving real time data In the morning, data from all real time stations was received from the field and checked at the flood forecasting centre. The data was stored in a temporary database. The import of data from this temporary database to Flood Watch can run automatically by means of the built-in scheduler, however on this day the transfer of data was initiated by the forecaster by clicking on the data collection icon on the Flood Watch tool bar. The data collection also initiated an automatic update of the station status display including the rainfall surface map. A hardcopy of this station status, as shown on figure 4.1, was prepared to give the first overview of the flood situation. The map indicates that light rainfall has been observed in most of the catchment during the previous 24 hours. The river levels are below the warning level at all locations.
The import of telemetric data also included the development of a utility, which automatically transfers data collected in the flood forecasting centre to the Flood Watch database. After having established the flow of data within the Flood Watch system, all real time data can be automatically imported, presented in tables, on graphs or on maps as required. In addition forecasts can be prepared quickly in a user friendly environment. A forecast can generally be issued within 5 minutes as all necessary data management tasks are carried out automatically within the Flood Watch system. The forecast simulation is further described in next section.
Figure 4.1
The Flood Watch status map - 30 May 2000
Forecasting After the data collection was completed, the forecast was prepared. The forecast calculation was initiated
by clicking on the Forecast icon in the menu bar.Clicking the Forecast ican automatically starts the extraction of the required data from the Flood Watch database to MIKE 11, executes a model simulation and transfers the MIKE 11 simulated forecasts to the Flood Watch database for display and further dissemination. Before the calculation was started, the boundary estimates were prepared in the table as shown on figure 4.2.
Figure 4.2
4.4) are prepared automatically after approximately 4 minute simulation period.
the
At present (June 2000) 48 hour water level forecasts are issued at 19 locations along the Odra. This will be extended with inflow forecasts to the Odra and important reservoirs at 17 additional locations and the duration of the forecast will be extended to 72 hours (expected in August 2000).
Figure 4.3
The Flood Forecasting bulletin.
Figure 4.4
Example of forecasted water levels at 4 locations
The Boundary Estimation Form.
Boundary estimates during the 48 hours forecast period are prepared for: • Inflow at upstream boundary on the Odra from the Czech Republic. • Inflow at upstream boundary on the Bobr River (no NAM model exists for this catchment at the time of writing) • Estimated temperature in Wroclaw. This estimation is only required in periods with snow melt/accumulation. • Estimated rainfall in all sub-catchments. The estimates are given at 12 hour intervals for a total of 48 hours. The simulation can also be made without this boundary estimate for some stations. In such cases the inflows are kept at the same level as at the time of forecast, while zero rainfall is assumed for catchments without rainfall estimation during the forecasting period. The MIKE11 model simulation runs automatically including automatic updating, thus ensuring that the model has the best initial conditions at time of forecast. Forecasts presented in a predefined flood bulletin (see figure 4.3) and on graphs (see figure
Dissemination Flood Watch includes built-in facilities for fast dissemination of forecasts. The latest information stored in Flood Watch can be exported to a predefined web page including the flood status map, the flood bulletin and graphs for the latest forecasts. This information can be published by clicking on the Flood Watch Internet button as soon as the forecaster decides to disseminate warnings to the public. 4.2 Forecast Accuracy
The accuracy of the forecast is highly dependent on the quality of the input of boundary estimates to the model during the forecasting period, especially the inflow forecast on the Odra from the Czech Republic. At present the forecast from Bohumin (the last discharge station on Odra in the Czech Republic) is prepared for 6 hours in advance by the Czech Meteorological Institute in Ostrava and sent to Wroclaw. It is planned to extend this forecast period to 48 hours in the near future. When longer accurate inflow forecasts for Bohumin can be made available, it is expected that the accuracy of the forecasts on the Odra will improve, particularly for longer forecast horizons (48-72 hours). In addition to the inflow forecasts, the model also requires the rainfall prediction in each catchment during the forecasting period. The quality of these rainfall forecasts is also important for the accuracy of the water level forecast. 4.4 Future Work The model should be update with new topographical data, as soon as these become available. In addition the model can be prepared for flood inundation mapping when a digital terrain model is available (it is expected these data will become available from the World Bank Project for flood recovery initiated after the 1997 flood). Further development on he rainfall prediction should also be considered as these data play an important role for the forecast accuracy. In addition the Odra model should be developed further downstream including data from Germany. REFERENCES /1/ Flood Management in Poland (1999) Project Folder. Internal publication DHI. /2/ Nielsen, S.A. and Hansen, E. (1973): “Numerical Simulation of the Rainfall-Runoff Process on a daily Basis”. Nordic Hydrology, 4, pp 171-190. /3/ Rungø M., Refsgaard, J.C. and Havnø, K (1989). Hydrocomp ‘89, Dubrovnik, Yugoslavia 1989. DHI
/4/ Danish Hydraulic Institute (2000). MIKE 11 Reference Manual and User Guide, May 2000. /5/ Danish Hydraulic Institute (2000): FLOOD WATCH. User Guide and Reference Manual DHI, January 2000.