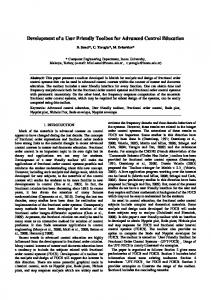
Ninth International IBPSA Conference Montréal, Canada August 15-18, 2005
DEVELOPMENT OF A MODULAR TOOLBOX IN SIMULINK FOR DYNAMIC SIMULATIONS OF VOC-CONCENTRATION IN INDOOR AIR Henrik Karlsson, Angela Sasic Kalagasidis and Carl-Eric Hagentoft
[email protected] Building Physics Research Group Department of Civil and Environmental Engineering Chalmers University of Technology, Göteborg, Sweden ABSTRACT Presence of volatile organic compounds in indoor air affects human health. Throat and eye irritation together with headache and weakness are symptoms related to volatile organic compounds. Hundreds of these compounds are normally present in indoor air.
Field measurements are one way of obtaining quantitative assessments of IAQ, i.e. concentration and duration of VOCs in indoor air. Measurements are important because they give an insight in the real situation, but measurements can be done only after the building is constructed. An alternative to field measurements is to perform calculations of VOC’s in indoor air by means of a simulation tool.
This paper presents a numerical simulation tool which is developed with the purpose to assess the concentration of volatile organic compounds in indoor air, taking into account the presence of building materials, furniture, appliances, and ventilation systems. To illustrate the program capabilities, the tool is used to assess the storage and release of toluene in an entire house. These results show a high degree of program reliability compared to prior measurements.
Calculation models Storage and mass transfer processes in surrounding (porous) building materials significantly affect the VOC concentration in indoor air over the time. A comprehensive simulation tool for VOC’s must be based on a calculation model that includes these mass transfer processes. Empirical and Physical calculation models are two types of calculation models that are fundamentally different. Empirical or statistical models use parameters that are based on laboratory experiments, and than extend the application of these parameters to largescale models, using the rule of similarity or proportionality. Since parameters do not have a clear physical meaning (they are defined only to explain one single experiment with mathematics), consequently, these models fail to assess the behavior when conditions and geometry are changed in relation to the original experiment. For example, the storage of VOCs in building structures is modeled as being proportional to the product of area of the structure, concentration difference and a transfer coefficient, which is fitted from the experiment. Thus the structure is treated as a surface sink/source while its volumetric storage capacity is neglected. Therefore empirical models may fail when simulation of the whole house is needed (Huang et al., 2002). This type of modeling prevails among commercial programs (CONTAM, IAQX).
The software has a modular structure to facilitate modeling of complex systems. All modules are organized in a toolbox that is available for downloading on the Internet to aid the process of program development.
INTRODUCTION Volatile Organic Compounds and Indoor Air Quality A great number of different volatile organic compounds (VOC) are present in indoor air. VOC’s are gaseous pollutants and partly responsible for the reduced indoor air quality (IAQ). Headache, weakness, throat and eye irritation are some of the typical symptoms of sicknesses associated with the presence of VOC’s (Mølhave et al., 1987). The cleanness of the indoor air and the way it is perceived by humans are fundamental considerations when a qualitative assessment of the indoor air is to be performed (Nilsson, 2003). Concerning VOC’s and their impacts on human health, the qualitative assessment relates concentrations and exposure time to VOC’s, in order to secure an acceptable IAQ and thereby a healthy indoor environment.
Physical calculation models are based on a number of fundamental mass transfer processes such as surface sorption, molecular diffusion, etc, where material transport properties and related coefficients are determined in experiments (Meininghaus, 1999; Hansson, 2003). Physical
- 493 -
models have a clear physical meaning. As a consequence, it is possible to assess the behavior of a whole room (or a house), even when geometry and the included building materials are changed in relation to the original material parameter experiment.
The idea is to develop a dynamic simulation tool which is capable to model the above mentioned system of mass transfer processes. The tool offers possibilities to assess concentration and duration of VOC’s in the indoor air with respect to: initial concentration of VOC’s in building materials, sink effects in building materials, ventilation strategies, outdoor conditions and indoor sources of VOC’s.
Idea to a Simulation Software Distribution of VOC’s in indoor environment should be analyzed on a building as a system, taking into account interactions between building envelope, building services, occupants and surrounding environment. This complex system changes in time, as it is shown in Figure 1. Each interaction represents a specific physical process or a set of such processes and the dynamical behavior of the system as a whole depends on type and strength of these interactions. As a result, different sources of VOC’s appear in indoor environment.
A problem of heat, air and moisture transport (HAM) in indoor air and in a building envelope has many similarities to the system illustrated in Figure 1. Therefore, the concept of a whole building simulation tool for heat, air and moisture transfer (Sasic Kalagasidis, 2004) is used to develop an analogous tool that calculates mass transfer and storage of VOC’s. Objectives for the development of the simulation tool are:
Quantities of VOC’s can enter or exit the system passing, for example, the ventilation system, as it is shown in Figure 1. Occupants and equipment are also sources of VOC’s. The characteristic of each source is, of course, highly individual. Sources differ not only in type of released gases but also in rates at which they are released, and these can be also variable in time. Building materials are also an essential part of the system, since many of them contain primary emissions that may be emitted to the indoor air, or have a significant storage possibility. Thus, only mass transfer of VOC’s or both mass transfer and storage of VOC’s can be addressed within such system.
− To construct a toolbox (library) of fundamental calculation modules by using a physical calculation model. Each block should represent one definite part of the dynamic system illustrated in Figure 1. − Establish and define a system for data communication between blocks. The number of VOC’s, possible to apply in one simulation, should not be limited by the system of communication. Further, the system must handle an optional number of multilayered building structures such as floor, walls and roof.
Boundary layer
Supply air Csupply(t)
Mass transfer of VOC’s
Ventilation
Czone(t)
Mass transfer of VOC’s
Mass transfer of VOC’s
= System borderline = Indoor air
Material layers
VOC’s
Storage of VOC’s Cint(t,x)
Activity + Equipment Σ Jgain(t)
=Surrounding materials
X
Figure 1The dynamic system describing mass transfer and storage of VOC’s in the indoor environment.
- 494 -
− Immediate and fully reversible sorption processes, where Henry’s law describes both sorption and desorption with a linear partition coefficient. − Isothermal conditions and a constant moisture content in the entire system (actually constant material properties for a normal thermal and hygroscopic condition). − The volume of indoor air is assumed to be completely mixed at all moments. As a result, there is no difference in concentration of VOC’s between different locations in the volume of indoor air. − One-dimensional mass transfer of VOC’s within building materials.
− Publish the toolbox of fundamental blocks and documentation of the communication system freely available on the Internet in order to facilitate development of this and other simulation tools. − Organize the structure in VOC-Tools so it facilitates integration with existing tools in the International Building Physics Toolbox (IBPT). Thus, there is a vision to simulate heat, moisture and VOC’s in a coupled model.
PROGRAM DESCRIPTION Physical Calculation Model The first step in the development of VOC simulation tool is to define a calculation model that describes fundamental mass transfer processes of VOC’s in a satisfactory way. In recent years, several physical calculation models have been proposed (Yang et al., 2001; Huang et al., 2002; Zhao et al., 2002; Hansson, 2003; Murakami et al., 2003; Haghighat et al., 2003; Zhang et al., 2004). We are particularly interested in models where storage of VOC’s within building materials is taken into account.
Mass Balance Equations and Numerical Method A set of three different time dependent partial differential equations describes the mass balance of VOC’s in the system: one mass balance equation for the whole volume of indoor air, one for the surface of materials and one for interior part of a surrounding material (Hansson, 2003). It is possible to find an analytical solution for a problem defined by these three mass balance equations, but only if simplified boundary conditions occur (i.e. a constant VOC source or a step change in VOC concentration). Consequently, analytical solutions exists for a limited number of simplified cases which are not representative for the indoor environment where different sources and sinks of VOC’s occur. With these typical non-simplified conditions, a numerical method is favorable.
Three processes govern the storage and release of VOC’s in building materials. Boundary layer diffusion between indoor air and building materials is an important physical mass transfer processes for the proposed application. Within a material, mass transfer is governed by molecular diffusion in vapor phase. Sorption is the mechanism of bounding of VOC molecules at a solid surface within materials (pore surfaces) or bounding of VOC molecules at the observable surface of materials. Altogether, building materials can act as potential depots of VOC’s. The physical calculation model which is incorporated in VOC-Tools encloses all these three processes. A detailed description of the model can be found in Karlsson (2004).
A numerical method based on the control volume method and an explicit time discretization scheme is applied for the proposed simulation software. When using the control volume method, each calculation node represents the physical state (concentration of different VOC’s) for a finite volume of an individual part of the model. Resistances characterize mass transfer (molecular diffusion, boundary layer diffusion and ventilation) between calculation nodes. Figure 2 illustrates the whole network of calculation nodes and mass transfer resistances. This network is comparable to the sketch illustrated in Figure 1. The concentration of VOC’s in the volume of indoor air is called the Zone in this network.
When using a physical calculation model, material properties for mass transfer and storage of VOC’s within building materials are of special interest. Material properties (e.g. diffusion coefficients and sorption partition coefficient) can be determined in material experiments (Meininghaus, 1999; Hansson, 2003).
Modular Toolbox in Simulink VOC-Tools consist of five different block diagrams (modules) grouped in a toolbox. The blocks in the toolbox are: Zone, Surface material, Material, Gain and System, see Figure 2 and 3. With a well defined communication data-set, this toolbox represents a highly flexible modeling environment.
There is a list of important conditions and assumptions associated with the proposed model. − No chemical reaction between different VOC’s. − No phase changes for VOC’s besides sorption and desorption.
- 495 -
System Csupply
Surface material
Material
1/Ra 1/βvoc
Rs
R
R
More Material nodes
Czone
Zone
Cs
ΣJgain
Cint
Cint
= One calculation node
Gain
Figure 3 VOC-Tools graphical environment and illustration of block diagrams together with the communication system in Simulink.
Figure 2 Complete VOC model illustrated as a network of calculation nodes and resistances.
Communication Matrixes and Material Properties VOC-Tools block diagrams communicate over data matrixes which includes necessary physical states and properties for all VOC’s at the boundaries of the block diagrams in the model. There are altogether five different matrixes, structured as it is shown in Table 1. The dimension (length) of these matrixes depends on the total number of different VOC’s implemented in the simulation.
Using the graphical programming language Simulink (MathWorks), VOC packages are designed as block diagrams, see Figure 3. A block diagram is a common term for the basic elements used during the modeling process. Modeling in Simulink is a process of assembling more complex blocks from the standard ones. Simulink has a modular structure that is hierarchical and open on every level. This means that each of the block diagrams may hide other subsystems. The structure and the graphical approach facilitate handling and control of very complex interaction between different parts of the model. As a part of Matlab package, Simulink has built-in state-of-the-art ordinary differential equation (ODE) solvers, which are automatically configured at run-time of the model. Therefore, only a physical model needs to be implemented, and not the solver.
This is important since it allows implementation of an optional number of VOC’s in one single simulation. In Figure 3, these communication matrixes are illustrated as arrows/lines. These lines connect all block diagrams in the model in a graphical way. Material properties are arranged in multidimensional arrays (structures) in Matlab workspace. A database can contain properties for different materials, but they must be organized in the same types of fields. Keeping the same structure and especially field names, allows users to create an individual database. Any other properties can be added to the database, just with another describing name. This feature allows anyone to use their preferable material property matching their models.
Each block diagram in VOC-Tools represents a defined part of the dynamic system from Figure 1. Block diagrams contain calculation nodes with corresponding calculation schemes, which are defined by the mathematical model (control volume method). Components from the toolbox are used to assemble a simulation model that represents the indoor environment with respect to mass transfer of VOC’s. The total network is established when all blocks are coupled, see Figure 2 and 3. Table 1 Specification for data matrixes in VOC-Tools Data Matrix Dimension [Row, Column] Zone
[1,Gasnr*]
Construction
[2,Gasnr]
Gain
[1,Gasnr]
System
[2,Gasnr]
Node
[2,Gasnr]
Signal Specification, (x)[Row, Column] Czone[1,1] Cs[1,1] βvoc[2,1] Jgain[1,1] RA[1,1] Csupply[2,1]
Czone[1,2] Cs[1,2] βvoc[2,2] Jgain[1,2] RA[1,2] Csupply[2,2]
→ → →
Czone[1,Gasnr] Cs[1,Gasnr] βvoc [2,Gasnr] Jgain[1,Gasnr] RA[1,Gasnr] Csupply[2,Gasnr]
Cint[1,1]
Cint [1,2]
→
Cint [1,Gasnr]
- 496 -
→ → →
EXPERIMENT AND SIMULATION OF AN ENTIRE HOUSE
Results of simulation with VOC-Tools Toluene concentration increases rapidly during the first nine hours, Figure 4. This increase is entirely determined by the source strength and the air exchange rate. Compared to the total amount of toluene that is released, only a small quantity is sorbed by structures, Figure 5. It reaches a maximum of 0.576 g after 9.5 hours, which is only 11.9 % of the entirely released. The rest of toluene is dissolved and taken away by the exhaust air. Building materials act as sinks of toluene during the first period. After 9.5 h, building materials act as sources of toluene. Structure 1 and 2 release sorbed toluene fast due to the high permeable gypsum board, Figure 5.
This experiment was originally performed for the validation of an empirical VOC model called Surface Sink Model (SSM) (Won et al., 2001a). In the experiment, an open container of a pure toluene is placed in the basement of a test house. For the next nine hours, a constant source of toluene contaminates the indoor air inside the house. Concentration of toluene in indoor air is measured at several locations. Results from the measurements are denoted with markers in Figure 4. A numerical model of the test house is constructed in VOCTools. Results of the simulation are presented with a black solid line in Figure 4.
Input data to VOC-Tools simulation
The concrete structure is the most significant structure for the storage and release of toluene. For the late desorption phase, after about 30 hours, the concentration of toluene in the indoor air is almost entirely determined by the mass transfer (internal diffusion) from the concrete wall (construction 3). The strength of the toluene source from the concrete wall is large enough to extend the duration of toluene in the indoor air for more than 100 hours.
Exterior walls are made of concrete painted with acrylic paint. Interior walls in the house are made of gypsum boards. There are both painted and unpainted (virgin) gypsum boards in the house. Apart from these three structures, there are also large areas (floors) covered by painted wood. Since authors (Won et al., 2001b) could not detect any sink effect of the wood floor in combination with toluene, consequently these areas are disregarded in the VOC-Tools simulations.
Since the mass transfer properties of toluene in concrete are only estimated, solutions with other magnitudes are studied. The resulting concentration of toluene in indoor air over time, see Figure 6, has basically the same shape as in Figure 4. An increased diffusion coefficient (for example) gives a higher concentration of toluene in the indoor air for the late desorption phase. The opposite behavior, a lowered concentration of toluene in the indoor air is observed when the diffusion coefficient is decreased. Changes of the internal partition coefficient, which will influence the capacity to accumulate VOC’s by sorption processes, give similar results.
Input data used in the simulation are 10 cm concrete, 13 mm gypsum boards and 50 µm acrylic paint. Mass transfer and storage properties for gypsum board and acrylic paint are collected from Hansson (2003). Since the transport properties of toluene in concrete were not available, the properties of n-Octane in concrete were used (Meininghaus, 1999). These material properties are believed to be the best approximation and therefore they are used as a rough estimation for transport of toluene in concrete. A sensitivity analysis towards this approximation is provided hereafter.
1
Figure 4 Comparison between measured and simulated concentration of toluene in indoor air.
- 497 -
Figure 5 The mass of stored toluene for each surface and for the total building structure.
“key” VOC’s, i.e. the VOC’s that are most frequent in indoor air and most harmful for human health.
Results of SSM calculations (Won et al., 2001a) are also given in Figure 4. The rather bad correlation between the measured and the calculated data (SSM) can be explained by the neglect of the significant sink effect of the concrete (authors modeled the concrete structure as gypsum boards). The results from SSM simulation are more like a case with no sinks in the structure. A model with no sinks is the same as a straightforward dilution model for VOC’s (See the dotted line in Figure 4).
VOC-Tools calculates concentrations of VOC’s in indoor air over time. This information allows to calculate the exposure of VOC’s to humans, present in the indoor environment. Focusing on a number of key VOC’s, by means of established and generally accepted maximum exposure levels in indoor air, could give rise to an increased demand for assessments made by simulation software.
DISCUSSION
Future Development of VOC-Tools The idea of performing VOC simulations is to assess the VOC exposure for humans and to evaluate building design solutions together with ventilation strategies. However, the present version of VOC-Tools contains fundamental block diagrams needed to make quite simple simulations of the distribution of VOC’s. Development of more advanced blocks is needed if the tools should be used as a design tool. New blocks could be based on other modeling theories or could have new features compared to already existing blocks. Some
Implementation of VOC simulations Decreasing the amount of emissions from building materials, furniture and equipment, by means of emission testing, is one way for limiting the VOCconcentrations in indoor air. However, there are no generally accepted maximum concentration for single VOC’s in indoor air. The main reason is the lack of knowledge about single VOC concentration in indoor air and their impact on human health. There is a simplified method to quantify IAQ with respect to VOC emissions using the total concentration of all VOC’s (TVOC). In this approach, if moderate levels of TVOC occur, there is a risk that a single harmful VOC can appear in unhealthy concentrations. Andersson et al. (1997) have concluded that TVOC levels are not suitable as a basis for limit values/guidelines. Going back to simulation tools, to assess concentration of several individual VOC’s is not an easy task. Indoor air can contain hundreds of VOC’s and there are numerous types of building materials. As a result, there will be a massive number of physical properties for building materials to be investigated. As a consequence, simulation software like VOC-Tools must focus on
Figure 6 The sensitivity analysis of the internal partition coefficient and the diffusion coefficient for toluene in concrete.
- 498 -
of the interesting developing areas are named hereafter.
available tool is one way to gain the process of development for the VOC-Tools concept. Moreover, the modular structure and the defined interface for communication between modules allow anyone to contribute with new blocks to the existing toolbox.
VOC’s interact by means of chemical reactions and can form a number of secondary reaction products, some of them even more harmful than the primary. These reactions can be triggered in some conditions related to presence of a certain combination of VOC’s or some material. Temperature, pH, humidity and a number of other physical conditions also influence these reactions. Development of new blocks that handle chemical reaction is a great expansion of VOC-Tools.
CONCLUSION A numerical simulation tool that is able to calculate the dynamic distribution of VOC’s in the indoor environment is presented in this paper. The software is specially constructed for system analyses in the field of IAQ. The calculation model used in the tool is of physical nature, based on a number of fundamental mass transfer processes. The sink effect, caused by sorption processes within building materials, has been included in the calculation model. VOC-Tools handle an optional number of VOC’s in one single simulation. Further, an optional number of multilayered structures are available as input.
Today, the model is based on the assumption that material properties are constant values, unaffected to changes in both temperature and water content in the specific material. The temperature affects adsorption and desorption, which are exothermic and endothermic processes. Additionally, sorption properties are affected by the water content in building materials. Generally, water is an excellent solvent for polar molecules. Depending on the polarity, VOC molecules have diffrent ability to be dissolved in water.
Results from simulations show good agreement prior to measurements of VOC concentrations in a test house. Comparison between results obtained by the physical model, proposed in this study, and an empirical model (SSM), show that a physical model is able to predict the behavior for a whole house/room. Empirical models, where material properties are influenced by the experimental conditions, are not able to assess the correct performance. VOC-Tool has been also analytically validated (Karlsson, 2004).
From an IAQ point of view, interesting question arise when wet coating materials, such as paint, are applied on building materials. A new block that models processes associated with wet coating materials would be a great contribution to the existing toolbox. In the extended version of VOC-Tools (Sasic et al., 2005), coupling between heat, moisture and VOC transfer calculations is tested against measurements. As a case study, distribution of butanol in a heated concrete slab (floor heating system) with PVC flooring is selected. The production of butanol within the slab is initiated when the flooring adhesive comes into a contact with water which normally remains in concrete pores after casting. The reversed temperature gradient in the slab supports the process (it pushes the moisture upwards), and as a result, the butanol emissions from the floor holds for years. Applaying the Henry’s law for dissolution of gases in a solvent (free pore water in this case) is shown to be an appropriate physical model for this purpose. The sorption process is modeled with a non-linear sorption isotherm can be used as well.
A fast development process of this tool has been possible by using analogies to heat, air and moisture simulation tools and by using the same concept of an existing simulation tool. In order to facilitate the development of this concept, the tool is entirely free and available on the IBPT website.
REFERENCES Andersson, K., Bakke, J.V., Bjørseth, O., Bornehag, C.-G., Clausen, G., Hongslo, J.K., Kjellman, M., Kjærsgaard, S., Levy, F., Mølhave, L., Skerfving, S. and Sundell, J. (1997) “TVOC and Health in Non-industrial Indoor Environments”, Indoor Air, 7, 78-91. Haghighat, F., Huang, H. (2003) “Integrated IAQ model for prediction of VOC emissions from building material”, Building and Environment, 38, 1007-1117.
One of the cornerstones in IBPT is that the software should be open on every level so that anyone could develop and adjust the tool to fulfill their individual requirements. The model for coupled heat, moisture and VOC calculations (Sasic et al. 2005) and which is shortly described above is also an example of this possibility. The authors believe that a freely
Hansson, P. (2003) The Sink-Effect in Indoor Materials: Mathematical Modelling and Experimental Studies, University of Gävle, Sweden, Dissertation.
- 499 -
Physics, Chalmers University of Technology, Sweden, Dissertation.
Huang, H., Haghighat, F. (2002) “Modelling of volatile organic compounds emission from dry building materials”, Building and Environment, 37, 1127-1138.
Won, D., Sander, D.M., Shaw, C.Y., Corsi, R.L. (2001a) “Validation of the surface sink model for sorptive interactions between VOC’s and indoor materials”, Atmospheric Environment, 35, 4479-4488.
Karlsson, H. (2004) A Numerical Model for Dynamic Simulations of Volatile Organic Compounds in Indoor Air, Chalmers University of Technology, Sweden, Master Thesis. (In Swedish)
Won, D., Corsi, R.L., Rynes, M. (2001b) “Sorptive Interactions between VOC’s and Indoor Materials”, Indoor Air, 11, 246-256.
Meininghaus, R. (1999) Experimental Studies on Transport and Uptake/Release of Volatile Organic Compounds in and by Indoor Materials, Brauschweig Technical University, Germany, Dissertation.
Yang, X., Chen, Q., Zhang, J.S., Magee, R., Zeng, J., Shaw, C.Y. (2001) “Numerical simulation of VOC emissions from dry materials”, Building and Environment, 36, 1099-1107.
Murakami, S., Kato, S., Ito, K., Zhu, Q. (2003) “Modeling and CFD prediction for diffusion and adsorption within room with various adsorption isotherms”, Indoor Air, 13, (suppl. 6), 20-27.
Zhang, L.Z., Niu, J.L. (2004) “Modeling VOC’s emissions in a room with a single-zone multicomponent multi-layer technique”, Building and Environment, 39, 523-531. Zhao, D., Little, J. C., Hodgson, A. T. (2002) “Modeling the reversible, diffusive sink effect in response to transient contaminant sources”, Indoor Air, 12, 184-190.
Mølhave, L., Bach, B., Pedersen, O. F. (1987) “Human reactions to low concentrations of volatile organic compounds”, Environment International, 8, 117-127.
WEB SOURCES
Nilsson, L.-E. (2003) Achieving the Desired Indoor Climate, Lund, Studentlitteratur.
The International Building Physics Toolbox (IBPT) www. IBPT.org
Sasic Kalagasidis, A., Karlsson, H. and Hagentoft, C.-E. (2005) “A simulation tool for temperature and moisture dependent transport of VOC’s in buildings”, 7th Symposium on Building Physics in the Nordic Countries, Reykjavík, Iceland.
CONTAM www.bfrl.nist.gov/IAQanalysis/index.htm IAQX www.epa.gov/appcdwww/iemb/model.htm MathWorks www.mathworks.com
Sasic Kalagasidis, A. (2004) HAM-Tools An Integrated Simulation Tool for Heat, Air and Moisture Transfer Analyses in Building
SYMBOLS Symbol Czone Cs Cint Csupply D Gasnr Jgain Kint Ra R x βvoc
Unit kgvoc/m3air kgvoc/m3air kgvoc/m3air kgvoc/m3air m2/s kgvoc/s m3air/s s/m m m/s
Description Concentration of VOC in indoor air Concentration of VOC close to the material surface (Boundary layer) Concentration of VOC in internal pores (air phase) of materials Concentration of VOC in supply air Diffusion coefficient for VOC in building materials Total number of different VOC’s that is included in one model Mass flux of VOCs that is generated from one single gain Linear partition coefficient (Internal pores in material) Ventilation air flow rate Resistance to mass transport (diffusion) of VOC in the interior of materials Coordinate for depth in material (0=surface, positive direction towards the exterior) Mass transfer coefficient between indoor air and visible surface (over boundary layer)
- 500 -