ITEA Journal 2010; 31: 247–263 Copyright ’ 2010 by the International Test and Evaluation Association
Development of an Autodiagnostic Adaptive Precision Trainer for Decision Making (ADAPT-DM) Meredith Carroll, Ph.D., Sven Fuchs, Angela Carpenter, and Kelly Hale Design Interactive, Inc., Oviedo, Florida
Robert G. Abbott Sandia National Laboratories, Albuquerque, New Mexico
Amy Bolton, Ph.D. Office of Naval Research, Arlington, Virginia The Autodiagnostic Adaptive Precision Trainer for Decision Making (ADAPT-DM) is a framework for adaptive training of decision making skills. The training challenge is that decision making behavior is mostly unobservable with traditional behavioral measures, which generally only give access to outcome performance. This article describes the ADAPT-DM framework, which utilizes physiological sensors, specifically electroencephalography and eye tracking, to detect indicators of implicit cognitive processing relevant to decision making and accomplish the granularity required to pinpoint and remediate process level issues. Using these advanced measures, the trainee’s performance on these cognitive processes can be assessed in real time and used to drive smart adaptations that individualize training. As a proof of concept, the ADAPT-DM framework was conceptually applied to the contact evaluation task in submarine navigation. Simulated data from 75 students, grouped into three levels of expertise (novice, intermediate, and expert), were used for principal component analysis to identify skill dimensions that reflect proficiency levels. Then ADAPT-DM’s composite diagnosis was performed, which uses an expertise model that integrates automated expert modeling for automated student evaluation machine learning models with eye tracking and electroencephalography data to assess which proficiency level the simulated students actions were most similar to. Based on additional assessments, the diagnostic engine is able to determine whether the student (a) performs to criterion, in which case training could be accelerated, (b) is in an optimal learning state, or (c) is in a nonoptimal learning state for which remediation or mitigation are needed. Using root cause analysis techniques, the ADAPT-DM process level measures then allow instructors to pinpoint where in the decision making process breakdowns occur, so that optimal training adaptations can be implemented. Key words: Adaptive training; decision making skills; expertise modeling; learning state. n highly dynamic work situations, such as a submarine crew environment, individuals are required to function with high levels of decision making (DM) skill proficiency while in an environment marked by unforeseen threats, complex data streams, and high levels of uncertainty. The time typically available for training such DM skills is limited; therefore, there is a need for systems that can accelerate skill development, bringing trainees up to speed more quickly. Yet, existing training systems lack the capability to provide real-time adaptive
I
training that can ensure effective and efficient training. An opportunity exists to precisely assess trainee performance and adapt the training experience to accelerate the learning process by (a) identifying and mitigating times when a trainee is in a nonoptimal learning state and time is being wasted, (b) identifying the root cause of performance deficiencies to allow feedback to be tailored to trainee-specific decrements, and (c) adapting training with increasing levels of trainee expertise to ensure efficient utilization of training time. The challenge with respect to assessing 31(2) N June 2010
247
Form Approved OMB No. 0704-0188
Report Documentation Page
Public reporting burden for the collection of information is estimated to average 1 hour per response, including the time for reviewing instructions, searching existing data sources, gathering and maintaining the data needed, and completing and reviewing the collection of information. Send comments regarding this burden estimate or any other aspect of this collection of information, including suggestions for reducing this burden, to Washington Headquarters Services, Directorate for Information Operations and Reports, 1215 Jefferson Davis Highway, Suite 1204, Arlington VA 22202-4302. Respondents should be aware that notwithstanding any other provision of law, no person shall be subject to a penalty for failing to comply with a collection of information if it does not display a currently valid OMB control number.
1. REPORT DATE
3. DATES COVERED 2. REPORT TYPE
JUN 2010
00-00-2010 to 00-00-2010
4. TITLE AND SUBTITLE
5a. CONTRACT NUMBER
Development of an Autodiagnostic Adaptive Precision Trainer for Decision Making (ADAPT-DM)
5b. GRANT NUMBER 5c. PROGRAM ELEMENT NUMBER
6. AUTHOR(S)
5d. PROJECT NUMBER 5e. TASK NUMBER 5f. WORK UNIT NUMBER
7. PERFORMING ORGANIZATION NAME(S) AND ADDRESS(ES)
Office of Naval Research,875 N Randolph St #1425,Arlington,VA,22230 9. SPONSORING/MONITORING AGENCY NAME(S) AND ADDRESS(ES)
8. PERFORMING ORGANIZATION REPORT NUMBER 10. SPONSOR/MONITOR’S ACRONYM(S) 11. SPONSOR/MONITOR’S REPORT NUMBER(S)
12. DISTRIBUTION/AVAILABILITY STATEMENT
Approved for public release; distribution unlimited 13. SUPPLEMENTARY NOTES 14. ABSTRACT
15. SUBJECT TERMS 16. SECURITY CLASSIFICATION OF: a. REPORT
b. ABSTRACT
c. THIS PAGE
unclassified
unclassified
unclassified
17. LIMITATION OF ABSTRACT
18. NUMBER OF PAGES
Same as Report (SAR)
17
19a. NAME OF RESPONSIBLE PERSON
Standard Form 298 (Rev. 8-98) Prescribed by ANSI Std Z39-18
Carroll et al.
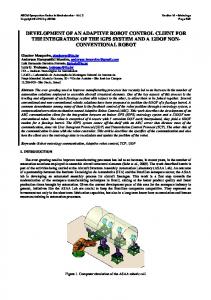
Figure 1. The Autodiagnostic Adaptive Precision Trainer for Decision Making (ADAPT-DM) framework.
the DM process during training, specifically, is that much of DM behavior is unobservable and thus difficult to measure with traditional behavioral measures, which generally only give access to outcome performance (Klein 1998). Outcome measures, such as decision outcomes, do not give the granularity needed to pinpoint and remediate process level issues. Implicit indicators are needed, such as visual scan patterns (i.e., how a decision maker is collecting information and what information is being considered), key cues entering into the decision, sources of distraction or confusion, or changes in cognitive processing that affect readiness to learn (e.g., fatigue, disengagement) (Klein and Hoffman 1992; Macklin et al. 2002). To increase assessment granularity for cognitive processes, we must (a) capture and evaluate perceptual and cognitive processes relevant to DM, (b) analyze the trainee’s performance on these cognitive processes in real time, and (c) use these data to drive smart adaptations that are grounded in training science. As such there is a need for physiologicalsensor–based real-time adaptive training. The Autodiagnostic Adaptive Precision Trainer for Decision Making (ADAPT-DM) is a framework that aims to address this training gap. The framework is composed of three components necessary to ensure precision training: measurement, diagnosis, and adaptation (Figure 1).
N
248
The measurement component allows for the incorporation of a broad range of data collection tools, such as system collected, self-report, instructor assessment, behavioral, physiological,
ITEA Journal
N
N
and neurophysiological measurement to gain a comprehensive understanding of trainee performance and state. By incorporating diagnosis methods, such as root cause analysis, expert comparison, and error pattern analysis, the diagnosis component analyzes these data to direct remediation and facilitate real-time training. Based on the diagnosis, the adaptation component triggers adaptations strategies designed to address performance and state issues through real-time adaptations, after-action feedback, and selection of future training content.
ADAPT-DM theoretical foundation ‘‘Expertise is the key factor in decision making in natural environments.’’ (Lipshitz et al. 2001) Two key models serve as the theoretical foundation for ADAPT-DM: the Stimulus- Hypothesis-Option-Response (SHOR) model (Wohl 1981) and the SkillsRules-Knowledge (SRK) model (Rasmussen 1983). Similar to other contemporary models relevant to tactical DM, such as Endsley’s (1995) situation awareness model and Klein’s recognition primed decision-making model (Lipshitz et al. 2001), the SHOR model dissects the DM process into four distinct steps.
N
Stimulus: In this step a decision maker gathers, recalls, filters, and aggregates information.
Developing a Decision Making Trainer
Table 1. SRK types of performance. Type of performance
Level of cognitive control
Description of performance
Skill-based
No conscious, cognitive control, highly automated
Rule-based
Low level conscious cognitive control High level of conscious cognitive control
Routine activities conducted automatically that do not require conscious allocation of attention Activities controlled by a set of stored rules or procedures Novel situations are presented for which a plan must be developed to solve a problem
Knowledge-based
N
N
N
Hypothesis: Here, the decision maker creates and evaluates hypotheses about the environment around them and selects the most plausible hypothesis. Option: The decision maker creates and evaluates decision options for how he or she should respond based on the hypothesis selected and potential positive and negative outcomes. Response: The decision maker plans, organizes, and executes the response selected.
This DM process becomes abridged as a decision maker develops expertise. According to Rasmussen’s (1983) SRK model (Table 1), as expertise develops a performer can successfully complete the decision task with greater levels of automaticity and hence lower levels of cognitive control. Taken together, these models (Rasmussen 1983; Wohl 1981) suggest that as performers build expertise, they move from purely knowledge-based performance to skill-based performance (Figure 2). For novices, situations are generally novel, and they have to perform the entire DM process, analyzing the environment and creating a hypothesis of what the pattern of cues means for the situation, then generating and evaluating potential responses. As expertise develops with experience base, the trainee starts to develop the ability to
Expertise typically associated High level of expertise
Medium level of expertise Low level of expertise
recognize patterns of cues, which can be successfully associated with existing mental models of a situation, so that known response rules associated with these familiar situations can be triggered. Thus, the DM process becomes abbreviated as the trainee quickly recognizes a situation and applies a preprogrammed rule. With high levels of expertise, the DM process becomes almost automated, wherein an expert reacts to familiar cues with an almost ‘‘wired response’’ based on almost immediate (and possibly parallel) recognition and evaluation of the situation. These models provide a framework for evaluating at a very granular level where in the DM process breakdowns are occurring and at what level of expertise the decision maker is operating. Expertise is the key factor in DM in natural environments (Lipshitz et al. 2001), and the ability to identify level of expertise will allow a more comprehensive understanding of DM performance, including why performance breakdowns occur and what kind of scenario adaptations are most useful to address performance problems.
ADAPT-DM measurement component For the first component of the ADAPT-DM framework—the measurement component—the essential question is what to measure. Within the natural-
Figure 2. Adaptive DM model.
31(2) N June 2010
249
Carroll et al.
Table 2. Cognitive readiness problem states. Problem state Workload
Engagement Distraction Drowsiness
Rationale/literature support When workload is low and trainees are bored, they pay less attention, resulting in lower retention and decreased ability to apply information (Small, Dodge, and Jiang 1996). When workload is high, divided attention results, which is associated with large reductions in memory performance and small increases in reaction time during encoding, and small or no reductions in memory during recall, but comparatively larger increases in reaction time (Craik et al. 1996). Low levels of engagement indicate that a trainee is not actively engaged with some aspect of the training environment (Dorneich et al. 2004). Even if distraction does not decrease the overall level of learning, it can result in the acquisition of knowledge that can be applied less flexibly in new situations (Foerde, Knowlton, and Poldrack 2006). Drowsiness can causes lapses in attention and performance, as well as microsleeps (Neri et al. 2007).
istic decision making (Lipshitz et al. 2001) literature, some researchers have attempted to identify more granular measures of DM skills than performance time and accuracy by considering such measures as number of options considered (Klein and Peio 1989); however, few have considered how to operationalize real-time DM performance measurement and diagnosis. For example, Elliot et al. (2007) presented four metric categories linked to perceptual and cognitive skills associated with natural decision making, including speed (e.g., reaction time, response time), accuracy (e.g., accuracy of response), efficiency (e.g., shortest path to success), and planning (e.g., proactive actions taken). Although these measures provide some level of assessment of the DM process, they are not sufficiently granular to pinpoint where breakdowns in DM performance occur to provide real-time adaptations to target these deficiencies. This is the goal of the ADAPT-DM framework. One specific limitation of behavioral measures is that they are limited in their ability to discriminate performance within the ‘‘good’’ or ‘‘bad’’ performance categories for decision making. For example, an expert and a journeyman may both reach a good decision; however, the amount of effort (e.g., speed and flexibility) required for this level of achievement might differ significantly (Klein and Hoffman 1992). Time measures can typically capture a portion of this; however, they do not gauge internal states, such as workload, that might be critical factors when performing in novel or stressful situations. An expert who is not only performing well but has reached a certain level of ease and automaticity will be more prepared than a journeyman who is performing well but is using every available cognitive resource to achieve this level of performance. The journeyman may need more practice to maintain high performance under high stress levels in the field. It is thus necessary to understand the underlying cognitive states of the trainee, which both affect learning and are indicators of learning effectiveness, to comprehensively diagnose DM expertise and performance. 250
ITEA Journal
With the emergence of neurophysiological and physiological measurement technology that allows for real-time assessment of perceptual and cognitive processing, these unobservable processes become accessible. Specifically, some cognitive states that are measurable via electroencephalography (EEG), including workload and engagement, can provide neurophysiological measures of the unobservable aspects of DM skill development (Dorneich et al. 2007; Levonian 1972). Table 2 outlines specific cognitive states that generally negatively affect the readiness for training by reducing attentional resources that facilitate learning and retention. Thus, it may be possible to utilize certain neurophysiological cognitive state metrics to detect issues with readiness to learn during DM performance:
N
N
N
Workload: High cognitive workload is expected when performing in a knowledge-based control mode because no automaticity guides the process (Berka et al. 2007; Klein and Hoffman 1992). In rule-based control mode, rules are consciously retrieved from memory and applied to gathered information, also causing increased cognitive processing demands. Experts using skill-based DM, however, employ automated routines that require fewer cognitive resources. Thus, it is expected that the assessment of cognitive workload can contribute to the identification of the trainee’s control mode. Engagement: Because of high task demands, novice and journeyman trainees are expected to exhibit higher levels of engagement than expert trainees because studies have shown a trend for decreasing EEG engagement with increasing task proficiency (Berka et al. 2007; Stevens, Galloway, and Berka 2007). Distraction: Distraction is a state characterized by a lack of clear and orderly thought and behavior, where a trainee becomes involved somewhere other than the cognitive tasks of interest
Developing a Decision Making Trainer
N
(Poythress et al. 2006). Expert performers have an exhaustive mental model of the task or situation so that very few situations cause distraction. Confusion is one element of distraction. In rule-based decision makers, confusion may stem from the conscious selection of rules and difficulties in applying them to the situation at hand. Naı¨ve trainees are expected to show relatively high levels of confusion because their mental models are more likely to be incorrect or insufficient so that new situations may cause a mismatch. Drowsiness: Sleep disorders are common and can have deleterious effects on performance (Berka et al. 2004, 2005; Neri et al. 2007). In fact, loss of sleep can accumulate over time and result in a ‘‘sleep debt,’’ which can lead to impairments in alertness, memory, and decision making. Individuals with chronic accumulation of fatigue are often unaware of the impact on their performance.
Eye tracking metrics provide a physiological measure with the granularity necessary to understand why DMrelated performance failures occur to effectively adapt training. In particular, eye tracking offers an additional set of behavioral-based metrics to aid in assessing the information processing of individuals as it relates to perception. Toward this level of assessment, the following eye tracking metrics have been validated as providing information on perceptual processes (Hyo¨na¨, Radach, and Deubel 2003):
N N N N
Number of overall fixations: Inversely correlated with search efficiency. Gaze percent on Areas of Interests (AOIs): Longer gazes are equated with importance or difficulty of information extraction. Mean fixation duration: Longer fixations are equated with difficulty of extracting information. Number of fixations on AOIs: Reflects the importance of each area.
Thus, beyond traditional DM performance-based metrics, neurophysiological and physiological metrics can be used to provide an assessment of the unobservable aspects of DM skills development.
ADAPT-DM diagnosis component The next component of the ADAPT-DM framework is the diagnosis component. ADAPT-DM diagnoses root causes in performance deficiencies and inefficiencies based on three important factors associated with DM skill development: 1. DM performance: The diagnosis component can use performance outcome (e.g., speed, accuracy,
efficiency, and planning; Elliot et al. 2007) and eye tracking (e.g., number of overall fixations, gaze percentage on AOIs, mean fixation duration, number of fixations on AOIs; Hyona, Radach, and Deubel 2003) data to assess whether a trainee is collecting appropriate information, considering and understanding information appropriately, selecting good decision options, and appropriately executing these options. 2. Learning state: To ensure feedback and facilitate effective performance improvements, it is essential to ensure that trainees are operating in an effective learning state. The diagnosis component can use EEG-based metrics (e.g., workload, engagement, distraction, drowsiness; Dorneich et al. 2007; Levonian 1972) to ensure that the trainee’s learning state remains at adequate levels to promote learning. 3. Expertise: Performance may not provide sufficient granularity to drive precise adaptations. A trainee can perform well but be using every spare resource, have inefficient performance, and substantial room for improvement in terms of strategies used. Additionally, performers operating at different expertise levels commit errors for different reasons. Thus, the diagnosis component assesses expertise to allow for more precise adaptations to be made. Expertise is the most challenging of these skills to diagnose. To truly understand why trainees are performing as they are, one must take into account expertise level. Reason (1990) identified typical performance characteristics and failure modes related to the SRK levels (Rasmussen 1983) of cognitive control associated with varying expertise. These characteristics and failure modes (Table 3) can be used to diagnose deficiencies with respect to expertise level and select effective adaptations. However, given the multifaceted nature of expertise, it cannot be diagnosed by merely looking at a small subset of performance measures. Instead, it is necessary (though challenging) to consider several aspects of performance and cognitive state. The Automated Expert Modeling for Automated Student Evaluation (AEMASE) process can be used to support such diagnosis (Abbott 2006). AEMASE is a process for subject matter experts to rapidly create and update their own models of normative behavior (Abbott 2006). First, examples of task behavior are recorded in a training simulator. The examples may be either good or bad behavior performed by either students or subject matter experts, but the examples must be accurately graded by a subject matter expert. Second, machine learning algorithms are 31(2) N June 2010
251
Carroll et al.
Table 3. Typical performance characteristics and failure modes related to the SRK (Reason 1990). Expertise level
Typical control mode
Expert
Skill based
Journeyman
N Novice
Rule based
Knowledgebased
Performance characteristics Errors occur during routine action Attention during errors is not directed at task at hand Errors occur while applying known schemata Errors are ‘‘strong but wrong’’ and predicable Error numbers may be high, but error/opportunity ratio is small Low to moderate influence of (mostly intrinsic) factors Error detection is usually fairly rapid and effective Knowledge of change is not accessed at proper time
Errors occur during problem-solving activities Attention during errors is directed at problem-related issues Errors occur while employing stored rules Errors are ‘‘strong but wrong’’ and predicable Error numbers may be high, but error/opportunity ratio is small Low to moderate influence of (mostly intrinsic) factors Error detection is difficult and often requires external intervention Changes in the environment are anticipated but when and how is not known
Errors occur during problem-solving activities Attention during errors is directed at problem-related issues Errors occur while employing limited, conscious processes Errors occur with variable predictability Error numbers are small, but high error/opportunity ratio Influence of extrinsic situational factors on errors is high Error detection is difficult and often requires external intervention Changes in the environment are not prepared for and not anticipated
Failure modes Inattention Double-capture slips Omissions following interruptions Reduced intentionality Perceptual confusions Interference errors Overattention Omissions Repetitions Reversals Misapplication of good rules First exceptions Countersigns and nonsigns Informational overload Rule strength General rules Redundancy Rigidity Application of bad rules Encoding deficiencies Action deficiencies Wrong rules Inelegant rules Inadvisable rules Selectivity Workspace limitations Out of sight out of mind Confirmation bias Overconfidence Biased reviewing Illusory correlation Halo effects Problems with causality Problems with complexity Problems with delayed feedback Insufficient consideration of processes in time Thematic vagabonding
applied to create a behavior model. Creating the model requires selecting the data fields that best distinguish between good and bad behavior (feature selection) and applying an algorithm to generalize assessments of observed behavior to assessments of new (potentially novel) student behavior. An appropriate algorithm must be selected for each student performance metric, depending on the type and amount of example data available. Third, student behavior is assessed using the behavior model. As each student executes a simulationbased training scenario, his or her behavior is compared with the model for each performance metric to identify 252
ITEA Journal
and target training to individual deficiencies. The model determines whether student behavior is more similar to good or bad behavior from its knowledge base. Initially, the knowledge base is sparse, and incorrect assessments may be common. However, an instructor may override incorrect assessments. AEMASE learns from this interaction, so the model improves over time. Real-time student assessment can be implemented by continuously reevaluating the model throughout a scenario to support dynamic scenario adaptation. In a previous pilot study, AEMASE achieved a high degree of agreement with a
Developing a Decision Making Trainer
human grader (89%) in assessing tactical air engagement scenarios. In a subsequent study of E2 Naval Flight Officer tasks, AEMASE achieved 80%–95% agreement with a human grader on a range of metrics (Stevens et al. 2009). AEMASE is useful when data collection for a metric can be automated, but the metric is difficult to assess (i.e., grade performance) because the desired value for the metric depends on what is happening in the scenario, or there are several equally valid values. AEMASE can support real-time assessment and scenario adaptation by operationalizing complex or ‘‘fuzzy’’ assessments. Based on a combination of relevant performance and state metrics, AEMASE can thus be used to determine the level of expertise to which a trainee’s overall performance and state are most similar. This comparison can be made in near real time, thereby feeding the resulting categorization back to the ADAPT-DM diagnostic component.
ADAPT-DM adaptation component The final component of the ADAPT-DM framework is the adaptation component, which precisely adapts training to support individualized DM skill development, based on the outcome of the diagnostic component. It uses a hierarchical adaptation strategy to adapt training without disrupting learning. Specifically, Bruner’s (1973) constructivist theory can be formulated into a hierarchical adaptation strategy by applying the following principles:
N
N
N
First, consider the student’s willingness and ability to learn (i.e., cognitive readiness, as assessed via EEG-based cognitive state metrics). This adaptation stage should aim to enhance learning state to ensure learning can occur and mitigate any negative learning states, such as drowsiness and distraction. Second, structure training so that concepts can be easily grasped by trainees and skills deficiencies can be addressed (i.e., spiral organization). This adaption stage should aim to improve knowledge and skills to allow development of skilled performance and prevent trainees from practicing bad habits or perpetuating incorrect performance or error patterns. Third, once performance is at target performance levels, design difficult cases that facilitate extrapolation and fill any gaps in training (i.e., encourage trainees to go beyond the information given). This adaptation stage should aim to increase expertise levels to boost efficiency and effectiveness of performance by providing trainees with practice opportunities and instruction de-
Figure 3. Adaptation goals with respect to diagnosed problem areas.
signed to move them up the expertise continuum to skilled performance (Figure 3). A generalizable adaptation matrix was constructed detailing adaptation strategies that can be used to address each stage in the hierarchical adaptation strategy (Table 4).
Case study: Submarine navigation, contact evaluation task As a proof-of-concept, the ADAPT-DM framework was conceptually applied to submarine navigation, particularly the contact evaluation task, which is a critical decision point in navigation. Based on a task analysis, it was determined that the contact evaluation task (Figure 4) entails the following perceptual, cognitive, and response components. Perceptual components: (1) scan the radar display for contacts; (2) detect contacts; (3) scan for other relevant cues to assess the contact. Cognitive components: (4) assess contact relationship to own ship; (5) use tools to aid in assessing contact relationship; (6) decide whether contact is of enough concern to monitor. Response components: (7) hook and monitor contact; (8) communicate contact information to the Contact Coordinator (CC). Based on the task analysis, behavioral performance metrics (including eye tracking metrics) were identified for all tasks within the task flow (Table 5). In addition, EEG-based cognitive state metrics were identified to assess trainee state (Table 2). Based on the performance metrics identified, the next step is diagnosing the adequacy of DM performance. While many of the metrics have straightforward thresholds, which divide good and poor performance (e.g., relevant contact hooked or not), several of the metrics have complex performance thresholds (e.g., scan data). It was determined that AEMASE machine 31(2) N June 2010
253
Carroll et al.
Table 4. Adaptation strategies. Performance Good
Expertise
Real time adaptation
Expert
Criterion
Increase difficulty
Expert
Optimal learning state
None
Journeyman
Optimal learning state
None
Journeyman
Nonoptimal learning: drowsy
Increase pace of training
Journeyman
Nonoptimal learning: distracted Nonoptimal learning: drowsy
Novice
Novice Bad
Diagnosis
Journeyman
Journeyman
Nonoptimal learning: distracted Skill deficiency
Nonoptimal learning: drowsy
Novel situation to challenge Auditory cue to bring back into focus Give positive feedback until not drowsy: ‘‘You are scanning relevant areas, keep up the good work!’’
Auditory cue to bring back into focus Hints to abbreviate process or increase efficiency of performance Correction of error patterns/bad rules/ misapplication of good rules Cue to wake them up Increase volume of auditory cues
Journeyman
Nonoptimal learning: distracted
Novice
Skill deficiency
Novice
Nonoptimal learning: drowsy
Novice
Nonoptimal learning: distracted
Increase intensity of visual cues Auditory cue to bring back into focus— feedback relevant to performance decrements Scaffolding to assist in building rules (training wheels, faded feedback, etc.) Feedback to deal with typical failure modes Give feedback on errors until not drowsy: ‘‘You are spending too much time on irrelevant areas.’’ Auditory cue to bring back into focus— feedback relevant to performance decrements
Figure 4. Contact evaluation task.
254
ITEA Journal
Future adaptation Once criterion met for highest level of difficulty, move on to new training objective Continue practice at this level of difficulty Continue practice at this level of difficulty Give trainee a break, encourage to get up and walk around Increase difficulty of next scenario Increase difficulty of next event Give trainee a break, encourage to get up and walk around Continue practice at this level of difficulty Continue practice at this level of difficulty Decrease difficulty of next event
Give trainee a break, encourage to get up and walk around Continue practice at this level of difficulty Continue practice at this level of difficulty Decrease difficulty of next event
Give trainee a break, encourage to get up and walk around Decrease difficulty of next event Decrease difficulty of next event
Developing a Decision Making Trainer
Table 5. Behavioral performance metrics for the contact evaluation task. Task Scan radar screen for contacts
Detect contact
Scan relevant cues needed to assess contact
Assess contact relationship to ship Use tools to assess contact relationship to ship (e.g., threat rings) Decide whether contact is of concern enough to monitor Decide whether contact is of concern enough to report to CC Hook contact/not Communicate contact to CC/not
Metrics Appropriate view/scale of Field of View (FOV) % of relevant areas scanned % of areas scanned that were relevant Time until each/all relevant areas scanned Overall fixation duration on individual AOIs and screen Average fixation duration (on relevant and irrelevant) No. of times scan pattern changes directions (and moves significant length) Target fixated (yes/no) Time until first target fixation No. of target fixations Duration of target fixations (average duration, total duration) % of areas scanned that are relevant (cues and contact) Appropriate view/scale of FOV % of relevant areas scanned % of areas scanned that were relevant Time until each/all relevant areas scanned Overall fixation duration on individual AOIs and screen Average fixation duration (on relevant and irrelevant) No. of times scan pattern changes directions (and moves significant length)—fixation pattern on contact, on cue, on contact, on cue No. of target fixations Duration of target fixations (average duration, total duration) Appropriate tool use (occurrence and duration of use) No. of fixations on tools Reaction time (time from detection/fixation until response) No. of target fixations Duration of target fixations (average duration, total duration) Reaction time (time from detection/fixation until response) No. of target fixations Duration of target fixations (average duration, total duration) Response accuracy: contact hooked or not Response time (time from start to completion of response) Response accuracy: Occurrence of communication to CC (either measured via instructor event-based checklist or voice recognition/Sandi software) and whether contact relevant Response time (time from start to completion of response)
learning models (Abbott 2006) could be used to compare performance on these metrics to expert and novice models to effectively assess performance. Each metric was thus defined by the behavioral or physiological variables for expert or novice comparison, the contextual variables that determine appropriate behavior or expected physiological response, and the algorithm proposed for modeling expected behavior from the context (Table 6). Most of the proposed metrics deal with the allocation of attention over time. These metrics can be implemented with occupancy grids. An occupancy grid is a two-dimensional histogram that accumulates the amount of time spent in each cell of a grid. It is weighted to reflect the recent past using a decay function. The visualization of an occupancy grid is similar to heat maps used in eye tracking studies. However, the purpose of the occupancy grid is not mainly to produce a visualization; rather it is to create a
quantifiable similarity metric for expert versus trainee attention allocation. The relevance of a context is determined by a similarity metric over contextual variables, such as the positions of a submarine and contacts, and by ocean currents, etc. The similarity between expert and trainee actions is the cross product (or area of overlap) between the expert and trainee occupancy grids. In the example occupancy grid in Figure 5, a trainee student (S, Left) is navigating toward a port in the presence of other surface vessels. The knowledge base (1-3, Right) contains recordings of previous expert scenario executions. The knowledge base is searched for relevant contexts (1 and 2, highlighted in green), defined by similar positioning of the submarine and other vessels, currents, etc. After selecting relevant contexts 1 and 2 (Figure 5), AEMASE determines whether the trainee’s actions are similar to any performed by an expert. The red areas 31(2) N June 2010
255
Carroll et al.
Table 6. Metrics proposed for AEMASE evaluation. Metric
Description
Context
Algorithm
Radar operators control display settings specifying area and scale. Maintaining overall situational awareness requires adjusting the settings to maintain the ‘‘big picture’’ while frequently zooming in to view important detail. Radar operators must maintain situational awareness to react promptly to new radar returns. A delayed reaction reduces the amount of time to take measures in response to the new contact.
Position of the submarine in the port, presence of tracks, and distracters.
Occupancy grid.
The position of the new contact relative to the carrier. Other contacts or navigation by own ship may also influence the allowable reaction time.
One-sided Gaussian distribution of expert reaction times, which captures the proportion of experts requiring at least x seconds to respond.
The relevance of areas is conditioned on the terrain (contour of the ocean floor or inlet). Relevance also depends on entities in the scenario, including their locations, attributes, and actions. The relevance of areas is determined as before, by retrieving examples of expert attention allocation in similar contexts.
Using the occupancy grid, this is the area of the overlap between student and expert scan areas, divided by the expert’s total scan area.
Metrics collected from the simulation Field of view and zoom scale of radar operator interface
Reaction time for appearance of new contact
Metrics collected from eye tracking Percentage of relevant areas scanned
This metric quantifies whether the student is monitoring all areas that an expert would monitor. It requires correlating the view area (determined by radar scope settings) with the onscreen gaze position.
Percentage of areas scanned that were relevant
This metric quantifies whether the student is spending an inordinate amount of time and effort monitoring areas that are unlikely to be salient. The hypothesis is that experts know which cues in the environment are most salient, while novices’ patterns of attention allocation are more randomized.
show where the trainee student (S, Left) or experts (1,2 Center) have been looking recently. S*1 and S*2 are the dot product (or overlap) of trainee student attention with expert attention 1 and 2, respectively. S*1 (highlighted in green) has the larger area. However, S*1 covers only a portion of 1, so the trainee is neglecting some important areas. The composite diagnosis is driven by an expertise model that integrates the AEMASE metrics with eye tracking and EEG data to assess trainee proficiency. The first step in this data integration process was to
Figure 5. Comparing expert versus student actions with occupancy grids.
256
ITEA Journal
Using the occupancy grid, this is the area of the overlap between student and expert scan areas, divided by the student’s total scan area.
identify a minimal set of skills necessary to characterize trainee performance and expertise. Because trainees learn a progression of skills throughout their training, metrics that are appropriate for novices might be irrelevant for experts (and vice versa). Through the skills identification process, relevant metrics can be identified for trainees at each level in the training progression. Then Principal Component Analysis (PCA) can then be used to identify skill dimensions that reflect each proficiency level. Table 7 shows hypothetical data as an example. In the example, three metrics have been applied to four trainees. The metrics include: ScanRelevance, which is the overlap between expert and trainee occupancy grids from eye tracking data; RadarZoom, which is the overlap between expert and trainee occupancy grids from radar center of view/zoom settings, and ResponseTime, which is the number of seconds from the appearance of a new track until it is hooked by the trainee. Figure 6 shows a scatter plot for each pairing of two variables with the hypothetical data. The values for RadarZoom and ScanRelevance are strongly correlated; they lie nearly on a straight line. This means either can be accurately predicted from the
Developing a Decision Making Trainer
N
Table 7. Hypothetical metric data. Trainee
ScanRelevance
RadarView
ResponseTime
1 2 3 4
.80 .50 .49 .74
.75 .55 .40 .81
8 4 7 3
other, so there is no need for both. Thus—in this hypothetical sample—trainees who correctly select radar settings also tend to focus visual attention on the most important areas. ResponseTime, in contrast, is not strongly correlated with either of the other metrics. From these data, PCA would identify two dominant dimensions: The first would correspond closely with both ScanRelevance and RadarView, and the second with ResponseTime.1 The second step of the expertise model assesses general expertise. For this aspect of the diagnosis, an instructor assesses the general expertise of each trainee by watching the trainee execute a task scenario. A model of the instructor’s assessment is trained using multiple linear regression and the trainee’s skill ratings as predictors. Models for different expertise levels (i.e., novice, journeyman, expert) use different skills (Klein and Hoffman 1992), so the expertise model is particular to each skill level. The model also reveals the importance of each skill in the instructor’s general assessment of expertise. The model is intended to yield several insights:
N N
The system simulates the instructor’s assessment of general expertise of trainees in the future. If a skill does not contribute significantly to overall expertise, it might be because the skill is not very important. Alternately, it might be that the selected task scenarios do not exercise the skill, and additional scenario development is needed.
N
If the model does not fit the instructor assessments very well, it may be that the set of metrics (and physiological metrics) is insufficient, and new metrics should be added. Or, overall expertise might be a nonlinear function of the skills. In this case nonlinear models (e.g., neural networks, support vector machines, etc.) could be explored. Alternately, the instructor’s assessments might simply be subjective and unreliable. Creating models for several instructors would allow for determination of whether instructors are consistent with each other in assessing expertise and placing value on particular skills.
The expertise model was explored by prototyping the algorithms for the model. The prototype was implemented using synthetic data, so the associated results (such as figures showing the contribution of specific metrics to the expertise model) are notional and serve only to illustrate the expertise model concept. In developing the prototype, we simulated a subject population of 75 students grouped into three levels of expertise (novice, intermediate, and expert) for the set of metrics presented in Table 8, which lists the population mean and standard deviation for each metric broken down by level of expertise. The units for each metric in the synthetic data set are not specified (e.g., negative values have no special significance). In the prototype, PCA was performed on the data for each level of expertise independently to explore the hypothesis that different skills are developed at each level of expertise. Figure 7 shows a ‘‘scree plot’’ for components of variance (skills) for intermediate-level students. This plot shows that most of the variance from the 14 original metrics is explained by only the first 2 principal components (52%), and the first 4 capture 80%, while the first 6 metrics capture 90% of the metrics. Thus it is possible to construct new composite metrics to simplify trainee assessment.
Figure 6. Scatter plot for each pairing of two variables with the hypothetical data.
31(2) N June 2010
257
Carroll et al.
Table 8. Synthetic data. Mean
RADARView ReactionTime ResponseTime Workload Engagement Distraction Drowsiness GazeCoverage GazeRelevance GazeTargetTime GazeTargetDuration GazeToolFixations BlinkRate PupilSize
Novice
Intermediate
Expert
Novice
Intermediate
Expert
1.05 3.14 6.04 10.60 2.01 0.83 3.55 13.30 15.71 19.21 1.46 11.42 10.93 5.05
4.63 4.92 8.01 21.17 2.12 0.90 4.27 26.76 41.79 57.07 0.72 216.52 10.05 5.38
7.87 7.14 10.19 216.71 2.05 1.25 3.48 61.92 96.01 65.92 27.45 215.48 12.20 4.85
2.06 1.18 2.42 2.31 0.49 1.27 1.85 3.85 4.52 4.34 1.67 4.47 3.06 1.26
1.67 1.73 2.15 2.08 0.39 0.82 1.96 4.35 4.11 3.11 1.30 2.94 2.54 1.21
1.72 1.89 2.19 2.90 0.62 1.07 1.38 3.84 4.67 4.47 1.47 3.41 2.54 1.39
As such, composite metrics were extracted. Each of the principal components is a composite metric, which is a combination of the 14 original metrics. But in most of the composite metrics, only a few of the original metrics have significant influence. For the intermediate trainee in the synthetic data set, most of the weight in the first principal component is assigned to Distraction. Metrics that do not contribute significantly to the composite metrics may be discarded entirely. Figure 8 shows the original 14 metrics projected onto the three first principal components, which reveals which of the original metrics best align with the principal components. This information is used to derive meaningful names for the composite metrics. Based on the aforementioned three-tier diagnoses (DM performance, learning state, and expertise), it was then necessary to identify how these streams of data would be integrated to identify adaptation trigger
Figure 7. Scree plot for intermediate level of expertise.
258
ITEA Journal
Standard deviation
points. First, the diagnosis engine would continuously assess cognitive state based on neurophysiological measures, including levels of workload, engagement, distraction, and drowsiness. These assessments would be based on predefined thresholds and evaluate adequacy of cognitive learning state. Second, the diagnosis engine would assess predefined behavioral and physiological (i.e., eye tracking) performance metrics associated with each step in the DM process (see description of the SHOR DM model; Wohl 1981). Third, the diagnostic engine would identify the level of expertise the trainee’s performance and state that most closely matches based on a combination of all relevant performance and state metrics. Based on outputs from these two steps, the diagnostic engine would place the trainee within one of three categories:
Figure 8. The original 14 metrics projected onto the three first principal components, which correspond roughly with engagement, drowsiness, and radar view settings.
Developing a Decision Making Trainer
Figure 9. ADAPT-DM real-time diagnosis concept.
1. Performance to criterion in which the trainee’s performance is effective and efficient across a broad range of situations, 2. Optimal learning state in which a trainee’s performance is effective; however, practice is necessary to increase efficiency and build experience base, 3. Nonoptimal learning state in which the trainee is having performance or state issues that need remediation or cognitive state issues that need mitigation. Students in the last category would be further categorized based on performance and state indicators to pinpoint the root cause of nonoptimal learning state, specifically identifying whether there was a skill deficiency or a cognitive state deficiency of drowsiness or distraction. Based on these categorizations and the context-specific performance measures, appropriate adaptations would be triggered (Figure 9). Table 9 presents the generalizable diagnosis matrix that shows precisely how the streams of data will be combined and resulting diagnoses.
Conclusions This effort has resulted in conceptualization of the ADAPT-DM framework for supporting precision
training, which is adaptive to trainees’ differing needs, skill proficiency levels, learning states, and expertise levels. Implementation of this framework into a training system should accelerate DM skill development by
N N
N
Developing a comprehensive picture of a trainee’s knowledge, skills, and cognitive state through continuous performance and state measurement. Using sophisticated models of expert and novice performance to evaluate expertise, along with performance and learning state, to understand key deficiencies and opportunities to accelerate learning. Ensuring an optimal mix of experiences and instruction (such as real-time feedback, real-time scenario modification, and automated cueing and scaffolding strategies) to rapidly develop robust and effective DM skills.
Through root cause analysis based on physiological and neurophysiological data, ADAPT-DM goes beyond simply assessing whether trainees made good decisions. Process level measures become feasible, enabling instructors to pinpoint where in the DM process breakdowns occurred. The expected benefits of a system based on the ADAPT-DM framework are
N
Training is compressed and accelerated because the system detects and adapts to the acquisition of specific skills, learning state, and expertise. 31(2) N June 2010
259
Carroll et al.
Table 9. General diagnoses. Performance measures Performance Workload/difficulty Good
Low
High
Engagement
Distraction
Drowsiness
Expertise
High
Low
Low
Low
Low
High
Low
High
Low
High
Low
Low
Low
Low
High
Expert Journeyman Novice Expert Journeyman Novice Expert Journeyman Novice Expert Journeyman Novice Expert Journeyman Novice Expert Journeyman Novice Expert Journeyman Novice Expert Journeyman Novice Expert Journeyman Novice Expert Journeyman Novice Expert Journeyman Novice Expert Journeyman Novice
Low
Bad
Low
High
Low
Low
High
High
Low
Low
N N
High
Low
Low
High
Low
Low
High
Trainees are better prepared for live training and operations by ensuring an optimal experience base. Seamless integration with existing DM trainers. C
Dr. MEREDITH CARROLL is a senior research associate at Design Interactive, Inc., and is currently supporting design, development, and evaluation of performance assessment tools and virtual training systems for the office of Naval Research’s Human Performance, Training and Education (HPT&E) Program. Her work focuses primarily on Individual and Team Performance Assessment, including physiological and behavioral measurement, performance diagnosis, and training remediation through feedback and training adaptation. She has also performed 260
ITEA Journal
Low
Low
High
Low
Low
High
Low
Diagnosis Criterion Optimal learning state Criterion Nonoptimal learning: drowsy Criterion Nonoptimal learning: distracted Optimal learning state Optimal learning state
Nonoptimal learning: drowsy Nonoptimal learning: drowsy Nonoptimal learning: distracted Nonoptimal learning: distracted Skill deficiency Skill deficiency Nonoptimal learning: drowsy Nonoptimal learning: drowsy Nonoptimal learning: distracted Nonoptimal learning: distracted Skill deficiency Skill deficiency Nonoptimal learning: drowsy Nonoptimal learning: drowsy Nonoptimal learning: distracted Nonoptimal learning: distracted
extensive work conducting Task Analyses, designing Virtual Training Environments and Training Management tools, and conducting training effectiveness evaluations. Her research has focused on human–team performance and training in complex systems in aviation and military domains, with the focus on perceptual skills. She received her bachelor of science degree in aerospace engineering from the University of Virginia, her master of science degree in aviation science from Florida Institute of Technology, and doctor of philosophy degree in human factors and experimental psychology from the University of Central Florida. E-mail: Meredith@designinteractive. net SVEN FUCHS is a senior research associate at Design Interactive, Inc., where he is currently involved with the development of adaptive training frameworks that are enhanced with physiological sensors. He previously sup-
Developing a Decision Making Trainer
ported several Augmented Cognition research projects sponsored by DARPA, IARPA, and ONR. Sven has authored and coauthored over 10 papers and 3 book chapters on Augmented Cognition. In 2006, he was named an ‘‘Augmented Cognition Ambassador’’ and received the Augmented Cognition International Society’s ‘‘Foundations of Augmented Cognition’’ award. Other interest areas include usability evaluation, multimodal interface design, and innovative human–system interface technologies. He holds an undergraduate degree in computer science for media from the Flensburg University of Applied Science in Germany and was a Fulbright scholar at DePaul University, Chicago, where he earned a master of science degree in human-computer interaction. E-mail:
[email protected] ANGELA CARPENTER is a research associate in Design Interactive, Inc.’s Human Systems Integration (HSI) division with 4 years of HSI experience. Her work has focused on use of multimodal design science to optimize operator situational awareness and workload in C4ISR environments, development of neurophysiological metrics to assess signal detection, and assessment of astronaut cognitive state via a handheld game. She received her master of science degree in human factors and systems at Embry-Riddle Aeronautical University with a focus on human–systems integration and systems engineering, where she was a graduate teaching assistant involved in pilot training studies. She earned a bachelor of arts degree from Flagler College in psychology and Spanish. E-mail:
[email protected] DR. KELLY HALE is the human–systems integration director at Design Interactive, Inc., and has over 10 years’ experience in human-computer interaction, training transfer, usability evaluation methods of advanced technologies, and cognitive processes within multimodal systems and virtual environments. Kelly has been involved with DARPA’s AugCog program and ONR’s VIRTE program, and has gained extensive experience in evaluating various devices using a variety of empirical and nonempirical usability evaluation methods. She has been principal investigator of multiple Phase I and II SBIR efforts funded by ONR, DARPA, and NASA, and was research and technical lead of innovative augmented cognition technology development funded by IARPA. Kelly directed Multimodal Information Design Support product development, which is currently being transitioned into the IMPRINT modeling software. Kelly holds a bachelor of science degree in kinesiology/ergonomics from the University of Waterloo, Canada, and master of science and doctor of philosophy degrees in industrial engineering from the University of Central Florida. E-mail: Kelly@ designinteractive.net DR. ROBERT G. ABBOTT is a principal member of the technical staff in the Cognitive and Exploratory Systems
group at Sandia National Laboratories, where his team develops software for automated behavior modeling. He holds a doctor of philosophy degree in computer science from the University of New Mexico. He has been a member of the technical staff at Sandia since 1999. His current research focuses on automating the creation of human behavior models with the objectives of reduced cost and rapid development. Applications include trainable software agents to assume the roles of friendly and opposing forces, and automated student assessment for distributed virtual training environments. This line of research is supported primarily by the U.S. Navy and includes validation experiments with human subjects to assess the impact of new training technologies. Other research interests include distributed systems, security-related data mining, and computer vision. E-mail:
[email protected] DR. AMY BOLTON is a program officer at the Office of Naval Research where she manages applied research and advanced technology demonstration projects as part of the Code 34, Capable Manpower Future Naval Capability program. Dr. Bolton’s portfolio includes manpower, personnel, training and human system design projects. The aim of the projects is to increase human performance by advancing training methodologies and technologies, devising better personnel selection tools, and designing better systems to take the operator’s capabilities and limitations into consideration. Prior to joining the Office of Naval Research, Dr. Bolton was a research psychologist at the Naval Air Warfare Center Training Systems Division in Orlando, Florida where she served in the role of principal investigator on a variety of research efforts. E-mail:
[email protected]
Endnotes 1 It would also identify a third dimension but with a very small eigenvalue, indicating that the third dimension is negligible.
References Abbott, R. G. 2006. Automated expert modeling for automated student evaluation. Intelligent Tutoring Systems 4053: 1–10. Berka, C., D. J. Levendowski, M. Cvetinovic, M. M. Petrovic, G. F. Davis, M. N. Lumicao, M. V. Popovic, V. T. Zivkovic, and R. E. Olmstead. 2004. Real-time analysis of EEG indices of alertness, cognition and memory acquired with a wireless EEG headset. International Journal of Human-Computer Interaction 17 (2): 151–170. Berka, C., D. J. Levendowski, M. N. Lumicao, A. Yau, G. Davis, V. T. Zivkovic, R. E. Olmstead, P. D. Tremoulet, and P. L. Craven 2007. EEG correlates of task engagement and mental workload 31(2) N June 2010
261
Carroll et al.
in vigilance, learning, and memory tasks. Aviation Space and Environmental Medicine 78 (5, Suppl.): B231–B244. Berka, C., D. J. Levendowski, P. Westbrook, G. Davis, M. N. Lumicao, R. E. Olmsted, et al. 2005. EEG quantification of alertness: Methods for early identification of individuals most susceptible to sleep deprivation. In Proceedings of the SPIE Defense and Security Symposium, Biomonitoring for Physiological and Cognitive Performance during Military Operations, ed. J. A. Caldwell and N. J. Wesensten, vol. 5797, 78–89. Orlando, FL: SPIE: The International Society for Optical Engineering. Bruner, J. 1973. Going beyond the information given. New York: Norton. Craik, F. I., R. Govoni, M. Naveh-Benjamin, and N. D. Anderson 1996. The effects of divided attention on encoding and retrieval processes in human memory. Journal of Experimental Psychology General 152 (2): 159–180. Dorneich, M. C., S. D. Whitlow, S. Mathan, P. M. Ververs, D. Erdogmus, A. Adami, M. Pavel, and T. Lan. 2007. Supporting real-time cognitive state classification on a mobile individual. Journal of Cognitive Engineering & Decision Making 1 (3): 240–270. (Special Issue on Augmented Cognition: Past, Present, and Future). Elliot, T., M. Welch, T. Nettlebeck, and V. Mills. 2007. Investigating naturalistic decision making in a simulated microworld: What questions should we ask? Behavior Research Methods 39 (4): 901–910. Endsley, M. R. 1995. Toward a theory of situation awareness in dynamic systems. Human Factors 37 (1): 32–64. Foerde, K., B. J. Knowlton, and R. A. Poldrack. 2006. Modulation of competing memory systems by distraction. Proceedings of the National Academy of Sciences of the United States of America 103 (31): 11778–11783. Hyo¨na¨, J., R. Radach, and H. Deubel, eds. The mind’s eye: Cognitive and applied aspects of eye movement research. Amsterdam, The Netherlands: North-Holland. Klein, G. A. 1998. Sources of power: How people make decisions. Cambridge, MA: MIT Press. Klein, G. A., and R. R. Hoffman. 1992. Seeing the invisible: Perceptual-cognitive aspects of expertise. In Cognitive science foundations of instruction, ed. M. Rabinowitz, 203–226, Mahwah, NJ: Erlbaum. Klein, G. A., and K. J. Peio. 1989. Use of a prediction paradigm to evaluate proficient decision making. The American Journal of Psychology 102 (3): 321–331. 262
ITEA Journal
Levonian, E. 1972. Retention over time in relation to arousal during learning: An explanation of discrepant results. Acta Psychological 36 (4): 290–321. Lipshitz, R., G. Klein, J. Orasanu, and E. Salas. 2001. Taking stock of naturalistic decision making. Journal of Behavioral Decision Making 14 (5): 331–352. Macklin, C., M. J. Cook, C. S. Angus, C. S. G. Adams, S. Cook, and R. Cooper. 2002. Qualitative analysis of visualisation requirements for improved campaign assessment and decision making in command and control. In 21st European Conference on Human Decision Making and Control, ed. C. W. Johnson. Glasgow, Scotland: Department of Computing Science, University Of Glasgow, GIST Technical Report G2002-1. http://www.dcs.gla.ac.uk/,johnson/ eam2002/EAM_2002.pdf (accessed February 21, 2010). Neri, D. F., D. F. Dinges, and M. R. Rosekind. 1997. Sustained carrier operations: Sleep loss, performance, and fatigue countermeasures. Moffett Field, CA: NASA Ames Research Center, http://human-factors.arc.nasa. gov/zteam/PDF_pubs/Nimitz1997.pdf (accessed July 24, 2009. Poythress, M., C. Russell, S. Siegel, P. D. Tremoulet, P. Craven, C. Berka, and D. J. Levendowski. 2006. Correlation between expected workload and EEG indices of cognitive workload and task engagement. In Augmented cognition: past, present and future, ed. D. Schmorrow, K. Stanney, and L. Reeves, 32–44. Arlington, VA: Strategic Analysis, Inc. Rasmussen, J. 1983. Skills, rules, and knowledge; signals, signs, and symbols, and other distinctions in human performance models. IEEE Transactions on Systems, Man, and Cybernetics 13 (3): 257–266. Reason, J. 1990. Human error. Cambridge, UK: Cambridge University Press. Small, R. V., B. J. Dodge, and X. Jiang 1996. Dimensions of interest and boredom in instructional situations. In Proceedings of the 1996 Conference of the Association for Educational Communications and Technology. Washington, D.C.: AECT Publications. Stevens, S. M., J. C. Forsythe, R. G. Abbott, and C. J. Gieseler. 2009. Experimental assessment of accuracy of automated knowledge capture. In Foundations of Augmented Cognition, HCII 2009, San Diego, CA. Berlin, Germany: Springer. Stevens, R., T. Galloway, and C. Berka. 2007. Allocation of time, EEG-engagement and EEGworkload resources as scientific problem solving skills are acquired in the classroom. In Proceedings of 3rd Augmented Cognition International, held in conjunction with HCI International 2007, Beijing, China, July 22– 27, 2007. Heidelburg, Germany: Springer.
Developing a Decision Making Trainer
Wohl, J. G. 1981. Force management decision requirements for Air Force tactical command and control. IEEE Transactions on Systems, Man and Cybernetics 11 (9): 618–639.
Acknowledgments This material is based upon work supported in part by the Office of Naval Research under STTR contract
N00014-09-M-0326. Any opinions, findings, conclusions, or recommendations expressed in this material are those of the authors and do not necessarily reflect the views or the endorsement of the Office of Naval Research. We are grateful to Wendi Van Buskirk and her team at the Naval Air Warfare Center Training Systems Division and the Navy subject matter experts who helped guide the content and design of the ADAPT-DM framework.
31(2) N June 2010
263