Image processing software system developed at Research and. Development Center, Computational Intelligence Lab, Indian. Institute of ..... Company, 1993.
31st Annual In-House Symposium on Space Science and Technology ISRO-IISc Space Technology Cell, Indian Institute of Science, Bangalore, 8-9 January 2015
Development of an optimization based image processing software system for Indian forest resource assessment using Radar Imaging Satellite (RISAT-1) Images S N Omkar and G. Narayana Naik Principal Investigator, Dept of Aerospace Engineering, Indian Institute of Science, Bangalore Ashoka Vanjare andSourabh Rao A Project Assistant, Dept of Aerospace Engineering, Indian Institute of Science, Bangalore P G Diwakar Co- Investigator, NRSC, Hyderabad, India Prashant BK Project Intern, Dept of Aerospace Engineering, Indian Institute of Science, Bangalore
Abstract- This paper examines the results of optimization based Image processing software system developed at Research and Development Center, Computational Intelligence Lab, Indian Institute of Science, Bangalore. Currently we are developing data processing system for processing forest land cover classification problem by using RISAT-1 satellite images. In this paper, we are exploring use of optimization techniques for improving the results and advantage in image analysis.Developed imaging system provides image enhancements, speckle reduction, and image classification; substantially increase the functionality of the software along with application of remote sensing data in different fields. This leads to optimal usage of remote sensing data.
I. INTRODUCTION Basic essential of life is land, water and air. Land cover refers to the physical and biological cover at the surface of the earth, including water, vegetation, bare ground, man-made structures, etc. Land cover information [1] acts as important piece of information for assessment of land utilization and resources optimally. Due to its advancement in digital technology, robustness and cost-effectiveness, remote sensing has been increasingly used to extract land cover information through either manual interpretation or automated classification. Further researchers are using optimization techniques [2] in order to improve usage of available resource. Pattern recognition techniques [3]are commonly conceived to have the capability of improving automated classification accuracy due to their distributed structure and strong capability of handling complex data. Many researchers are using neural networks techniques for land cover classification and comparing with the traditional statistical methods. This paper is divided into six sections, radar dataset, study area, data processing methods, results and conclusion.
II. RADAR IMAGE DATASET
In this section, different space Agencies and their SAR imaging products are given. 1) Indian Space Research Organization (ISRO) and National Remote Sensing Centre (NRSC) Example:RISAT-1 and 2 2)National Aeronautics and Space Administration (NASA) Example: radar Sensor SIR-A, SIR-B and SIR-C. 3) Japan Aerospace Exploration Agency (JAXA) Example: Advanced Land Observing Satellite ALOS 1 and 2 4) European Space Agency (ESA) Example: ENVISAT ASAR Different space agencies have launched different earth observation missions in order to collect earth land surface features. Initially data is acquired, calibration and validation, which involve sensor characterizations, image quality measurements, and accuracy improvement. Processed data is dissimilated to public use as standard products like L0, L1 and L2 products for remote sensing applications. ISRO recently launched a satellite mission with SAR sensor as payload called RISAT-1 satellite. RISAT-1 radar satellite images have information on land surface features. RISAT-1 dataset works in ScanSAR, strip and spot modes to provide images with coarse, fine and high spatial resolutions respectively. This is very useful in different remote sensing applications and one such application is forest resource assessment. III. STUDY AREA
In this section, study is discussed. We have chosen Bangalore region for studying urban vegetation features and Mandya and Mysore region for studying forest vegetation. Forest region consists of agricultural region, water region and hilly regions. We have initially used unsupervised classified techniques for forest region classification before collecting ground truth data.
BACK
HOME
FORWARD
IV. DATA PROCESSING METHODS
In this section, we are discussing different data processing methods. They are: 1) Preprocessing (Geometric correction and Radiometric calibration), 2) Speckle reduction and3) Image Classification. 1) Preprocessing: (Geometric correction and Radiometric calibration) Initially Polarimetric SAR satellite image are pre-processed. Radio metrically [4] calibrate – Calculate Sigma nought and beta nought of the given image and after this step geometric correction is performed. Antenna pattern correction is done to calculate the variation and remove the variations caused in transmission and receiving of signals.
2) Speckle reduction techniques: As polarimetric SAR image is affected by noise [4] so filtering techniques are applied in order to remove the noise. a) Lee Filter: Lee filter is used to smoothen the image and remove noise from data. Lee filtering is a standard deviation based filter that filters data based on statistics computed. Lee filters preserve image edges, sharpness and spatial information compared to low-pass smoothing filter. The image pixel value is replaced by a value calculated using the surrounding connected pixels. b) Enhanced Lee: Enhanced Lee filter is used to reduce speckle in radar imagery which preserving texture and edge information. The Enhanced Lee filter is an advanced version of the Lee filter. Enhanced Lee filter uses local statisticscoefficient of variation for window information. Neighboring image pixel value is put into one of three classes namely a) Homogeneous: the neighboring image pixel value is replaced by the average of the filter window, b) Heterogeneous: The neighboring image pixel value is replaced by a weighted average and c) Point target: The neighboring image pixel value is not changed. c) Frost filter: Frost filter is used to reduce speckle while preserving edges and retaining texture information in radar images. It is an exponentially damped circularly symmetric filter that uses local statistics. The pixel being filtered is replaced with a value calculated based on the distance from the filter center, the damping factor, and the local variance. d) Gamma filter:Gamma filter is used to reduce speckle while preserving edges in radar images. Gamma filter assumes that the data is gamma distributed and filtered image pixels are replaced with a neighbor image pixel value calculated based on the local statistics.
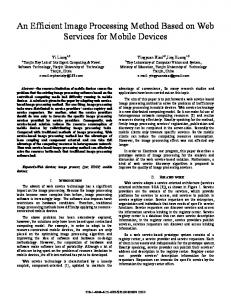
Fig: 1 a) RISAT-1 Polarimetric SAR (Combination hh-hv-hh) is overlaid on the Landsat 8 multispectral optical satellite image and b) RISAT-1 image is compared with Landsat 8 image for urban vegetation classification and c) MysoreForest region is considered as region of interest for forest region classification. Given polarimetric SAR satellite image (HH and HV) is geometrically registered [4-6] to optical satellite image in order to geocoding the data. The geocoded image is shown in figure -1.
e) Local Sigma filter:Local sigma filter is used to preserve fine detail in low, medium and fine resolution image and low contrast areas.It is to reduce speckle significantly by using the local standard deviation computed for the filter box to determine valid image pixels within the filter window. f) Bit Error filter:Bit error filter is used to remove bit-error noise, which is usually the result of speckles in the data caused by isolated pixels that have extreme values unrelated to the image scene. Bit-error removal method uses an adaptive based technique to replace speckle or spike pixels with the average of neighboring pixels. Local statistics like- mean and standard deviation are computed within the filter box and it is used to set a threshold for filtering the desired image quality. g) Gray Level Co-occurrence Matrix filter: In statistical texture analysis, texture features are computed from the
BACK
HOME
FORWARD
statistical distribution of observed combinations of intensities at specified positions relative to each other in the image. According to the number of intensity points (pixels) in each combination, statistics are classified into first-order, secondorder and higher-order statistics. Gray Level Co-occurrence Matrix (GLCM) method [4-7] is a way of extracting second order statistical texture features. GLCM is a matrix where the number of rows and columns is equal to the number of gray levels, in the image. Suppose an image to be analyzed is rectangular and has Nx resolution cells in the horizontal direction and Ny resolution cells in the vertical direction.Let the gray tone appearing in each resolution cellsis Ng quantized levels. Let Lx = {1, 2… Nx} be the horizontal spatial domain, Ly = {1, 2... Ny} be the vertical spatial domain and G = {1, 2...Ng} be the set of Ng quantized gray tones. The set LyxLx is the set of resolution cells of the image ordered by their row- column designations. The image I can be represented as a function which assigns some gray tone in G to each resolution cell or pair of coordinates in LyXLx, such that I: LyX Lx --> G. GLCM is a matrix of relative frequencies Pij with which two neighboring resolution cells separated by distance d occur on the image, one with gray tone i and the other with gray tone j. This matrix is a function of the angular relationship between the neighboring resolution cells as well as a function of the distance between them. Texture measurement requires the choice of window size, quantization levels, displacement value, and orientation factors for each texture measure. In this work, each texture measure/feature have been calculated in all 4 orientation angles (0°, 45°, 90°, 135°) and feature measures of the matrices of all the four orientations are then averaged, to get a directionally invariant matrix.
3) Image Classification methods: In this section, we are discussing different image classification methods [3-4] used in this paper. Unsupervised method: In this section, two unsupervised classification methods are discussed. K-means and ISO clustering method are applied to SAR image in order to identify the vegetation regions. a)K-means clustering: K-Means is an unsupervised classification technique which calculates initial class means in evenly distributed in the data space then iteratively clusters the pixels into the nearest class using a minimum distance technique.Each iteration recalculates class means and reclassifies pixels with respect to the new means. All pixels are classified to the nearest class. By setting a standard deviation value or distance threshold value unclassified image pixels are grouped till they meet threshold criteria. This process is continued till thegive number of pixels in each class are assigned till selected pixel change threshold value or the maximum number of iterations is reached.K means parameters
Mean 1752.132369, Standard deviation 1360.323747, Classes8 and threshold-5 are used for all the filtered images. b)ISO-Data Clustering: ISO-DATA is an unsupervised data clustering technique which calculates class means considering as evenly distributed in the data space then iteratively clusters the remaining pixels using minimum distance techniques.In each iteration,mean is recalculated and the same image reclassified with respect to the new computed means. This process is repeated until the number of pixels in each class changes till selected threshold value is reached else the maximum number of iterations is attained. Supervised classification method: In this section, the three ArtificialNeural Network methods like Multi-Layer Perceptron (NN-MLP),Radial Basis Function - Neural Network(NN-RBF) andCircular Complex valued Extreme Learning Machine(CC-ELM) are discussed. These methods are applied for classification of Multispectral and Polarimetric SAR (Synthetic Aperture Radar) data. Artificial neural network methods c) Neural Networks-Multi Layer Perceptron: Neural Network is a layered feed-forward neural network classification technique. NN-MLP technique uses standard back propagation as supervised learning technique. It can select the number of hidden layers.It uses a logistic or hyperbolic activation function for classification process. NNMLP learns by adjusting the weights in the node to minimize the difference between the output node activation and the output. InNNMLP method, error is back propagated through the network and weight adjustment is made using a recursive process. NNMLP classification technique is used to perform non-linear classification and this method is used as optimized for pattern classification. d) Neural networks-Radial Basis Function:Neural Network - radial basis function (NN-RBF) also uses a feed forward network. It is structurally similar to MLP-NN, but the activation function in the hidden layer nodes is called radial basis activation function and it also uses back propagation as supervised technique. The output of the activation function depends on the location of the center of the function and the spread of the function. The output of a radial basis function can be defined as: ɸ(x) = exp(-|| x – c ||2 / 2*σ2) Eq 1 Where, c is the center of the RBF unit,x is the input and σ is the spread of the RBF unit. The inputs are first normalized using suitable normalization. This activation function in the hidden layer produces a nonzero response when the input falls within kernel function. Each hidden unit has its own receptive fields in input space. The weights connecting the inputs to the hidden layer decide the spread of the activation function and the weights
BACK
HOME
FORWARD
connecting the hidden layer to the outputs is used as a scalar multiplier to the hidden layer outputs. The network output is the sum of weighted hidden layer outputs. The training of the network involves the adjustment of the two sets of weights and updating of centers of the hidden nodes. The mean squared error is determined between the network output and the target output values. The centers and weights are initialized randomly. The weights and centers are optimized using Gradient Descent Back Propagation algorithm, by minimizing the instantaneous mean squared error. The training algorithm aims at minimizing the error and the optimization of the weights and the center location. The training is carried out till the target performance is reached. The network is then tested for performance and generalization using the testing dataset. e) Circular Complex Extreme Learning Machine (CCELM): Circular Complex-valued Extreme Learning Machine (CC-ELM) [23] is designed for handling real-valued classification problems. CC-ELM is a single hidden layer network with non-linear input and hidden layers and a linear output layer. A circular transformation with a translational or rotational bias term that performs a one-to-one transformation of real-valued features to the complex plane is used as an activation function for the input neurons. The neurons in the hidden layer employ a fully complex-valued Gaussian based activation function. The input parameters of CC-ELM are chosen randomly and the output weights are computed analytically. The input and output configurations of CC-ELM are similar to that of MLP and RBF-NN. In CC-ELM the input layer activation function is ‘Circular Transformation’, which maps the real valued data to the complex domain. The transformation function is give in equation 2.
zt = sin ( axt + ibxt + α )
Eq 2
Where:xt is the input vector for the tth sample and observation,such that each of xti is normalized in [0,1]; 0 < a, b ≤ 1, and 0