The conditions for application of Shewhart´s control charts in accordance with
ČSN ISO. 8258:1994 are rarely fulfilled in practice. These charts are not suitable
...
Implementation of modified Shewhart´s control charts Ing. Jan Král Abstrakt Soudobý systém jakosti podniku představuje svojí strukturou složitý interdisciplinární objekt vyžadující pro své řízení vědecké přístupy. Co je z pohledu soudobého globálního podniku prioritou? Je to otázka konkurenceschopnosti. Úsilí řešitelů, projektantů a managerů se proto zaměřuje na procesy u nichž lze postup řešení dokumentovat a lze též posoudit, zda bylo dosaženo cíle. V této oblasti nám může významnou měrou pomoci počítačové zpracování, zejména při tvůrčím užití matematicko statistických metod. Cílem tohoto příspěvku proto je objasnění postupů při aplikaci Shewhartových regulačních diagramů v souladu s ČSN ISO 8258:1994 pro jejichž aplikaci jsou v praxi jen zřídka splněny podmínky a návrh jejich modifikace umožňující jejich použití v průmyslové praxi včetně SW podpory pro vedení regulačních karet v podobě šablon pro MS Excel.
Introduction Control charts are known as one of the seven fundamental tools of quality. Statistical Process Control, or SPC, is methodology, in which operators, supervisors, and managers use control charts for monitoring the output from a manufacturing process to identify and eliminate special causes of variation. SPC is a proven technique for reducing scrap and rework, thus, increasing productivity. Firms use SPC for two basic reasons: • using SPC a firm can determine when to take an action to adjust a process that has fallen out of control, • SPC says when to leave a process without any action Knowing when to leave a process without any adjusting it is equally important in keeping variation at minimum. Many production workers struggle with this concept because they do not understand the nature of variation. Often, they believe that whenever the process output is off-target, some adjustment must be carried out. Such an over adjustment will actually increase the variation in the process output. The conditions for application of Shewhart´s control charts in accordance with ČSN ISO 8258:1994 are rarely fulfilled in practice. These charts are not suitable for some processes from technical practice. Their formal implementation can lead then to serious mistakes or economic losses. In German automotive industry there was accomplished a research of the most common types of processes which are necessary to be controlled by the methods of statistical regulation. The processes that can be controlled by Shewhart´s control charts make only a small part of them. We will consider three of the most common types of processes which are also included among samples for testing SPC softwares. These samples were published as the Appendix of QS 9000-SPC handbook.
1. Description of three of the most common types of processes Type of a process - A: This type of a process assumes that: • Distribution of a quality characteristic in individual moments t = 1, 2, … is followed by a Gaussian distribution with standard deviation σ(t) and mean µ(t ). • Mean µ(t ) is constant in time. • Standard deviation σ(t) is constant in time. • Distribution is predictable and total distribution in a longer time period is followed by a Gaussian distribution with a fixed mean µ0 = µ(t) and fixed standard deviation σ0 = σ(t). Type of a process - B: This type of a process assumes that: • Distribution of a quality characteristic in individual moments t = 1, 2, … is followed by a Gaussian distribution with standard deviation σ(t) and mean µ(t ). • Standard deviation σ(t) is constant in time. • Mean µ(t ) is a variable in a time period in the consequence of occurrence process inherit causes, e.g. a change of a tool, difficult setting etc. • Total distribution in a longer time period can be close to a Gaussian distribution with mean µ0 and σ0 ≥ σ(t). • The Six Sigma methodology allows changes of mean in the range from -1,5σ to +1,5σ. • Most of values are laid inside of tolerance limits for a longer time period (however it is not a condition). Type of a process - C: This type of a process assumes that: • Distribution of a quality characteristic in individual moments t = 1, 2, … is followed by a Gaussian distribution with standard deviation σ(t) and mean µ(t ). • Standard deviation σ(t) is constant in time. • Mean µ(t ) is a variable in a time period in the consequence of occurrence process inherit causes – it shows a trend (in the picture a linear trend is occurring) caused, e.g. by a wear of a tool. It is possible to estimate a shape of the trend. • Provided that there is a monitoring of a process in a short time interval or small slope coefficient of a trend, the total distribution will be somewhat flattened, but close to a Gaussian distribution with mean µ0 and a fixed standard deviation σ0 = σ(t). • The Six Sigma methodology allows changes of mean in the range from -1,5σ to +1,5σ. • Most of values are laid inside of tolerance limits for a longer time period (however it is not a condition). 2. Analysis of individual types of processes regarding the condition of ČSN ISO 8258 The above-mentioned types of processes assume that an immediate probability distribution of an observed quality characteristic is normal. In case of a non-normal distribution of a quality characteristic it is necessary to choose a different approach than mentioned in this article. Processes with quality characteristics distributed nearly normality make an exception. In this
case, the means of subgroups have almost a normal distribution. Further, we will focus on monitoring of a process setting especially on control charts for means. • Shewhart´s control charts are fully suitable for processes of type A and they are designed for the risk of “false alarm” α = 0,00135 in ČSN ISO 8258, i.e. only one out of 740 sample points in average falls randomly out of control limits. A sample point out of control limit is a signal of influence of an assignable cause. This cause has to be identified, removed and such steps have to be taken so that the cause cannot occur again. • If the Shewhart´s control charts are used in types of processes B and C, the risk α of a false alarm will be significantly exceeded. A sample point will occur more often out of one or other control limit. This will bring unnecessary costs and will have demotivation influence on operators who will have to look for a non-existing assignable cause too often.
Notes on processes • Type of a process - A Classical Shewhart´s control charts are based on the assumption that it is possible to describe measured values in subgroups with the same normal distribution N(µ, σ2), where data are mutually independent and parameters µ and σ do not change in time. This situation is described for statistically well-handled process that can be easily predicated and we are entitled to evaluate capability indices. Classical Shewhart´s control charts that suit to the case A of processes use the following control limits, in general: u (1) UCL = µ 0 + 1−α σ 0 ; n u (2) LCL = µ 0 − 1− α σ 0 . n Where µ0 is mean of a process and we estimate it using the arithmetic mean of averages calculated from k subgroups that have size n: 1 k 1 n µˆ = x = ∑ x i , where x i = ∑ xij . (3) k i =1 n j =1 Where xij is the j-th observation (j = 1, 2, …, n) inside of the i-th subgroup (i = 1, 2, … k) and σ0 is standard deviation which describes variability within of subgroups. This is usually estimated by one of the following ways: σ = s / C4 (n) , resp. σ = R / d 2 (n) , (4), (5) where: s =
1 k ∑ si k i =1
R =
1 k ∑ Ri k i =1
and and
si =
1 n ( xij − x i ) 2 ; ∑ n − 1 j =1
Ri = x max,i − x min, i .
(6) (7)
and xmax,i is the maximal and xmin,i is the minimal observed value inside of the i-th subgroup Thereinafter u1-α is the fractile of standardized normal distribution corresponding to probability 1 - α, where α is the risk of false alarm. It is the risk that a value of sample average falls randomly above UCL, or below LCL. For Shewhart´s control charts we choose α = 0,00135, which corresponds to u1-α = 3.
Coefficients C4(n) and d2(n) are tabularized in ČSN ISO 8258. They result from probability distributions of a sample standard deviation and sample range. There are also tabularized the following coefficients in the mentioned norm: A3 (n) = 3 / C 4 (n) n with using of s ; (8) or A2 ( n) = 3 / d 2 ( n) n with using of R .
(9)
Control limits for sample averages are calculated according to the expression showed in ČSN ISO 8258 as follows:
UCL = x + A3(n) s ,
LCL = x - A3(n) s ;
(10)
UCL = x + A2(n) R ,
LCL = x - A2(n) R .
(11)
or: In view of the fact that the classical Shewhart´s control limits suppose a constant mean value and process variability in time, they cannot be used for B and C processes, which occur very often in practice. The risk α, risk of a false alarm, increases considerably for these processes if using Shewhart´s control charts. •
Type of processes B and C
1. Using total standard deviation σtot instead of sample standard deviation in subgroups σ for B and C type of processes, as mentioned in literature, it is possible to extent control limits for sample averages. Total standard deviation σtot is estimated from all the observed values of k subgroups with equal sizes n based on the following formula: 1 k n (12) ∑∑ ( xij − x) 2 . kn − 1 i =1 j =1 Then extended control limits (known also from literature as modified control limits) are given by the following formulas under the knowledge of µ and σtot:
σˆ tot =
UCL = µ +
u 1−α
LCL = µ −
u 1−α
n
σ tot ;
(13)
σ tot . (14) n These control limits have the following formulas when using coefficients published in ČSN ISO 8258 for probability α = 0,00135: UCL = x + A3(n) σˆ tot C4(n); σˆ LCL = x - A3(n) tot C4(n) .
(15) (16)
2. Even such control limits need not be convenient for the control of B or C processes. Many of sample points can fall outside of these boundaries. Only under the condition that we are able to say that particular values {xij} are from the same population, it is possible to use this approach to extend control limits. The following approach is based on presumption that process average is set randomly. Such a process can be described using a normal distribution N(µ, d2). This brings us the following model, which describes a particular observation in subgroups by this way:
xij = τi + εij .
(17)
For ( j = 1, 2, …, n ) and ( i = 1, 2, …, k ), where τi is a realization of random variable representing behavior of process mean, which we can describe by a normal distribution N(µ, d2), and εij are independent errors with mean zero and constant variance σ2 with normal distribution N(0 ; σ2). For variables {τi} and {εij} we can assume that they are stochastically independent. E{τi} = µ ;
(18)
D{τi} = d2 ;
(19)
E{εij} = 0 ;
(20)
D{εij} = σ2.
(21)
Distribution of particular values xij is normal N(µ ; d2 + σ2) with mean E{xij} = µ and standard deviation D{xij} = d2 + σ2. (E marks mean value and D marks variance of relevant random variable). It is possible to describe distribution of averages { x i} by normal distribution N(µ, d2 + σ2/n). Therefore, we can set „extended“ control limits for x in the following formulas: UCL = µ + u1-α d2 + σ 2 / n ;
(22)
LCL = µ - u1-α d2 + σ 2 / n .
(23)
If we do not know the parameters µ, σ2 and d2, it is necessary to estimate them. It is obvious that in normal model the best estimation for the parameter µ will be total average, i.e.: 1 k (24) µˆ = ∑ x i = x , k i =1 where k shows number of logic subgroups. The situation with parameters d and σ is more complicated. The simplest estimation of variance of arithmetic mean is following:
{ }
D x j = d 2 + σ 2 / n = σ x2 ,
(25)
in the classical formula: σˆ 2x = s 2x =
1 k (xi − x )2 . ∑ k − 1 i =1
(26)
This is the best unbiased estimation of variance of all for normal distribution in the framework of this model. Then these extended control limits have the following formula:
UCL = x + u1−α s x ;
(27)
LCL = x − u1−α s x .
(28)
u1-α (fractile of standardized normal distribution) is usually substituted by u1-α = 3 which corresponds with risk of a false alarm 0,00135. It is possible to use this method also in situations when we cannot directly describe individual measurement {xij} by normal distribution, but their distribution is nearly normal (single peak
and symmetrical). Because of the influence of central limit theorem, the distribution of sample means { xi }is practically normal. This can be confirmed by tests in practice. 3. If arithmetical means from subgroups { x i } are not possible to be described as realization of some random variable (for example they are bound by a linear trend or season systematic influences or influenced based on changes of tools), it is necessary to use different method which will respect this non-removable influences. This situation can be included in a general approach (mentioned also in examples in publication QS 9000 - SPC) of the creation of extended control limits. We can extend the original Shewhart´s limits by suitably chosen constant ∆ > 0. Instead of the original Shewhart´s control limits made by formulas: UCL = x + A3(n) s ;
(29)
LCL = x - A3(n) s .
(30)
where s is average sample standard deviation which estimating the inherit variance of an observed process which is characterizing fluctuation inside subgroups, x is average of sample means and A3(n) is a coefficient stated in ČSN ISO 8258, we work with these control limits: UCL = x + A3(n) s +∆;
(31)
LCL = x - A3(n) s - ∆.
(32)
The extension in the form of a strip of width 2∆ is chosen so that we can describe behavior of individual subgroups in a better way. The choice of parameter ∆ depends on nature and knowledge of a manufacturing process.
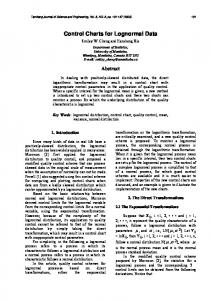
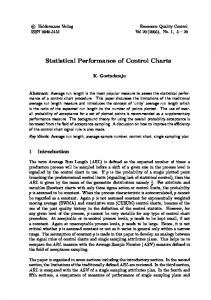
3. EXAMPLES Shewhart´s control limits (marked in red) are compared in the examples shown below for k = 100 and subgroups of size n = 5; “extended” control limits based on total standard deviation σtot (marked in orange); “extended” control limits based on standard deviation of arithmetical means σ x (marked in blue) and “extended” control limits with extension by 2∆ (marked in green). Kolomogorov´s test of normality did not lead to rejection of normality in the abovementioned examples. In all the cases ANOVA showed statistically significant difference of means of populations from which were taken individual subgroups. It is not possible to omit the extended control limits when implementing “Six Sigma”, variability of standard deviation in the range of ±1,5 σ is allowed. In all mentioned examples the variability of standard deviation does not exceed a tolerated range stated in methodology “Six Sigma”. The Shewhart´s control limits specify the narrowest limits with the exception of processes of type A in which all three types of control limits are practically the same. “Extended” control limits are the widest limits σ x based on standard deviation of sample averages.
Type of a process - A Normal distribution N(5; 0,72). Zero deviations of subgroup means from target value 5. Hypothesis of normality was not rejected at significance level α = 0,05. Equality of variance values was not rejected. Equality of mean values was not rejected. In this case ∆ = 0 .
♦
Histogram of C109 Normal 80
Mean 5,029 StDev 0,5873 N 500
70
Frequency
60 50 40 30 20 10 0 3,6
4,2
4,8 C109
5,4
6,0
6,6
Control chart of sample ranges
Průběh individuálních hodnot Time Series Plot of C109 7
6
C109
4,0 3,5
5
3,0 2,5 2,0
4 1,5 1,0 0,5
3 1
50
100
150
200
250 Index
300
350
400
450
0,0
500
1
6
11
16
21
26
31
36
41
46
51
56
61
66
71
76
81
86
91
96
Control chart of sample averages 6,5 Regulační diagram pro výběrové průměry 6,0
5,5
5,0
4,5
4,0
3,5 1
6
11
16
21
26
31
36
41
46
51
56
61
66
71
76
81
86
91
96
101
Natural process limits; σTot Extended process limits; sx bar Extended process limits; ∆ Extended process limits
101
Type of a process - B1 Normal distribution N(5; 0,72). Deviations of subgroup means from target 5 are with distribution N(0; 0,352). Hypothesis of normality was not rejected at significance level α = 0,05. Equality of variance values was not rejected. Equality of mean values was rejected.
Histogram of C109 Normal 60
Mean 5,004 StDev 0,7915 N 500
50
Frequency
40 30 20
In this case ∆ = 1,05 .
10 0 2,4
3,2
4,0
Time Series Plot of C109 Průběh individuálních hodnot
4,8 C109
5,6
6,4
7,2
Control chart of sample ranges
8 7
4,5
6 C109
4,0 3,5
5
3,0 2,5
4
2,0 1,5
3
1,0 0,5 0,0
2
1
1
50
100
150
200
250 Index
300
350
400
450
6
11
16
21
26
31
36
41
46
51
56
61
66
71
76
81
86
91
96 101
500
Control chart of sample averages 7,0
Regulační diagram pro výběrové průměry 6,0
5,0
4,0
3,0 1
6
11
16
21
26
31
36
41
46
51
56
61
66
71
76
81
86
91
96
101
Natural process limits; σTot Extended process limits; sx bar Extended process limits; ∆ Extended process limits
Type of a process - B2 Normal distribution N(5; 0,72). Means of subgroups are normally distributed with variance 0,72 and five means µ1 = 5 ; µ2 = 6 ; µ3 = 4,5 ; µ4 = 5,5 and µ5 = 4. Hypothesis of normality was not rejected at significance level α = 0,05. Equality of variance values was not rejected. Equality of mean values was rejected. In this case ∆ = 2 .
Průběh individuálních hodnot
Control chart of sample ranges
Control chart of sample averages
Natural process limits; σTot Extended process limits; sx ∆ Extended process limits
bar
Extended process limits;
Type of a process - C Normal distribution N(5; 0,72). Mean values has in time rising trend 2/100. Hypothesis of normality was not rejected at significance level α = 0,05. Equality of variance values was not rejected. Equality of mean values was rejected. In this case ∆ = 2 . Control limits B) and C) are identical.
Průběh individuálních hodnot
Control chart of sample ranges
Control chart of sample averages
Natural process limits; σTot Extended process limits; sx bar Extended process limits; ∆ Extended process limits
4. Conclusion The presented solution enables to use Shewhart´s control charts for other common processes types from practice on the condition that variance of mean value of process is non-removable. Regarding its predictive character using statistical process control will have a positive influence on improving quality, increasing customer’s satisfaction, decreasing number of nonconforming products in a manufacturing process, and improving the company image, in general. Several sets of templates for MS Excel are also a part of the solution. These sets enable to implement the methods SPC even there where otherwise it would be difficult to start to use them due to very high costs for implementation of SPC (specialized SW x usage of MS Office). These sets present a complete solution of proved methods that should lead to a successful implementation of this method even by someone who does not have enough skills in SPC field.
Bibliography: [1]
MICHÁLEK, Jiří. Procesy s rozšířenými regulačními mezemi : Research Report No. 1986. Praha : ÚTIA AVČR, srpen 2000.
[2]
MICHÁLEK, Jiří, KŘEPELA, Josef. Koeficienty způsobilosti a výkonnosti v případě rozšířených regulačních mezí : Research Report No. 2009. Praha : ÚTIA AVČR, leden 2001.
[3]
AIAG – Chrysler, Ford, General Motors. QS-9000 – Statistical Process Control (2nd edition), 2005