IEEE TRANSACTIONS ON POWER DELIVERY, VOL. 22, NO. 1, JANUARY 2007
323
Development of Stochastic Aggregate Harmonic Load Model Based on Field Measurements Mau Teng Au, Member, IEEE, and Jovica V. Milanovic´, Senior Member, IEEE
Abstract—The stochastic simulation approach in analyzing harmonic propagation in the distribution network requires an adequate stochastic/probabilistic aggregate harmonic load model. The interaction of individual linear and harmonic loads that form aggregate load characteristic harmonic current spectra is usually very complex and, therefore, it is difficult to establish a model based on theoretical analysis. This paper presents a methodology in developing a stochastic/probabilistic aggregate harmonic load model based on field measurements. The model is a current injection model characterized by means and variances associated with net harmonic current spectra produced by aggregate harmonic loads, and a range of aggregate harmonic load power participation (fraction) into total demand, suitable for application in stochastic harmonic propagation studies in distribution networks. Index Terms—Aggregate harmonic load model, distribution network, harmonic field measurements, harmonic load composition, stochastic.
I. INTRODUCTION
RESENT DAY electrical loads in all sectors of electricity consumers (industrial, commercial, and residential) are typically a mix of linear and nonlinear/power-electronic loads. With the rapid advancement of power-electronic technology and higher energy efficiency achieved from power-electronic driven loads, the use of power-electronic loads is expected to increase. Examples of linear loads are incandescent lamps, motors, heaters, conventional ovens, and air conditioning, whereas nonlinear/power-electronic loads include fluorescent lamps, adjustable-speed drives, converters, computers, and other electronic home appliances, such as television sets, video players, etc. While nonlinear/power-electronic loads are sources of harmonics, linear loads act as damping elements to harmonic propagation and affect the resonance frequency of the distribution system [1]. At the utility medium and low-voltage bus, loads are represented by the aggregate effect of individual loads. For harmonic propagation studies based on the current injection method, it is
P
generally required that the aggregate harmonic load be represented by a harmonic current source in parallel with some linear components such as resistance, inductance, and capacitance. Published papers on harmonic current measurements taken at utility substations [2]–[4] indicated the random nature of harmonic currents produced by aggregate harmonic loads, thus justifying a probabilistic model. Most of the aggregate harmonic load models presented in literature are limited to specific groups of nonlinear loads or formulated based on extensive harmonic measurements. For example, [5] and [6] reported the prediction of net harmonic currents produced by a large number of single-phase power-electronic loads using attenuation and diversity factors. The probabilistic modeling of harmonic currents produced by specific types of nonlinear loads, such as the electric vehicle battery chargers and power converters were reported in [7] and [8]. A simplified process using semiempirical expressions to forecast levels of harmonic current produced by homogeneous nonlinear loads having uniform or normal distribution was illustrated in [9]. In [10], a stochastic load model based on comprehensive harmonic measurements was presented and used to perform harmonic simulation using the Monte Carlo approach. In general, there is a lack of an adequate stochastic/ probabilistic aggregate harmonic load model classified based on customers activities suitable for harmonic propagation studies in the distribution network, particularly at the medium-voltage level. This paper presents a generic approach in developing a stochastic/probabilistic aggregate harmonic load model based on harmonic field measurements. Stochastic/probabilistic models of aggregate harmonic loads were established and classified according to consumers’ sectors/activities (i.e, commercial, residential, and industrial). The application of the model is primarily in stochastic harmonic propagation studies in mediumvoltage distribution networks. The stochastic model described in this paper can be used to establish the aggregate harmonic load model at any bus in any distribution network for which some measurement results or the information about load type and composition are available. II. GENERAL DESCRIPTION OF AGGREGATE HARMONIC LOADS
Manuscript received April 4, 2005; revised January 6, 2006. This work was supported in part by the Malaysian Utility Company and in part by the Tenaga Nasional Bhd. Paper no. TPWRD-00192–2005. M. T. Au is with the Electrical and Electronic Engineering Department, Universiti Tenaga Nasional, Kajang 43009, Malaysia (e-mail:
[email protected]. my). J. V. Milanovic´ is with the School of Electrical Engineering and Electronics, University of Manchester, Manchester M60 1QD, U.K. (e-mail:
[email protected]). Color versions of Figs. 2–8, 11, and 12 are available online at http://ieeexplore.org. Digital Object Identifier 10.1109/TPWRD.2006.881455
Typically, a large number of a variety of linear and nonlinear loads connected at the low-/medium-voltage bus of a distribution transformer, commonly known as the point of common coupling (PCC), form an aggregate load (see Fig. 1). Linear loads do not produce harmonic currents, but are a significant component of the aggregate load as they draw fundamental current and, therefore, affect the current total harmonic distortion at the PCC. On the other hand, nonlinear/harmonic loads produce harmonic currents according to their individual harmonic
0885-8977/$20.00 © 2006 IEEE
324
IEEE TRANSACTIONS ON POWER DELIVERY, VOL. 22, NO. 1, JANUARY 2007
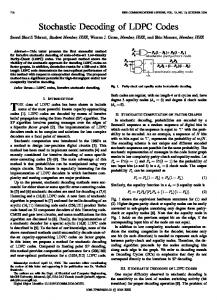
Fig. 2. Fundamental current and third harmonic current variation over time of a residential aggregate load.
Fig. 1. Aggregate harmonic load model.
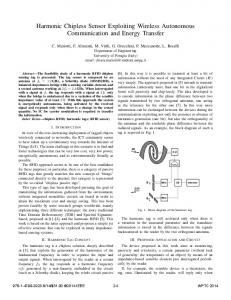
current spectrum. Net harmonic current produced by aggregate harmonic loads (AHL) is usually significantly smaller than the algebraic sum of the harmonic currents produced by the individual nonlinear/harmonic load, mainly due to phase cancellation [5], [6]. The harmonic current spectra of aggregate harmonic loads are primarily influenced by their harmonic load composition and types which, in general, varies according to the class of customers. For example, electronic home appliances, such as television sets, video players, and fluorescent lamps form the majority of nonlinear loads of residential consumers, whereas fluorescent lamps and computers are typical nonlinear loads of commercial consumers. As a result, the composite harmonic current spectrum of a residential AHL is likely to be different from that of the commercial AHL. of the aggregate load (i.e, at the PCC) is influenced by both the participation (fraction) of linear loads into the total demand of the aggregate load as well as composite harmonic current spectra of the AHL. Field measurements have inat the PCC of low-voltage buses typically do dicated that not exceed 20% in comparison to of an individual nonlinear load, which ranges between 20%–120%. In this case, a at the PCC can be attributed to significant reduction in the large fraction of linear loads in the power demand of aggregate load and harmonic current cancellation due to phase-angle diversity. Another characteristic of harmonic currents produced by aggregate harmonic loads is that they are random with a changing average over time. The randomness of harmonic currents produced is due to a variety of factors, such as the random variation of nonlinear load composition based on consumer needs, random operating condition (phase-angle control) of individual nonlinear loads, changes in system parameters, etc. At the same time, the average level of harmonic current distortions at the PCC changes with the total power demand of the aggregate load as illustrated in Figs. 2 and 3.
Fig. 3. Timechart of the measured fundamental current and harmonic current distortions of a hotel load.
III. AGGREGATE HARMONIC LOAD MODELING In the current injection model, aggregate harmonic loads are represented by a single harmonic current source in parallel with the resistive, inductive, and capacitive element [1]. The single harmonic current source represents the net harmonic current spectrum of the AHL connected to the respective bus whereas resistive and inductive elements represent linear loads, and the capacitive element typically refers to power factor correction capacitors. Establishing net harmonic current spectrum of AHL is highly complex and, therefore, the estimation technique using diversity and the attenuation factor is proposed in [5] and [6]. To develop an adequate AHL model, a probabilistic approach is taken as harmonic currents produced at the PCC are random and time variant due to continual changes in system and load parameters, and power demand [2], [11]. A. Representation of Harmonic Loads An AHL is usually made up of a large number and a variety of harmonic loads. Hence, it is not practical and efficient to represent each and every harmonic load individually with a harmonic current source. However, the harmonic loads can be generally classified based on their characteristic harmonic currents and level. In this paper, it is proposed that harmonic loads its found in a particular class of AHL be grouped into four composite types based on their characteristic harmonic currents and
AU AND MILANOVIC´ : DEVELOPMENT OF STOCHASTIC AGGREGATE HARMONIC LOAD MODEL
325
distortion, respectively produced by the AHL, is the weighted coefficient representing the fraction of the respective composite harmonic loads (type 1, type 2, etc.) into the total demand of AHL, and are the magnitude and phase angle corresponding to the th harmonic current distortion, respectively, of the th type composite harmonic loads.
TABLE I DESCRIPTION OF COMPOSITE HARMONIC LOADS
IV. AGGREGATE LOAD MODEL AT PCC
(i.e, low, medium, or high). Table I gives a description of the proposed composite harmonic loads.
A. Participation of Harmonic Loads
B. Harmonic Load Composition Harmonic load composition is a crucial parameter in aggregate harmonic load modeling as it is changing over time and has a significant influence on the harmonic current spectrum and of aggregate harmonic load. In a broad sense, harmonic loads compositions are related to load types based on customer activities and energy usage pattern. For example, during the day period (9.00–17.00 h) of an office complex load, its harmonic load composition is most likely made up of 30–40% type 1 harmonic loads (magnetic ballast fluorescent lamp, etc.), 50%–60% of type 2 harmonic loads (computers, electronic devices, etc.) and 10–15% of type 4 harmonic loads (three-phase converters). On the other hand, during the night period (17.00–24.00 h) of a residential load, its harmonic load composition is likely made up of 30%–40% of type 1 harmonic loads (magnetic ballast fluorescent lamp, etc.), and 60%–70% of type 2 harmonic loads (computers, electronic home appliances, television, electronic ballast fluorescent lamps, etc.). represent With reference to Fig. 1, coefficients the fraction (participation) of the respective composite harmonic loads (type 1, type 2, etc.) into the total demand of AHL. The net is the vector harmonic current spectrum of the AHL sum of the harmonic current spectrum generated by individual connected to the PCC, which composite harmonic loads can be expressed as follows:
(1) which can be written in compact phasor form as follows:
(2)
where and and phase angle corresponding to the
At the PCC, in particular, those with small aggregate loads, harmonic and linear loads are fed through the same cable. Hence, it is not possible to separately measure harmonic (see Fig. 1). current distortions produced by AHL Therefore, from a practical point of view, an expression for harmonic current distortions at the PCC (which is inclusive of current drawn by all linear loads) needs to be formulated as shown in (3).
are the magnitude th harmonic current
The harmonic current distortion at the PCC is therefore dependent on the power participation (fraction) of harmonic loads into the total demand of aggregate load (see Fig. 1). From (2), the harmonic current spectrum at PCC can then be expressed as follows: (3) and are the magniwhere tude and phase angle, respectively, corresponding to the th haris the fracmonic current distortion at PCC, tion of harmonic loads participating into the total demand of the aggregate load. B. Stochastic Model Field measurements indicate that harmonic current distortions at the PCC vary randomly with a trend component closely correlating with the power demand of the aggregate load. The random variation is primarily due to the combined effect of continuous changes in operating conditions (for example, ASD which produced different harmonic current distortions depending on its load conditions), and/or usage pattern of linear and nonlinear loads (switching “on” and “off” based on needs). At the same time, there is a need to account for uncertainties in harmonic current distortions of the respective composite harmonic loads due to various factors. For example, the harmonic current spectrum of composite harmonic loads is expected to deviate from sample measured results within a range due to the different types/manufacturers of electronic equipments (personal computers, printers, photocopy machines, television, etc.) (see Table IV). Hence, random variables are used to represent aggregate har, , , ) associated with the monic load parameters ( production of harmonic current distortions at the PCC. Equation (3) is therefore modified and written in its normalized form as follows to represent random characteristics of harmonic current
326
IEEE TRANSACTIONS ON POWER DELIVERY, VOL. 22, NO. 1, JANUARY 2007
TABLE II MEAN AND STANDARD DEVIATION OF AHL PARAMETERS ESTABLISHED BASED ON FIELD MEASUREMENT RESULTS
C. Time-Variant Harmonic Current Spectrum
Fig. 4. Fifth harmonic current distortion at the PCC of shopping complex load based on a one-week period.
distortions at the PCC:
(4)
where denotes random variables corresponding to the probability density function (PDF) that describes harmonic current spectrum at the PCC, denotes random variables that correspond to the PDF that describes a fraction of the AHL participating into the total denotes random variables demand of the aggregate load, corresponding to the PDF that describes a weighted coefficient representing the fraction of the respective composite harmonic loads (type 1, type 2, etc.) into the total demand of AHL, and denote random variables corresponding to the PDF that describes the magnitude and phase, respectively, of the th harmonic current distortion of the th-type composite harmonic loads.
As mentioned previously, harmonic currents at the PCC vary randomly with a trend component closely associated with the power demand of the aggregate load. Since overall power demand of most aggregate loads varies with time, harmonic current distortion at the PCC is therefore time variant. For example, it can be seen in Fig. 4 that the 5th and 7th harmonic current distortions closely correlate with the fundamental current (i.e, power demand) of the hotel load, where higher overall harmonic current distortions corresponds to a period of high demand in this case. Hence, to account for the time-variant characteristic of harmonic current distortions at the PCC, periods of high- and lowpower demand are defined for each category of aggregate loads, , , and random variables representing AHL parameters ( , ) are characterized based on respective periods. For example, in the case of the hotel load shown in Fig. 4, its low demand period is defined as being between 0.00–10.00 h and a high demand period between 10.00–24.00 h. Periods of low and high demand of the hotel, residential, bank, hospital, shopping complex, and printing factory loads and their corresponding and standard deviation AHL parameters defined by mean are shown in Table II. V. HISTOGRAM SAMPLES OF HARMONIC CURRENT DISTORTIONS FROM FIELD MEASUREMENTS Statistical plots of harmonic current distortions at the PCC based on field measurements over a one-week period indicate that statistical distribution of harmonic current distortions at the PCC of most load types are complex and cannot be expressed in terms of common PDF, such as the normal distribution. This is primarily due to very distinct variations in power demand at different periods of the day, which are indicated by the presence of two peaks in histogram plots (see Fig. 4). To simplify the statistical analysis, harmonic current distortions are divided into subtime intervals corresponding to high and low demand periods of the aggregate loads. As can be observed from Fig. 5, statistical distribution of the fifth harmonic current distortion of the shopping complex load corresponding to a period of high power demand (11.00–23.00 h) is approximately a normal distribution. However, for certain types of loads, such as the hotel load, where high- and low-power demand of the aggregate load
AU AND MILANOVIC´ : DEVELOPMENT OF STOCHASTIC AGGREGATE HARMONIC LOAD MODEL
327
Fig. 5. Fifth harmonic current distortion at the PCC of the shopping complex load based on a subtime interval between 11.00–23.00 h.
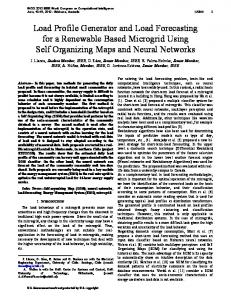
Fig. 7. Comparative CDF of the modeled and measured results of low-voltage residential loads. (a) Third harmonic current distortion. (b) Fifth harmonic current distortion. Fig. 6. Third harmonic current distortion at the PCC of the hotel load based on a one-week period.
is not so distinct, it is observed that its harmonic current distortion at the PCC over a one-week period remains normally distributed as can be seen in Fig. 6. Hence, in general, the modeling of harmonic current distortions at the PCC is divided into two time periods corresponding to high- and low-power demand of the aggregate load. VI. ESTABLISHING AHL PARAMETERS BASED ON HARMONIC FIELD MEASUREMENT RESULTS In modeling the stochastic nature of the harmonic current spectrum at the PCC based on (4), its statistical distribution can be determined given the AHL parameters PDF and their respective characteristic parameters (i.e, mean and standard deviation in the case of normal distribution). However, in most cases, the AHL parameters are not available. In this paper, the AHL parameters are established based on field measurement results of harmonic current spectra at the
PCC of the respective load types. PDF characteristic parameters (e.g, mean and standard deviation in the case of normal distribution, maximum, and minimum in the case of uniform distribution) assumed to represent the respective AHL pain (4) are varied experimentally (numerous rameters trials) until an approximate solution is found, where the cumulative distribution curve/function (CDF) of the two most dominating harmonic currents distortions derived based on the model [i.e, (4)] and harmonic field measurements are in good agreement (see Fig. 7 and Fig. 8). In this investigation, parameters and are assumed to be normally distributed with mean and standard deviation as unknowns to be solved, whereas and are uniformly distributed with a range of values given in Table IV. (Note: The ranges in Table IV are derived from measurements of individual harmonic loads.) Based on the CDF curve fitting technique described before, the mean and standard deviation of AHL parameters and for the respective load types and corresponding time periods are established and shown in Table II. Ideally, numerical values
328
IEEE TRANSACTIONS ON POWER DELIVERY, VOL. 22, NO. 1, JANUARY 2007
Fig. 9. Stochastic current injection model of an AHL
A. Case of PCC at Low-Voltage Bus Typically, dominant characteristic harmonic currents at a lowvoltage bus are the 3rd and 5th. Hence, in order to establish numerical values (mean and standard deviation) of AHL parameand based on field measurement results, a CDF curve ters fitting is based on the 3rd and 5th harmonic current distortions. The results are shown in Fig. 7. B. Case of PCC at Medium-Voltage Bus At the medium-voltage bus, triplen harmonic currents are not present due to delta winding of distribution transformers. Hence, the CDF plot of the two most dominant harmonic currents at medium-voltage buses (i.e, 5th and 7th) are used to establish and . The results are the mean and standard deviation of shown in Fig. 8. VII. APPLICATION OF THE AHL MODEL IN HARMONIC SIMULATIONS Fig. 8. Comparative CDF of modeled and measured results of medium-voltage shopping complex loads. (a) Fifth harmonic current distortion. (b) Seventh harmonic current distortion.
shown in Table II should be verified with loads information obtained from utility/customer load data base. However, such information is generally lacking and, therefore, it is assumed that the numerical values are within an acceptable range based on typical aggregate loads. (Note: It should be mentioned that an ideally coefficient should be established based on the exact knowledge of nonlinear load composition. The approach taken here relies on local harmonic measurements in the absence of this knowledge, which is generally the case in real life, and assuming that the harmonic contribution from the rest of the distribution system compared to the contribution from local nonlinear loads is small, which again is generally the case.) Corresponding phase angles of the harmonic currents distortions are also available from the model. However, due to the limitation of the recording instrument which does not generate measured phase-angle values of harmonic currents distortions, phase-angle variations over a specific period based on the model could not be validated.
The load model at the PCC developed in this paper consists of a single stochastic harmonic current source that represents net harmonic current spectra of the aggregate harmonic loads, with R, L, and C components used to represent linear loads (i.e., induction motors, resistive loads, etc.) as shown in Fig. 9. Typically, the AHL model could be used in two different approaches of harmonic simulations (i.e., commercial harmonic simulation software such as SUPERHARM [12]) which gives snapshot results of harmonic voltage distortions, or a Monte Carlo simulation method which generates results in probabilistic terms. For simplicity and illustration purposes, the AHL model is used in SUPERHARM harmonic simulation software to compute the 5th harmonic voltage distortion at network buses of a 6-bus 11-kV radial distribution feeder as shown in Fig. 10. In the following case, harmonic current spectra produced by the AHL corresponding to the respective load types are derived based on AHL parameters given in Table II. Results of the 5th harmonic current distortions are shown in Table III. Load conditions (in kilovolt-ampere/phase) shown in Fig. 10 are for the period between 11.00–18.00 h which corresponds to the period of high load for a shopping complex, hotel, printing factory and bank, and a period of low load for a residential
AU AND MILANOVIC´ : DEVELOPMENT OF STOCHASTIC AGGREGATE HARMONIC LOAD MODEL
329
Fig. 11. Fifth harmonic voltage distortion at network buses based on simulation.
Fig. 10. Six-bus 11-kV radial distribution network.
TABLE III PROBABILISTIC HARMONIC CURRENT SPECTRA AT PCC
apartment. Five cases representing critical points of the probability distribution curve of the respective AHL harmonic current spectra are selected as inputs for harmonic simulation. , . Case 1) Case 2) , . Case 3) , Case 4) , Case 5) , Results of the fifth harmonic voltage distortion at each network bus for all five cases are shown in Fig. 11. As can be seen in Fig. 11, the main advantage of the stochastic AHL model in harmonic simulation is that it gives a range of possible harmonic voltage distortions at each bus instead of a single possible value. In addition, the simulation results are realistic (between 0.5 and 0.9%) compared to measured values (see Fig. 12) as some of the major phenomena, such as phase-angle diversity, harmonic load compositions in AHL, and power participation of harmonic loads that affect the net harmonic current spectrum of AHL have been accounted for in the model equation. VIII. CONCLUSION This paper presented a methodology for the development of a stochastic aggregate harmonic load model based on harmonic field measurements. The AHL is applicable to loads connected at the low- and medium-voltage level. The stochastic load model is realized through a set of probabilistic load parameters that influence the production of net harmonic current distortion at the
Fig. 12. CDF of fifth harmonic voltage distortions at four 11-kV sites based on field measurements.
TABLE IV PROBABILISTIC HARMONIC CURRENT SPECTRA OF COMPOSITE-TYPE HARMONIC LOADS
PCC. These load parameters are typically available from a customer load data base and can be obtained at the planning (connection of a new supply) or operational stage (facilities management). Realistic results regarding harmonic voltage distortions based on the proposed AHL model and using load parameters derived from harmonic field measurements are obtained. With more accurate data about load parameters made available, it is envisaged that the proposed AHL model could find its application in probabilistic-based harmonic simulation software.
330
IEEE TRANSACTIONS ON POWER DELIVERY, VOL. 22, NO. 1, JANUARY 2007
ACKNOWLEDGMENT The authors would like to thank C. C. Woo and Mr. Megat of TNB Metering Service and Dr. Fadzil of TNB Research for their assistance in performing harmonic field measurements.
[8] Y. J. Wang, L. Pierrat, and L. Wang, “Summation of harmonic currents produced by AC/DC static power converters with randomly fluctuating loads,” IEEE Trans. Power Del., vol. 9, no. 2, pp. 1129–1135, Apr. 1994. [9] A. Cavallini, M. Cacciari, M. Loggini, and G. C. Montanari, “Evaluation of harmonic levels in electrical networks by statistical indexes,” IEEE Trans. Ind. Appl., vol. 30, no. 4, pp. 1116–1126, Jul./Aug. 1994. [10] T. Goeke and W. H. Wellssow, “A statistical approach to the calculation of harmonics in MV systems caused by dispersed LV customers,” IEEE Trans. Power Syst., vol. 11, no. 1, pp. 325–331, Feb. 1996. [11] A. E. Emanuel, J. A. Orr, D. Cyganski, and E. M. Gulachenski, “A survey of harmonic voltages and currents at the customer’s bus,” IEEE Trans. Power Del., vol. 8, no. 1, pp. 411–421, Jan. 1993. [12] Electrotek Concepts, Users Guide SuperHarm. Knoxville, TN, Electrotek Concepts, 2000.
REFERENCES [1] R. Burch, G. Chang, C. Hatzadoniu, M. Grady, Y. Liu, M. Marz, T. Ortmeyer, S. Ranade, P. Ribeiro, and W. Xu, “Impact of aggregate linear load modelling on harmonic analysis: a comparison of common practice and analytical models,” IEEE Trans. Power Del., vol. 18, no. 2, pp. 625–630, Apr. 2003. [2] A. E. Emanuel, J. A. Orr, D. Cyganski, and E. M. Gulachenski, “A survey of harmonic voltages and currents at distribution substations,” IEEE Trans. Power Del., vol. 6, no. 4, pp. 1883–1889, Oct. 1991. [3] C. H. Hu, C. J. Wu, S. S. Yen, Y. W. Chen, B. A. Wu, and J. S. Hwang, “Survey of harmonic voltage and current at distribution substation in Northern Taiwan,” IEEE Trans. Power Del., vol. 12, no. 3, pp. 1275–1284, Jul. 1997. [4] T. C. Shuter, H. T. Vollkommer, and T. L. Kirkpatrick, “Survey of harmonic levels on the American electric power distribution system,” IEEE Trans. Power Del., vol. 4, no. 4, pp. 2204–2213, Oct. 1989. [5] A. Mansoor, W. M. Grady, P. T. Staats, R. S. Thallam, M. T. Doyle, and M. J. Samotyj, “Predicting the net harmonic currents produced by large numbers of distributed single-phase computer loads,” IEEE Trans. Power Del., vol. 10, no. 4, pp. 2001–2005, Oct. 1995. [6] A. Mansoor, W. M. Grady, A. H. Chowdhury, and M. J. Samotyj, “An investigation of harmonics attenuation and diversity among distributed single phase power electronic loads,” IEEE Trans. Power Del., vol. 10, no. 1, pp. 467–473, Jan. 1995. [7] P. T. Staats, W. M. Grady, A. Arapostatbis, and R. S. Thallam, “A statistical method for predicting the net harmonic currents generated by a concentration of electric vehicle battery chargers,” IEEE Trans. Power Del., vol. 12, no. 3, pp. 1258–1266, Jul. 1997.
Mau Teng Au (M’04) received the B.S.E.E. degree in electrical engineering from the University of Toledo, Toldeo, OH, in 1986 and the M.Sc. degree in electrical engineering from Purdue University, West Lafayette, IN, in 1996, and the Ph.D. degree in electrical engineering from the University of Manchester (formerly UMIST), Manchester, U.K., in 2005. Currently, he is Principal Lecturer in the Department of Electrical and Electronic Engineering at the Universiti Tenaga Nasional, Kajang, Malaysia.
Jovica V. Milanovic´ (M’95–SM’98) received the Dipl.Ing. and M.Sc. degrees in electrical engineering from the University of Belgrade, Belgrade, Yugoslavia, and the Ph.D. degree from the University of Newcastle, Newcastle, Australia. Currently he is a Professor of Electrical Power Engineering with the School of Electrical and Electronic Engineering, University of Manchester (formerly UMIST), Manchester, U.K.