Diagnostics of Faults in Induction Motor ASDs Using Time-Stepping Coupled Finite Element State-Space and Time Series Data Mining Techniques Richard J. Povinelli1, John F. Bangura2, Nabeel A.O. Demerdash1, Ronald H. Brown1 1
Department of Electrical and Computer Engineering Marquette University, P.O. Box 1881, Milwaukee, WI 53201-1881, USA E-mail: {Richard.Povinelli, Nabeel.Demerdash, Ronald.Brown}@Marquette.edu
Telephone: 414.288.7088, Fax: 414.288.5579 2
Black & Decker 701 East Joppa Road, TW100, Towson, MD 21286 Telephone: 410.716.3368, Fax: 410.716.3653 E-mail:
[email protected] Abstract - In this paper, the dual track use of the time stepping coupled finite element-state space modeling of induction motors to generate databases for healthy and faulty motor performances, coupled to time series data mining techniques, is presented. This dual track is demonstrated here in its embryonic stage to represent a potentially very powerful motor fault diagnostics and identification tool, when fully developed to completion. Thus, the paper presents results that point to a potentially very useful technical tool for fault diagnostics and preventative maintenance of electric motor-drive systems.
I. Introduction Three-phase induction motors are the machine of choice in the majority of electronically controlled adjustable/variable speed drive (ASD) applications. In the not too distant future, a widening use of induction motors/ASDs for naval vessel propulsion is expected [1]. An important area of study during the past twenty years is the analysis and diagnosis of induction motor faults and associated performance characteristics. A large number of such investigations are summarized in an IEEE-PES working group paper on induction motor fault detection and diagnostics, see [2]. As stated in [2] “performing reliable and accurate fault detection and diagnosis requires understanding the cause and effect of motor faults to motor performances.” Accordingly, we demonstrate in this paper the fundamental foundations of a method for detection of incipient faults and consequent prediction of catastrophic faults in induction machine adjustable speed drives (IMASDs), which does not depend on the familiar frequency domain spectra concepts [2-4]. The myriad of incipient and potentially catastrophic faulty operations includes, but are not restricted to the following: 1. Broken bars and/or end-ring connectors in the squirrel-cages of induction motors [5], 2. Dynamic and static airgap eccentricities arising from assembly defects or subsequent mechanical/bearing problems that may develop in the field during operation [3], and
3.
Phase unbalances in stator armatures developing due to partial internal turn-to-turn short circuits within armature coils, phase unbalances originating within the inverter power electronic portion of a drive, or other phase voltage unbalances due to factors external to IMASD systems. Accordingly, the technique developed here will extensively and economically characterize and predict faults from the IMASD design data. These studies are performed using our proven Time Stepping Coupled Finite Element-State Space (TSCFE-SS) method to generate fault case data [3, 513]. Then, the fault cases are classified by their inherent characteristics. So called “signatures” or “fingerprints” are extracted or mined from the fault case data using our novel Time Series Data Mining (TSDM) technique [14, 15]. The process of generating fault data and mining fault signatures is repeated until a high degree of accuracy is achieved in the prediction and identification of faults. Our approach to the problem of diagnosing faults in IMASDs is new and unique. First, using motor design information and the TSCFE-SS method, we can generate data for a plethora of fault conditions without the need to encounter and acquire data for faults in actual field experience with IMASDs. Second, through data mining, hidden patterns and nuances of differences between healthy performance and various fault signatures are automatically and efficiently identified and made use of in fault identification and prediction.
This paper presents the development of the conceptual framework and proof of principle for a comprehensive set of algorithms for incipient fault prediction before such faults lead to noise and vibration levels that are deemed incompatible with quite performance in naval applications. This is in addition to actual fault identification/diagnosis in adjustable speed motor-drives. This proactive approach can head off the costly and catastrophic cascading of faults that lead to plant shutdowns and consequent long repair/maintenance periods. The resulting fault prediction, identification, and diagnostic information also can facilitate the creation of efficient and effective maintenance schedules. This includes induction motors to be used in ASDs for naval and marine propulsion applications. The study of the effects of such incipient faulty operations occurs through a dual track. The first track generates databases of fault signature profiles through TSCFE-SS simulation of healthy and faulty modes of operation of IMASD [3, 5-13], see Figure 1. The advantage of this method lies in its rigor in predicting effects of motor faults, including the incipient variety, on performance. The second track identifies and extracts hidden patterns and nuances that are characteristic and predictive of faults and incipient faults through TSDM [14, 15] of the fault signatures, see Figure 2.
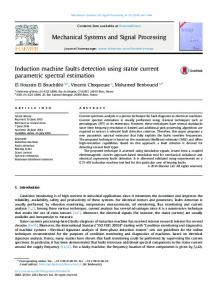
III. Methodology and Techniques The TSCFE-SS method has been detailed and verified in a number of previous papers, see [3, 5-13], and therefore only a functional block diagram flow chart of the method is given here in Figure 1 for the convenience of the reader. The TSCFE-SS aspect fully incorporates the nonlinear effects of magnetic saturation on the time-varying 2-D magnetic field in a motor’s cross-section, and makes full use of the natural machine winding’s frame of reference [3, 513]. Hence, this assures inclusion of all significant space harmonics due to the physical design and nature of the motor, as well as the time harmonics generated from the inverter switching, into the motordrive system modeling and simulations. Accordingly,
Update Current Waveforms and Rotor Position
Initial Estimates of Currents and Rotor Position
Nh
i(θ ) = i o +
å
(
i h cos hθ −ϕ
1
)
Time (Rotor Position) Stepping FE Algorithm
h
h=1
B-axis
θ (t + ∆ t ) = θ 0 + ω r ∆ t
0.22
d-axis 0.21
q-axis
Inductance (H)
II. Potential Benefits from this Work
the simulated fault signatures are derived from timedomain phase current and voltage waveforms, and potentially from simulated instantaneous torque profiles, which rigorously incorporate the motors’ design characteristics and nonlinearities.
A-axis
C-axis
4
NO
0.20 0.19 0.18 0.17
5
0
60
120
180
240
300
360
Rotor Angular Position (derees)
Check for Convergence new
old
I rms I rms old I rms −
λ λ − i Curve
≤ε
Nh
L(θ ) = Lo +
å
(
)
Lhcos hθ − ϕ h
h=1
i
2 State Space (SS) Model 1
YES
Controller Inverter
3
6
I = L−1⋅ Λ i (t )= io +
Nh
4
N
C
B
R1
RN
8 6
ø
4
åihcosæçèhωt −ϕhö÷ø h=1
3
L A
• æ −1 ö Λ = çç− R⋅ L ÷÷Λ + V è
2
Motor
Current(A)
This approach enables one to compute on a time instant-by-instant basis the input and developed powers of a motor as functions of the particular magnetic circuit, winding layouts, and materials. Computations include ohmic and magnetic core losses as well as the effects due to modern fast electronic switching on overall motor-controller/drive interaction and resulting performance [8-13]. Thus, one can use such algorithms in parametric studies.
2 0 -2 -4 -6 -8 0.11
0.12
0.13
0.14
0.15
0.16
time(sec)
7 Characterization of Motor Performance by TSCFE-SS Simulations
Save and Output Results
Figure 1 – Functional Block-Diagram/Flow Chart of the TSCFE-SS Method waveforms TSCFE-SS TSDM request for fault modes
Fault Signatures Figure 2 – Block Diagram of Dual Track Approach Hence, in an actual IMASD, the monitored performance characteristics include signals of current and voltage waveforms of the motor windings and time domain torque profiles. Other characteristics that will be calculated only by simulation, and need not be monitored, are waveforms of flux density, flux and flux linkage variations with time throughout a motor's magnetic circuits, and core and ohmic losses. The TSCFE-SS based simulation model is used here to generate the database of motor current, voltage, and torque waveforms and profiles under healthy
module to generate further waveforms as needed to characterize the motor faults and generate the required characteristic temporal patterns. Practical demonstration of fault prediction in IMASDs will be given here involving broken squirrel-cage bars and broken end-ring connectors.
IV. Application of the TSCFE-SS/TSDM Methodology for Fault Identification and Diagnostics The TSCFE-SS method, which was previously detailed and experimentally verified in [3, 5-13], was utilized in the simulation and modeling of the performance of a 3-phase, 60-hz, 34-bar squirrelcage, 2-pole, 208-volt, 1.2-hp, Y-connected induction motor, the cross-section of which is given in Figure 3. q-axis
B-axis
A
A
A -B
A
-B
-C -C
A-axis
-B
-C
-B
-C
C
B
C C -A
B
-A
B
-A
B
-A
motor conditions, as well as hundreds of faulty operating scenarios in future extensions of this work. In parallel, from such databases it is anticipated that the TSDM technique will extract fault signatures indicative of incipient and actual faults from the waveforms generated by the TSCFE-SS module. The TSDM method overcomes limitations (including stationarity and linearity requirements) of traditional time series analysis techniques by adapting data mining concepts [14, 15] for analyzing such time series (time-domain waveforms are referred to hence forth as time series). Based soundly in dynamical systems theory [16], the TSDM method reveals hidden patterns in time series data by taking advantage of the event nature of many problems. The TSDM method focuses on predicting events, which are important occurrences. This allows the TSDM methods to predict nonstationary, nonperiodic, irregular time series, including chaotic deterministic time series. The TSDM methods are applicable to time series that appear stochastic, but occasionally (though not necessarily periodically) contain distinct, but possibly hidden, patterns that are characteristic of the desired events. They have been successfully applied to characterizing and predicting complex, nonperiodic, irregular, and chaotic time series events in both the engineering and the financial domains [14, 15, 17, 18]. The concept proposed here will in its fully developed form lead to an interactive synergy between the TSCFE-SS and TSDM components of the work where the TSCFE-SS will generate an initial set of fault waveforms for the TSDM module to data mine. The TSDM module will also request further fault waveforms from the TSCFE-SS module as it recognizes a sparcity of data points in key regions of the motor-drive performance space, see Figure 2. The proposed dual track of combined use of the TSCFE-SS model and the TSDM technique offers several attractive and unique features. These attractive features include, first, the ability to rigorously, completely and accurately generate the motor waveforms and profiles through TSCFE-SS simulations, thereby minimizing expensive motor fault data collection in the field, as well as generate signatures for plausible fault scenarios that may not have yet been encountered in actual field operation. Second, the proposed dual track overcomes the time consuming process of manually identifying, characterizing, and separating key patterns that are indicative of incipient motor faults. Third, it synergistically combines the two technologies allowing a “sum is greater than the parts” solution. Through the synergistic interaction, the TSDM module can automatically invoke the TSCFE-SS
C d-axis
C-axis
Figure 3 – Motor Cross Section For this motor, the healthy and faulty cage circuit configurations are shown in Figures 4 through 6. The motor was energized from a balanced sinusoidal 3phase, 208-volt (line-to-line) source. A simulated phase current waveform is shown in Figure 7. The validity of this simulation was verified by actual laboratory tests results, which were reported in detail in references [7, 8, 11-13]. Furthermore, the TSCFESS algorithm was used to simulate two types of faults: (1) three adjacent broken squirrel-cage bars, see Figure 5, the phase current waveform of which is given in Figure 8, and (2) three adjacent broken squirrel-cage end-ring connectors, see Figure 6, the phase current waveform of which is given in Figure 9, see references [5, 10, 12]. 1
2 i1
3 i2
(m-1) (m) (m+1) …
im-1
im
32 …
33 i32
34 i33
1 i34
Figure 4 – Healthy Motor Squirrel-Cage
2 i1
3
(m-1) (m) (m+1)
32
33
i2 …
im-2
… i29
34 i30
1
6
i31
4 Amps
1
Figure 5 – Three Adjacent Broken Bar Cage 1
2
i1
3 (m-1)
i2
(m)
(m+1) (m+2) (m+3)
… im-1
32
im … i29
33
34
i30
1
i31
i32
Figure 6 – Three Adjacent Broken End-Ring Connectors Cage The apparent modulation envelope in the current waveforms of the three broken bar and three broken connector cases in Figures 8 and 9 is attributable to the heavy localized saturation pattern arising in the rotor laminations near the fault due to the absence of bar currents in the rotor. Hence, the normal squirrelcage bar current demagnetization effects, which are inherent in healthy motor operation, are absent. For further explanation of this and associated apparent saliency phenomena, see references [5, 10, 12].
Amps
6 4 2 0 -2 -4 -6 1600 2100 2600 3100 3600 4100 4600 Time Samples Figure 7 – Simulated Phase Current Waveform
Amps
6 4 2 0 -2 -4 -6 1600 2100 2600 3100 3600 4100 4600 Time Samples Figure 8 – Three Adjacent Broken Squirrel-Cage Bars Waveform
2 0 -2 -4 -6 1600 2100 2600 3100 3600 4100 4600 Time Samples
Figure 9 – Three Adjacent Broken Squirrel-Cage End-Ring Connectors Waveform We use a process called time-delay embedding [19] to transform the current time series into a reconstructed state space, also called a phase-space. Takens [16] proved, with certain limitations, that given a time series generated by sampling a state variable of a system, a topologically equivalent state space can be reconstructed by the time-delay embedding process [19]. If the embedding is performed correctly, Takens’ Theorem guarantees that the reconstructed dynamics are topologically identical to the true dynamics of the system. Therefore, the dynamical invariants also are identical [20]. The difficulty in the time-delay embedding process is in estimating Q, the original state space dimension. Fortunately, as shown in [14, 15, 19, 20], useful information can be extracted from the reconstructed state space even if its dimension is less than 2Q+1. Given the current time series I = {i ( k ) , k = 1,K , N } , where k is a time index, and N is the number of observations. A two dimensional phase-space is created by plotting i(k-10) on the x-y plane’s abscissa and i(k) on the ordinate. The resulting phase-spaces are given for the healthy cage case, the three broken bar case, and the three broken connector case in Figures 10, 11, and 12, respectively, for the current time series given in Figures 7, 8, and 9, respectively. On a one to one correspondence basis, the reader can distinctly see a difference in pattern between the healthy cage case of Figure 10 and the two faulty cage cases of Figures 11 and 12. However, a distinction between the patterns of the phase-space for the three broken bars, Figure 11, and the phasespace for the three broken connectors, Figure 12, is not at once obvious.
broken bar cage, and three broken connector cage cases, respectively.
6
2
0.2
0
0.1 ∆Amps
i (k )
4
-2 -4
-0.1
-6
-0.2 -6
-4
-2
0 2 i (k -10)
4
6
1600 2100 2600 3100 3600 4100 4600 Time Samples
Figure 10 – Healthy Motor Phase-Space
Figure 13 – Healthy Motor Current First Difference Waveform
6 4
0.2
2
0.1 ∆Amps
i (k )
0.0
0 -2
0.0
-0.1
-4
-0.2
-6 6
1600 2100 2600 3100 3600 4100 4600 Time Samples
Figure 11 – Broken Bars Phase-Space
Figure 14 – Broken Bars Current First Difference Waveform
-6
-4
-2
0 2 i (k -10)
4
0.2
4
0.1 ∆Amps
6
i (k )
2 0
0.0
-0.1
-2
-0.2
-4
1600 2100 2600 3100 3600 4100 4600 Time Samples
-6 -6
-4
-2
0 2 i (k -10)
4
6
Figure 12 – Broken Connectors Phase-Space
Meanwhile, a first current difference, ∆i(k) = {i(k) – i(k-1)}, set of time series were generated for the three current time series of Figures 7, 8, and 9. Figures 13, 14, and 15 illustrate the current first difference time series for the healthy cage, the three
Figure 15 – Broken Connectors Current First Difference Waveform The phase mapping technique, which was explained above and applied to the current waveforms, i(k), is also applied here. This resulted in the phase-spaces of Figures 16, 17, and 18 for the healthy cage, the three broken bar cage, and the three broken connector cage cases, respectively. A
comparison between the three phase-spaces reveals some interesting characteristics. 0.2
∆i (k )
0.1 0.0
-0.1 -0.2 -0.2
-0.1
0.0 0.1 ∆i (k -10)
0.2
Figure 16 – Healthy Motor Current First Difference Phase-space
0.2
∆i (k )
0.1 0.0
-0.1 -0.2 -0.2
-0.1
0.0 0.1 ∆i (k -10)
0.2
Figure 17 – Broken Bars Current First Difference Phase-space
0.2
∆i (k )
0.1 0.0
-0.1 -0.2 -0.2
-0.1
0.0 0.1 ∆i (k -10)
0.2
Figure 18 – Broken Connectors Current First Difference Phase-space
Here the resulting phase-spaces of Figures 16, 17, and 18 at once show distinct pattern differences between the cases for the healthy cage, the three broken bar cage, and the three broken connector cage, respectively. The most important element in all these phase-space is that no time profile information is lost in this process, which is quite contrary to frequency domain based methods such as Fourier transform/frequency spectra [3, 4]. Also, Time Series Data Mining (TSDM) techniques [14, 15, 17, 18] can be very powerful in distinguishing between these mappings shown above as will be explained in the next section. The TSCFE-SS model simulation resulted in timedomain torque profiles [5, 12], not shown here for space considerations, for the three broken bar, and the three broken end-ring connectors cases, respectively. Torque first difference profiles were generated. Time-delay embedding, which was explained and applied above to the current first difference waveforms, was also applied here to the torque first difference time series. The resulting phase-spaces are shown here for the healthy rotor cage, the three broken bar, and three broken connector cases in Figures 19, 20, and 21, respectively. The distinction in shape between the three torque phase-spaces is strikingly obvious at first glance. This suggests that monitoring of torque for fault diagnosis and detection may constitute a powerful tool indeed, at least in critical motor drive systems.
V. Method for Distinguishing Faults The proposed method for distinguishing fault types is outlined as follows: 1. Take pairs of phase-spaces generated from the same underlying time series, but representing different fault types, for example the healthy motor torque first difference phase-space and the broken bars torque first difference phase-space. 2. Search each phase-space for hyperspherical regions that allow the two fault types to be distinguished. These regions will take one of two forms. The first will be regions that contain phase-space points from one fault type, but not the other. The second will be regions that contain a much higher percentage of phase-space points from one fault type than the other. Examples of such regions are shown in Figures 19, 20, and 21. In Figure 19, the solid circles indicate a healthy condition. In Figure 20, the solid circles indicate a 3 broken bars fault. In Figure 21, when 80% of the phase-space points reside within the solid circle, a three broken end-ring connectors fault type is indicated. The torque time series were divided into a training time series and a testing time series. These
hyperspheres were learned in the training time series, but verified in the separate test time series.
0.2
∆t (k )
0.1 0.0
-0.1 -0.2 -0.2
-0.1
0.0 0.1 ∆t (k -10)
0.2
Figure 19 – Healthy Motor Torque First Difference Phase-Space
0.2
∆t (k )
0.1 0.0
-0.1 -0.2 -0.2
-0.1
0.0 0.1 ∆t (k -10)
0.2
0.2
∆t (k )
0.1 0.0
-0.1 -0.2 -0.1
0.0 0.1 ∆t (k -10)
The phase mapping techniques applied above to the TSCFE-SS simulated induction motor timedomain current wave forms, and torque time-domain profiles, suggest that such simulations can be used to generate extensive databases of fault signatures which can be data mined by TSDM techniques for fault diagnostics of various classes of induction motors and other motors used as prime-movers in ASD systems. Such systems are used or will be used in future naval applications, including electrically driven ship/vessel propulsion systems. The development of such a dual track TSCFESS/TSDM technical tool, if carried to its full potential, can be very useful in the detection of incipient motor-drive system faults before these evolve into full-fledged faults, causing undesirable acoustic noise and other performance problems. This tool can be instrumental in the development of reasoned and well-planned proactive/preventative maintenance schedules for all sorts of motor-drive systems used in critical naval applications. This dual track TSCFE-SS/TSDM technology if carried to its full potential will also be of great benefit to the motor drives industry and all its civilian sector users/customers. Thus, it is a dual-purpose technology. This TSCFE-SS/TSDM technical tool is specially needed and suited to high power density electric machines, which are inherently designed with high levels of magnetic saturation throughout their magnetic circuit cores, and hence are less faulttolerant in so far as severity of faults with regard to performance degradation.
VII. Conclusion
Figure 20 – Broken Bars Torque First Difference Phase-Space
-0.2
VI. Discussion of Results
0.2
Figure 21 – Broken Connectors Torque First Difference Phase-Space
The results shown in this paper indicate that the ultimate full development of this model, with a dual track of simulated fault signatures coupled to data mining techniques, will facilitate and speed the accumulation of large numbers of fault signatures by means of reliable and accurate numerical simulations. This model will accomplish this without the need for difficult and perhaps unachievable collection and acquisition of such data from actual field failures, which would be limited in number as well as costly and difficult to obtain. The generated databases for myriads of fault scenarios can constitute a very powerful diagnostics tool for proactive maintenance and minimization of plant down times for any practical application involving electrical adjustable speed motor-drive systems.
VIII. References [1] P. Sharke, “The Hunt for Compact Power,” Mechanical Engineering, vol. 122, pp. 42-45, 2000. [2] M. E. H. Benbouzid, “Bibliography on Induction Motors Faults Detection and Diagnosis,” IEEE Transactions on Energy Conversion, vol. 14, pp. 1065-1074, 1999. [3] J. F. Bangura and N. A. Demerdash, “Comparison Between Characterization and Diagnosis of Broken Bars/End-Ring Connectors and Airgap Eccentricities of Induction motors in ASDs Using a Coupled Finite Element-State Space Method,” IEEE Transactions on Energy Conversion, vol. 15, pp. 48-56, 2000. [4] R. R. Schoen and T. G. Habetler, “Effects of time-varying loads on rotor fault detection in induction machines,” IEEE Transactions on Industry Applications, vol. 31, pp. 900-906, 1995. [5] J. F. Bangura and N. A. Demerdash, “Diagnosis and Characterization of Effects of Broken Rotor Bars and Connectors in Squirrel-Cage Induction Motors by a Time-Stepping Coupled Finite Element-State Space Modeling Approach,” IEEE Transactions on Energy Conversion, vol. 14, pp. 1167-1175, 1999. [6] N. A. Demerdash and T. W. Nehl, “Electric Machinery Parameters and Torques by Current and Energy Perturbations from Field Computations - Part I & II,” IEEE Transactions on Energy Conversion, vol. 14, pp. 1507-1522, 1999. [7] N. A. Demerdash, J. F. Bangura, F. N. Isaac, and A. A. Arkadan, “A Time-Stepping Coupled Finite-State-Space Model for Induction Motor Drives-Part 1: Model Formulation and Machine Parameter Computation & Part II: Machine Performance Computation and Verification,” IEEE Transactions on Energy Conversion, vol. 14, pp. 1465-1478, 1997. [8] N. A. O. Demerdash and J. F. Bangura, “Characterization of Induction Motors in Adjustable-Speed Drives Using a TimeStepping Coupled Finite-Element State-Space Method Including Experimental Validation,” IEEE Transactions on Industry Applications, vol. 35, pp. 790-802, 1999. [9] J. F. Bangura and N. A. Demerdash, “Performance and Torque-Ripple Characterization in Induction Motor Adjustable Speed Drives Using Time-Stepping Coupled Finite Element State Space Techniques,” IEEE Transactions on Industry Applications, vol. 35, pp. 982-990, 1999.
[10] J. F. Bangura and N. A. O. Demerdash, “Effects of Broken Bars/End-Ring Connectors and Airgap Eccentricities on Ohmic and Core Losses of Induction Motors in ASDs Using a Coupled Finite Element-State Space Method,” IEEE Transactions on Energy Conversion, vol. 15, pp. 40-47, 2000. [11] N. A. Demerdash and J. F. Bangura, “A TimeStepping Coupled Finite Element-State Space Modeling for Analysis and Performance Quality Assessment of Induction Motors in Adjustable Speed Drives Applications,” proceedings of Naval Symposium on Electric Machines, Newport, Rhode Island, 1997, pp. 235-242. [12] J. F. Bangura, A Time-Stepping Coupled Finite Element-State Space Modeling for On-Line Diagnosis of Squirrel-Cage Induction Motor Faults, Ph.D. Dissertation, Marquette University, June 1999. [13] J. F. Bangura and N. A. Demerdash, “Simulation of Inverter-Fed Induction Motor Drives with Pulse-Width Modulation by a Time-Stepping Coupled Finite Element-Flux Linkage-Based State Space Model,” IEEE Transactions on Energy Conversion, vol. 14, pp. 518-525, 1999. [14] R. J. Povinelli and X. Feng, “Temporal Pattern Identification of Time Series Data using Pattern Wavelets and Genetic Algorithms,” proceedings of Artificial Neural Networks in Engineering, St. Louis, Missouri, 1998, pp. 691-696. [15] R. J. Povinelli and X. Feng, “Data Mining of Multiple Nonstationary Time Series,” proceedings of Artificial Neural Networks in Engineering, St. Louis, Missouri, 1999, pp. 511516. [16] F. Takens, “Detecting strange attractors in turbulence,” proceedings of Dynamical Systems and Turbulence, Warwick, 1980, pp. 366-381. [17] R. J. Povinelli, Time Series Data Mining: Identifying Temporal Patterns for Characterization and Prediction of Time Series Events, Ph.D. Dissertation, Marquette University, 1999. [18] R. J. Povinelli, “Identifying Temporal Patterns for Characterization and Prediction of Financial Time Series Events,” proceedings of International Workshop on Temporal, Spatial and Spatio-Temporal Data Mining: TSDM2000, Lyon, France, 2000, pp. 46-61. [19] H. D. I. Abarbanel, Analysis of observed chaotic data. New York: Springer, 1996. [20] E. Bradley, “Analysis of Time Series,” in An introduction to intelligent data analysis, M. Berthold and D. Hand, Eds. New York: Springer, 1999, pp. 167-194.