hosts to steal confidential data and commit fraudulent trans- actions, and volume attacks ... sion/Anomaly Monitoring for Nonparametric Detection): a nonparametric ..... lous or normal using an advanced graph-based method that combines ...
DIAMoND: Distributed Intrusion/Anomaly Monitoring for Nonparametric Detection Maciej Korczy´nski∗ , Ali Hamieh∗ , Jun Ho Huh§ , Henrik Holm† , S. Raj Rajagopalan§ , and Nina H. Fefferman∗ ∗
†
Rutgers University, USA Forest Glen Research, LLC, USA § Honeywell ACS Labs, USA
Abstract—In this paper, we describe a fully nonparametric, scalable, distributed detection algorithm for intrusion/anomaly detection in networks. We discuss how this approach addresses a growing trend in distributed attacks while also providing solutions to problems commonly associated with distributed detection systems. We explore the impacts to detection performance from network topology, from the defined range of distributed communication for each node, and from involving only a small percent of total nodes in the network in the distributed detection communication. We evaluate our algorithm using a software-based testing implementation, and demonstrate up to 20% improvement in detection capability over parallel, isolated anomaly detectors for both stealthy port scans and DDoS attacks.
I. I NTRODUCTION Cyber-attacks are among the top threats facing today’s world. Common examples include compromising individual hosts to steal confidential data and commit fraudulent transactions, and volume attacks such as scanning large network spaces, spreading worms, or launching distributed denial of service attacks (DDoS) to bring down legitimate services. To evade detection of traditional intrusion detection systems (IDSs), cyber attacks are migrating from centralized into more sophisticated peer-to-peer (P2P) architectures with malicious activities stealthily spread over large number of nodes [1]. For example, in December 2013 Microsoft attempted to shutdown the ZeroAccess botnet which had taken control over two million machines worldwide, resulting in financial losses of over $2.7 million each month to search engine advertisers on Google, Bing, and Yahoo [2]. Identifying and shutting down 18 C&C servers disrupted the botnet, but it did not take it down completely mostly because the decentralized, distributed nature of the P2P botnet infrastructure made it very hard for a centralized defense mechanism to effectively thwart it. A new frontier in cyber defense that has emerged in recent times is based on the idea of sharing cyber attack information across organizational boundaries so that multiple organizations may collaborate in the rapid detection and thwarting of cyber attacks, especially attacks for which prior knowledge is scant or non-existent [3]–[17]. Indeed, an entire new infrastructure is being created with new sharing protocols such as STIX [3] and TAXII [4], cyber threat "exchanges" [5], and government backing. Automated cyber data sharing is already being touted as the new defensive strategy against smart and highly distributed adversaries [18]. However as Serrano et al. pointed
out there are at least four fundamental technical challenges that need to be met before this paradigm can become reality [19]. Our work addresses two of the four identified challenges. First, they point out that there are policy issues that prevent sensitive data from being shared between organizations. These policies pertain to privacy issues and/or other sensitivities of information sharing beyond given jurisdictions relating to legal and competitive issues (see e.g. [20]. The second issue relates to the semantics of the data being exchanged, since the STIX and TAXII protocols are designed to mainly address the syntax of data sharing. IT environments show a tremendous diversity and cyber attacks are evolving rapidly; as a result the data captured in one particular environment may be unique and incomparable to similar data from another, vitiating any gains from the data sharing. Any form of detection that relies on comparison of semantically rich data is thus in jeopardy if the data comes from sensors in different domains. Our approach addresses both these challenges by providing a mechanism that allows for cooperation between sensors in an arbitrary virtual topology and does not rely on sharing the particulars of the underlying event, but only the pattern of “excitation” seen in the sensors. By its nature this data does not contain any personal information, or even any information about the specific attack. We expect that sharing of such data would be far easier to overcome organizational hurdles. For the same reason, our scheme is easier to argue for in the second challenge, namely, because the data shared is very simple (even the individual threshold values are not shared) there is no question of creating semantic equivalence. Finally, the scheme enables sensors to self-tune their threshold values using the feedback mechanism. When new attack patterns appear, the sensors learn by cooperation to sense them – it takes some time but there is no prior modeling that has to be applied to the sensors, which makes our scheme especially appealing in detecting novel attacks. In this paper, we propose DIAMoND (Distributed Intrusion/Anomaly Monitoring for Nonparametric Detection): a nonparametric fully-distributed coordination framework that decouples local intrusion detection functions from network wide coordination. DIAMoND first builds coordination overlay networks on top of physical networks. DIAMoND then dynamically combines direct observations of traditional localized/centralized NIDS with knowledge exchanged with other coordinating nodes called neighbors to dynamically detect
anomalies of underlying physical systems. Specifically, coordinating nodes in DIAMoND exchange generic nonparametric levels of concern between neighbors that reflect the observed probability of network attacks without elaborating any further details on the attacks themselves. As a result, the coordination layer of the DIAMoND framework can be readily coupled with any local detection schemes without the need for increasing the detection feature sets. The coordination network layer is also decoupled from the underlying physical network layer to facilitate flexible coordination strategies based on, for example, previously observed correlated behaviors, instead of being artificially limited to direct connectivity or geographical proximity. Interactions inside DIAMoND are limited to local neighborhood (e.g. 1 or 2 hop neighbors) in the overlay network thus ensuring system scalability linear to the coordination network density instead of network size. The overall architecture of DIAMoND thus allows preservation of private information of individual participating parties, which eases deployment of DIAMoND across political and administrative boundaries. DIAMoND is evaluated by emulation using an OS-level virtualization testbed. Additionally, our prototype shows how a distributed anomaly detector can be implemented in the POX SDN (Software Defined Network) controller. DIAMoND is released to the community for further works [21]. II. S YSTEM D ESIGN A. Architecture Overview DIAMoND is deployed over multiple nodes (switches, middleboxes) in a fully distributed architecture. We define a node’s neighborhood as a subset of all nodes with which it directly exchanges nonparametric alert-related information. Neighborhoods are dynamic and can change over time based on, e.g previously observed correlated behaviors or topology changes. Two collaborating nodes enjoy a symbiotic, mutual relationship, which means that both of them need to authenticate each other and agree on joining each other’s neighborhoods. Furthermore, each node is equipped with two functional units: detection unit (DU) and coordination unit (CU). The former is responsible for the data-driven assessment of socalled threat level—the level of likelihood that an intrusion is occurring based on the direct observation reported by local NIDS and/or Firewall implementation. The latter calculates the concern level which is a function of the threat level and the concern levels of its neighbors. B. Detection Unit NIDS, firewalls, and any other security intelligence can be implemented in DU so long as there is an appropriate plug-in to CU to translate the output of DU to the nonparametric threat level. Additionally, there must be an incorporated appropriate response by the DU to different levels of concerns of its neighbors (e.g. tuning of sensitivity thresholds). To foster interoperability, we do not require the extraction and provision of any potentially sensitive and/or incomparable attack details. In fact, a node may choose from among a set of different local
anomaly detection methods, thereby making it difficult for an attacker to manipulate the local anomaly detection’s influence on the CU network by making it harder to predict what types of traffic may trigger a local intrusion warning. These features greatly increase the potential of such a system to be able to detect diverse characteristics of large-scale zero-day attacks, depending on a variety of local detection algorithms adapted to DIAMoND. C. Coordination Unit Let us now formalize the DIAMoND system. We define B={bi , i=1 . . . n} as the entire set of all participating nodes. Each node, bi , has access to some subset of information about the traffic it handles, which is defined as the observation set, o(bi ). In particular, a node may have access to all the packet headers in its traffic but it may also have access to some part of the payloads. For each node, there is also a time window, Wit−w,t (o(bi )), of length w over which the observation set may be analyzed. In our experiments, w is set to 5s for all nodes. Each of the participating nodes � has an internal set � of “native” detection algorithms, ai Wit−w,t (o (bi )) , sti,t , that are a function of the information in the observation set of that node and of the set of detection sensitivity thresholds for that node at time t, sti,t , each associated with a detection algorithm available to that node (i.e. each element of sti is associated with an element of ai ). These sensitivity thresholds are dynamically updated over time, and there is no a priori assumption of uniformity in sensitivity thresholds across nodes. In fact, since each node may employ its own local anomaly detector, these thresholds are completely independent from each other. At each time t, each node computes a function of the observed threat level, Ti,t (ai ), which is the data-driven assessed level of likelihood that an anomaly is occurring. (For brevity, the (ai ) will henceforth be omitted.) As discussed earlier, each node, bi , has an associated set of nodes, called the neighborhood, n(bi ) ⊇ B, such that there is a path of links in the network from each node in n(bi ) to bi , that influence its sensitivity threshold. Note this is not the same as the set of nodes with which bi shares a direct link, but rather the set of nodes that influence the threshold of bi . Each node bi has a level of concern at time t, ci,t (Ti,t−1 , Lt−1 (n(bi ))), which is a function of both the previously assessed threat level and of a function Lt (n (bi )) that computes the total impact of the concerns of all nodes within the neighborhood of bi at time t. Our naïve excitation algorithm is defined ci,1 = 0 and L1 (n (bi )) = 0 . Let � � as follows. Initially, c¯ = bj ∈n(bi ) cj,t−1 |n (bi )| be the mean of the concerns of neighbors, thus: ⎧ if c¯ < V0 ⎨ 0, 1, if V0 ≤ c¯ < V1 Lt (n(bi )) = (1) ⎩ 2, otherwise where the current V0 and V1 values were informed by the expected traffic flow for each node given the initial network
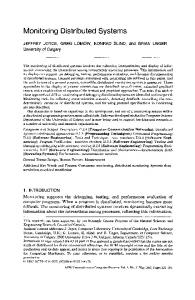
Figure 1.
Keep-alive, Update, and Summary message flows based on different communication strategies.
topology and witin that expectation, set arbitrarily to 0.34 and 1.34, respectively. Each node is equipped with a sampling detection algorithm for defeating TCP intrusions such as SYN flooding attacks and port scan activity [22], [23] that we extended to meet the needs of our system. Again, the DU might implement any kind of local intrusion detection intelligence, ideally including a plug-in to dynamically adjust its operational features such as detection thresholds according to Lt−1 (n (bi )). We define Rsrc and Rdst ∈ {1, 2, 3, . . .} as a number of outgoing SYN segments to corresponding incoming ACK segments per source and per destination, respectively, as traffic features corresponding to ai . At time t0 , we calculate the cdf function of Rsrc based on daily collected packet traces of a trans-Pacific line [24]. We define sti,0 = P (Rsrc ≤ 1.05) and sti,min = P (Rsrc ≤ 0.99) as a minimal value of sti,t . Let λ = Lt−1 (n(bi ))/max[Ti,t−1 (ai )] be called the update rate, thus the adaptive sensitivity threshold, sti,t could be defined as: sti,min , if sti,0 ∗ (1 − λ) ≤ sti,min (2) sti,t = sti,0 ∗ (1 − λ), otherwise We assign Ti,t (ai ) ∈ {0, 1, 2} for each node in each time based on the observed traffic on that node using algorithm ai with thresholds sti,t , informed by the distribution of results from the local intrusion detection algorithm (initially parameterized using ‘normal network traffic’). Values are defined such that 0 indicates a completely normal classification, 1 indicates that traffic patterns have exceeded some fixed numbers of standard deviations from normal (where this number is itself a component of sti,t ) but has not yet exceeded threshold to be considered an attack, and 2 indicates classification by the local anomaly detector of a current attack. Finally, we define a progression of four different test functions ci,t for all nodes to explore the impact of the level of importance being assigned to the concern of neighbors: low : ci,t = Ti,t−1 unless Lt−1 = 2, in which case ci,t = 1, med: ci,t = Ti,t−1 , unless Lt−1 = 2, in which case ci,t =�1 if Ti,t−1 = � 0, and ci,t = 2 otherwise, med+: ci,t = max Lt−1 , Ti,t−1 unless Ti,t−1 = �0 and Lt−1 =� 2, in which case ci,t = 1, and high: ci,t = max Lt−1 , Ti,t−1 . To the best of our knowledge, we are the first to propose to exchange a nonparametric summarized view of the network
state coming from the consensus of both the internal and external observation. D. Communication Protocol Each of the nodes participate in both periodic and spontaneous message exchange. In trying to keep the communication protocol complexity as low as possible, we define three basic messages: KEEP-ALIVE, UPDATE, and SUMMARY [21]. Keep-alive messages are sent every 10 to 30 seconds depending on settings. They include: the message type, the TTL value, and the level of concern. Messages are exchanged only between neighbors (cf. Figure 1a-c). The reason we consider this type of messages is to make sure that we can always tell the difference between completely normal network state and the state where legitimate traffic is not delivered due to some packet losses (possibly caused by intrusive network activity). TTL reflects the number of logical hops between two communicating nodes. Ideally, TTL should reach 0 at the destination node. Update messages have the same structure as keep-alive messages but are generated spontaneously when the level of concern increases or decreases due to either a change in a threat level or a change in a consensus of level of concern of the neighborhood. As previously, update messages are sent only to neighbors (cf. Figure 1a-c). To reduce the potential of exploitation of the system, we limit the number of spontaneous messages possible to send between two successive keep-alive messages. Summary messages are multicast to many participating nodes to report previously seen attacks and a node position so that the dynamic neighborhood can be potentially redefined according to a strategy, network topology changes, or recently observed attacks. The interval of summary messages could be set to every hour, day, or even week. We limit the lifetime (hop count) of this type of messages by TTL set to 255 (cf. Figure 1d). The number of malicious source and destination IP addresses sent in a one message is limited to 20. E. Neighborhood Strategies We investigate different strategies for creating neighborhoods to maximize the flow of meaningful information while minimizing the number of connections.
The first strategy is based on a hop limit that reflects the geographical or administrative distance between neighbors. In the simplest and yet very effective form, we define a neighborhood of a node by direct physical or logical connection. We also attempt to empirically verify the application of the extended neighborhoods by increasing the TTL value. In other words, nodes exchange their levels of concerns with their direct neighbors (TTL=1) and neighbors of their neighbors (TTL=2), and so on. Another strategy consist in correlating previously observed attacks and constructing neighborhoods based on the assumption that malicious activity may reoccur and be launched from the same set of compromised machines and/or against the same victims (networks, servers). Such a strategy has the following advantages potentially: (i) improve the detection accuracy because the neighborhoods are established between nodes potentially involved in malicious activity, (ii) track botnets because infected machines are often reused by botmasters, (iii) stop attacks (DDoS attacks and worm spreads in particular) close to the source of the attack in an automated way and in real time. This strategy, however, may decrease initial sensitivity to novel attack patterns and analysis into these tradeoffs will be required. F. Rogue Nodes One potential concern for the practicality of any distributed system is that the network may contain rogue nodes that propagate false levels of concern for their own benefit. Though not discussed in detail here, a future enhancement to DIAMoND to address this potential risk is the addition of a ‘weight’ feature that reflects the level of trust for each neighbor. Each node will define the weight values for each of their neighbors over time, depending on the received levels of concerns during past interactions with the neighbors. Critically, the slope of weight growth should be reasonably small relative to the loss as a deceptive neighbor may try to gain ‘weight’ and then start to misbehave. The weight update function should vary the slope of growth/loss of level of concern as a function of the neighbor’s current weight value. Details of the implementation and efficacy of this method are planned in immediate future work. III. E VALUATION S ETUP A. Software Implementation We have developed our prototype communication protocol as an OpenFlow controller in the POX environment [25] and evaluated it using Mininet 2.0 network emulator [26]. Our initial software system deployment consist of 20 nodes due to computational constraints and up to 20 end-user machines connected to each of nodes. We use three additional OpenFlow POX components: forwarding.L2_learning so that nodes can act as a type of L2 learning switch, openflow.spanning_tree and openflow.discovery to build a view of the network in topologies with loops. DIAMoND is added as a security component to the POX controller. Our communication protocol is available to the public [21].
B. Physical Topologies The performance of the algorithm is estimated for different network topologies: • Full Mesh a complete undirected network of 190 links. • Mesh a randomly selected subgraph of Full Mesh topology in which the probability of link creation is 0.3, therefore contains 57 links. • Bipartite a bipartite graph of 57 links where nodes are divided into two disjoint sets of same size. • Linear a single path of 57 links in which two nodes have exactly one incident link and all others have exactly two incident links. • Extended Star a tree of 19 links is generated by initiating the graph with a ‘root’ node and then attaching each subsequently created node to one of the already existing nodes in a uniform fashion. C. Legitimate and Malicious Traffic In our experimental evaluation, we use traffic captured from the trans-Pacific line (samplepoint-F, 150 Mbps) maintained by the MAWI working group [24]. We first use traffic labeled by the MAWI group as anomalous or normal using an advanced graph-based method that combines responses from independent anomaly detectors built upon principal component analysis (PCA), the gamma distribution, the Kullback-Leibler divergence and the Hough transform [24]. Then, we develop our method based on Xmeans algorithm. We implement an algorithm for detecting SYN flooding attacks and portscans [22], [23] using the python API provided by MAWILab-v1. We then calculate the number of outgoing SYN segments to incoming ACKs per source and per destination in 5 seconds intervals. We cluster the obtained traffic using the Weka’s implementation of the X-means algorithm based on the Bayesian information criterion (BIC) to approximate the correct number of clusters [27]. We classify all the traffic clustered in the most numerous group with the lowest cluster centre as legitimate traffic and classify the remaining ones as anomalous. Finally, we filter all traffic labeled as anomalous by each classification method and use available in our benchmark traffic generator. We evaluate the capability of our system using two predominant attacks exploiting TCP protocol, namely SYN stealth scans and SYN flooding attacks. Our immediate next steps include applying DIAMoND to real world DNS traffic for botnet detection. IV. E MULATION R ESULTS A. Detection Accuracy In addition to a detailed analysis of sensitivity and specificity defined as: TN TP , Specificity = , (3) TP + FN TN + FP which is provided in a form of ROC diagrams, and where TP stands for true positive, TN for true negative, FP for false Sensitivity =
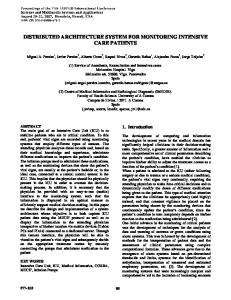
Figure 2. Sensitivity as a function of 1 − specificity. Comparison of DIAMoND and BLID for stealth scans in the TTL=1 neighborhood for different test functions (low, med, med+, and high), and for different topologies: star (left), tree (middle left), mesh (middle right) and full mesh (right).
positive, and FN for false negative, we calculate the overall system accuracy denoted as: Accuracy =
TP + TN TP + FP + TN + FN
(4)
We then quantify the additional information that is gained by deploying our system on the top of benchmark local intrusion detectors (BLID) (i.e. we ask by how much, if at all, the inclusion of the DIAMoND collaboration among nodes improves their accuracy relative to their use of only the local detection algorithms in isolation). Finally, to evaluate the information gain we use an information theoretic approach and a Kullback-Leibler (K-L) divergence:
P (x) (5) D(P ||Q) = K-L(P, Q) = P (x)log2 Q(x) x∈X
This provides a way to compare the difference between two probability distributions P (x) and Q(x), where x is the number of accurately classified flows (represented as 5-tuples according to the source and destination IPs and ports, and transport layer protocol) as malicious and legitimate during a single test (which in our case is the entire set), P (x) represents the overall accuracy of our system and Q(x) is the overall accuracy of BLIDs operating independently. It is important to recall that the potential for improvement in accuracy is scaled by the percent of malicious packets. Since the case of stealth scans malicious packets constitute a smaller percentage of all network traffic, the increase in accuracy is strictly bounded, meaning that for example 0.045 represents a substantial improvement relative to the range possible for improvement. Figure 2 (left) depicts a sensitivity as a function of 1 − specificity for stealth scans in an extended star physical topology and an overlay network where neighborhoods are created on the basis of direct physical connections (TTL=1). We present results for four test functions corresponding to different excitation levels. They reflect the impact of four levels of importance being assigned to the concern levels of neighbors. In other words, they describe the level of trust that a node places in its neighborhood. The graph indicates a great improvement in sensitivity between approximately 10% and 20% for low, med, and med+, high algorithms, respectively, without compromising specificity in comparison
to BLID systems operating independently. The reason why 1 − specificity do not exceed 3.5% (in worst case) comes from two reasons: (i) precise calibration of the rate limiting sensitivity thresholds. For example, the consensus of level of concerns of neighbors can not reduce the sensitivity threshold of a chosen node below sti,min , and (ii) level of concern of a node signals the anomaly, while the decision about the assigning particular flows to legitimate or malicious classes remain with DU. Finally, though not presented in this paper due to space limitation, the overall information gain of DIAMoND calculated over the accuracy of BLID is approximately twice as large for med+ and high test functions as for low and med (between 0.022 and 0.047, cf. Table I). B. Impact of Physical Topologies We find that if there are no transit nodes and we assume a full mesh topology (cf. Section III-B) then the detection accuracy is decreased significantly in comparison to other topologies (cf. Figure 2 and Table I), especially in case of the low and med excitation functions. This is because stealth scans are not as aggressive as DDoS attacks or worm propagation, so the great majority of nodes within a TTL=1 neighborhood forming a full mesh topology will not report any suspicious behavior. Our results also indicate that for aggressive DDoS attacks the type of topology does not influence the accuracy (see Table I). We observed that the information gain of the overlay detection system is lower (though always positive) in comparison with low-rate malicious activity, but the system can react close to the source of the attack more effectively and thereby reduce the collateral damage to minimum. C. Influence of Neighborhood Strategies In this section, we first report on the basic strategy where each node communicates its level of concern with its direct physical or logical neighbors (TTL=1) and compare it with results for extended neighborhoods (TTL=2 and TTL=3) for stealth scans and a star topology (cf. Figure 2 left and Figure 3, respectively, and Table I). The comparison of three strategies provides quite interesting, though expected results. We observed no major distinction in the detection accuracy and the information gain. This is because nodes announce their levels of concerns instead of threat levels which, in this
Figure 3. Sensitivity as a function of 1 − specificity. Comparison of DIAMoND and BLID for stealth scans in the TTL=2 and TTL=3 neighborhoods, for four test functions (low, med, med+, and high) in the star topology.
Figure 5. Sensitivity as a function of 1 − specificity. Comparison of DIAMoND and BLID for stealth scans in the attack neighborhoods for four test functions (low, med, med+, and high) in the star and full mesh topology.
particular scenario, results in a very similar information flow regardless of the neighborhood hop limit. Furthermore, an evaluation of sensitivity, specificity and information gain for dynamic, self-organizing neighborhoods based on repeated, previously detected intrusions (compare Figure 5 with Figure 2 left and right and Table I) shows a significant improvement in the case of a full mesh topology. Overall, the primary results highlight the importance of different communication strategies and interesting characteristics of the information flow that is distinctive to DIAMoND
Figure 4 provides an example analysis of the deployment gain for a 20-node star network under port scan probing. This figure clearly showed a point of diminishing return such that, after 30% of the nodes participate in the DIAMoND system, the information gain is close to that achieved when all nodes are participating and the marginal deployment gain from increasing participation is insignificant. On the other side, even when there are only 10% nodes (2 nodes) participating, the information gain is already over 0.01. When 20% nodes are participating, the information gain reached a significant 0.03. We thus concluded that, in this case: (i) minimal effective deployment is 10% of the network nodes participating, (ii) marginal gain is maximized at 20% deployment, and (iii) DIAMoND plateaus after 30% deployment, with minimal value gained by having additional nodes participating. V. R ELATED W ORK
Figure 4. Information gain of DIAMoND over BLID as a function of the percentage of system deployment for scan activity in the TTL=1 neighborhood and the star topology.
D. Minimal and Marginal Deployment Gain Deployment of networked services across administrative boundaries usually has to take place progressively. In this section, we studied how deployment percentages affect performance of a DIAMoND system. In particular, we tried to understand the minimal deployment percentage needed for DIAMoND to have significant performance impact and marginal performance gain with additional deployment. To quantitatively evaluate deployment gain, we adapted a calculation of “offline marginal utility” originally proposed to analyze the impact of additional metrics [28], to instead compute the incremental information gain, U , for each additional node (relative to the information achieved with the BLID system) as:
P (xn ) , Q(x) ≡ P (xm ), m = 20 P (xn )log2 U (xn ) = Q(x) x∈X
There have been several proposals for distributed intrusion detection such as distributed collection and centralized coordination [6], [7], hierarchical [10], [13], and fully distributed systems [8], [11], [12], [14]–[17]. To overcome some of the limitations of centralized and hierarchical approaches, such as single points of failure, fully distributed intrusion detection systems have been proposed. Chhabra et al. [11] demonstrate that a fully distributed approach to spatial volume anomaly detection can be just as effective as centralized approaches. Locasto et al. proposed a fully distributed P2P IDS [9]. However, the method uses a single traffic feature, which might be too restrictive for detecting some important characteristics of large-scale intrusions. We make a step forward by proposing DIAMoND to exchange nonparametric levels of concern between neighbors without elaborating any further details on the attacks themselves. In a distributed IDS proposed by Dash et al. [14], local detectors use a binary classifier to analyze incoming/outgoing host traffic and raise an alarm if a threshold value is crossed. Through their information sharing system (ISS), those alarms are sent to a random set of global detectors that generate a global view of security status of the system being monitored. One of the main drawbacks of their system, however, is the separation of global detectors and local detectors, and the need for the ISS to coordinate messages between them.
Yegneswaran et al. proposed the DOMINO system [12] that consists of three types of participants: axis overlay nodes that create a fully distributed P2P architecture, satellite communities that create smaller networks of communicating nodes and provide a wide diversity of alert data to axis nodes, and finally, terrestrial contributors that deliver to the system any form of external intrusion data from firewalls, NIDS, etc. An open question in DOMINO is its data privacy, and the efficiency of the distributed architecture. In our work, we propose to exchange non-parametric levels of concern between nearest neighbors which preserves data privacy. VI. C ONCLUSIONS In this paper, we proposed DIAMoND: a non-parametric distributed coordination framework for network intrusion detection. To illustrate its application, we coupled DIAMoND with local anomaly detection schemes for stealthy port scan and SYN flooding based DDoS and evaluated its performance on emulation testbed. DIAMoND constantly demonstrated up to 20% sensitivity enhancement without sacrificing specificity over wide range of coordination network topologies. In this paper, we also systematically investigated several automated coordination neighborhood constructions strategies and found that DIAMoND exhibits stable performance gain over neighborhood of TTL=1, 2, 3. This leads us to conclude that DIAMoND is robust to neighborhood size. We further conclude from our experiments that DIAMoND has no strong correlation with network topologies either. Deployment impact showed that DIAMoND quickly reaches information gain plateau after 30% of network nodes participating in coordination, which enhances the deployability of DIAMoND. DIAMoND allows multiple entities who may be functionally and/or legally prohibited from sharing cyber data to leverage each other’s insight and increase their effectiveness at cyber defense. Further, DIAMoND enables real-time adaptation, eliminating the identification-designed-response delay inherent in defenses that react to known and defined threats and allowing active defense for emerging, novel attacks. As our immediate next step we plan to explore the scalability of DIAMoND coordination protocol and apply it to a broad set of real-network topologies. VII. ACKNOWLEDGMENTS The US Department of Homeland Security sponsored this research under the Air Force Research Laboratory (AFRL) agreement number FA8750-12-2-0232. The US Government is authorized to reproduce and distribute reprints for Governmental purposes. This work represents the views of the authors and do not represent official policies or endorsements, either expressed or implied, of AFRL or the US Government. R EFERENCES [1] P. Wang, L. Wu, B. Aslam, and C. C. Zou, “A Systematic Study on Peer-to-Peer Botnets,” in Proc. of ICCCN. IEEE Computer Society, 2009, pp. 1–8. [2] S. Gallagher, “Microsoft Disrupts Botnet That Generated $2.7M per Month for Operators,” http://arstechnica.com, December 2013.
[3] MITRE, “Structured Threat Information eXpression: A Structured Language for Cyber Threat Intelligence Information.” [Online]. Available: https://stix.mitre.org [4] MITRE, “Trusted Automated eXchange of Indicator Information: Enabling Cyber Threat Information Exchange.” [Online]. Available: https://taxii.mitre.org [5] D. Melancon, “ISACs: Let the Sharing Begin,” 2014. [Online]. Available: http://www.tripwire.com [6] J. Ullrich, “DShield: Internet Storm Center - Internet Security,” http://www.dshield.org, November 2000. [7] G. Vigna and R. A. Kemmerer, “NetSTAT: A Network-Based Intrusion Detection Approach,” in Proc. of ACSAC. IEEE Computer Society, 1998, p. 25. [8] C. Zhou, S. Karunasekera, and C. Leckie, “A Peer-to-Peer Collaborative Intrusion Detection System,” in In Proc. of the IEEE 7th Malaysia International Conference on Communication, vol. 1, November 2005. [9] M. Locasto, J. J. Parekh, A. D. Keromytis, and S. J. Stolfo, “Towards Collaborative Security and P2P Intrusion Detection,” in In Proc of the IEEE Information Assurance Workshop (IAW), 2005, pp. 333–339. [10] P. A. Porras and P. G. Neumann, “EMERALD: Event Monitoring Enabling Responses to Anomalous Live Disturbances,” in Proc. of NISSC, 1997, pp. 353–365. [11] P. Chhabra, C. Scott, E. D. Kolaczyk, and M. Crovella, “Distributed Spatial Anomaly Detection,” in Proc. of INFOCOM. IEEE, 2008, pp. 1705–1713. [12] V. Yegneswaran, P. Barford, and S. Jha, “Global Intrusion Detection in the DOMINO Overlay System,” in Proc. of NDSS, 2004. [13] J. Li, D.-Y. Lim, and K. Sollins, “Dependency-based Distributed Intrusion Detection,” in Proc. of DETER. USENIX Association, 2007. [14] D. Dash, B. Kveton, J. M. Agosta, E. Schooler, J. Chandrashekar, A. Bachrach, and A. Newman, “When Gossip is Good: Distributed Probabilistic Inference for Detection of Slow Network Intrusions,” in Proc. of NISSC, 2006, pp. 1115–1122. [15] C. J. Fung, Q. Zhu, R. Boutaba, and T. Basar, “Poster: SMURFEN: A Rule Sharing Collaborative Intrusion Detection Network,” in ACM CCS. ACM, 2011, pp. 761–764. [16] N. Boggs, S. Hiremagalore, A. Stavrou, and S. J. Stolfo, “Cross-Domain Collaborative Anomaly Detection: So Far Yet So Close,” in Proc. of RAID. Springer-Verlag, 2011, pp. 142–160. [17] Q. Zhu, C. Fung, R. Boutaba, and T. Basar, “A Distributed Sequential Algorithm for Collaborative Intrusion Detection Networks,” in Proc. of IEEE ICC, May 2010, pp. 1–6. [18] P. Fonash, “Using Automated Cyber Threat Exchange to Turn the Tide against DDoS,” 2014. [Online]. Available: http://rsaconference.com [19] O. Serrano, L. Dandurand, and S. Brown, “On the Design of a Cyber Security Data Sharing System,” in Proc. of the ACM Workshop on Information Sharing & Collaborative Security. ACM, 2014, pp. 61–69. [20] E. Belmega, L. Sankar, H. Poor, and M. Debbah, “Pricing Mechanisms for Cooperative state Estimation,” in Proc. of IEEE ISCCSP, May 2012, pp. 1–4. [21] M. Korczy´nski, “Simulation Testbed of DIAMoND,” http://mkorczynski.com/diamond.html, January 2015. [22] M. Korczy´nski, L. Janowski, and A. Duda, “An Accurate Sampling Scheme for Detecting SYN Flooding Attacks and Portscans,” in Proc. of IEEE ICC, June 2011, pp. 1–5. [23] M. Korczy´nski, “Classifying Application Flows and Intrusion Detection in the Internet Traffic,” Ph.D. dissertation, École Doctorale Mathématiques, Sciences et Technologies de l’Information, Informatique (EDMSTII), Grenoble, France, November 2012. [24] R. Fontugne, P. Borgnat, P. Abry, and K. Fukuda, “MAWILab: Combining Diverse Anomaly Detectors for Automated Anomaly Labeling and Performance Benchmarking,” in Proc. of CoNEXT. ACM, 2010, pp. 1–12. [25] Open Networking Lab, “POX,” https://openflow.stanford.edu, 2014. [26] B. Lantz, B. Heller, and N. McKeown, “A Network in a Laptop: Rapid Prototyping for Software-defined Networks,” in Proc. of the 9th ACM SIGCOMM Workshop on Hot Topics in Networks. ACM, 2010. [27] M. Hall, E. Frank, G. Holmes, B. Pfahringer, P. Reutemann, and I. H. Witten, “The WEKA Data Mining Software: An Update,” SIGKDD Explor. Newsl., vol. 11, no. 1, pp. 10–18, 2009. [28] P. Barford, A. Bestavros, J. Byers, and M. Crovella, “On the Marginal Utility of Network Topology Measurements,” in Proc. of the 1st ACM SIGCOMM Workshop on Internet Measurement. ACM, 2001, pp. 5–17.
Table I Sensitivity , 1 − specificity (95% CONFIDENCE INTERVAL ), ACCURACY OF BLID AND DIAM O ND, THE ACCURACY GAIN OF DIAM O ND OVER BLID FOR FOUR TEST FUNCTIONS (A: LOW, B: MED , C: MED +, AND D: HIGH ).
Test A B C D A B C D A B C D A B C D A B C D A B C D A B C D A B C D A B C D A B C D
Sensitivity 1 - Specificity DIAMoND BLID DIAMoND BLID Stealth scan, star topology, TTL=1 neighborhood 0.594(±0.024) 0.702(±0.025) 6.4e−4 (±2.2e−4 ) 0.01(±0.002) 0.893 0.575(±0.023) 0.688(±0.023) 7.6e−4 (±2, 6e−4 ) 0.011(±0.002) 0.889 0.58(±0.02) 0.8(±0.015) 6.2e−4 (±1, 5e−4 ) 0.017(±0.003) 0.889 0.583(±0.022) 0.837(±0.013) 4.8e−4 (±6.8e−5 ) 0.034(±0.003) 0.887 Stealth scan, tree topology, TTL=1 neighborhood 0.57(±0.022) 0.679(±0.02) 5.7e−4 (±1.3e−4 ) 0.008(±0.002) 0.893 0.581(±0.021) 0.688(±0.02) 6.7e−4 (±1.9e−4 ) 0.011(±0.002) 0.891 0.592(±0.027) 0.797(±0.028) 6.7e−4 (±2e−4 ) 0.018(±0.003) 0.891 0.571(±0.025) 0.817(±0.024) 7.9e−4 (±3.8e−4 ) 0.029(±0.003) 0.89 Stealth scan, mesh topology, TTL=1 neighborhood 0.599(±0.026) 0.66(±0.028) 5.6e−4 (±1.5e−4 ) 0.004(±0.001) 0.889 0.586(±0.022) 0.645(±0.024) 5.5e−4 (±1.4e−4 ) 0.002(±6.6e−4 ) 0.893 0.574(±0.019) 0.771(±0.016) 7.2e−4 (±2.2e−4 ) 0.012(±0.003) 0.89 0.571(±0.02) 0.833(±0.018) 5.5e−4 (±1.5e−4 ) 0.032(±0.003) 0.889 Stealth scan, full mesh topology, TTL=1 neighborhood 0.557(±0.014) 0.578(±0.016) 4.8e−4 (±1.1e−4 ) 5.2e−4 (±1.3e−4 ) 0.881 0.556(±0.019) 0.574(±0.021) 6.9e−4 (±2.2e−4 ) 7.5e−4 (±2.5e−4 ) 0.884 0.551(±0.015) 0.657(±0.023) 5.7e−4 (±2e−4 ) 0.005(±0.002) 0.884 0.562(±0.016) 0.725(±0.029) 5e−4 (±1.1e−4 ) 0.02(±0.004) 0.882 DDoS attack, star topology, TTL=1 neighborhood 0.922(±0.023) 0.938(±0.02) 0.004(±6.6e−4 ) 0.018(±0.002) 0.95 0.92(±0.016) 0.937(±0.016) 0.004(±6.5e−4 ) 0.018(±0.003) 0.95 0.923(±0.012) 0.962(±0.01) 0.005(±7.3e−4 ) 0.032(±0.004) 0.95 0.922(±0.03) 0.967(±0.024) 0.004(±7e−4 ) 0.038(±0.004) 0.95 DDoS attack, full mesh topology, TTL=1 neighborhood 0.922(±0.023) 0.932(±0.023) 0.003(±6.2e−4 ) 0.008(±0.001) 0.949 0.922(±0.015) 0.931(±0.015) 0.004(±5.9e−4 ) 0.007(±0.001) 0.95 0.921(±0.018) 0.951(±0.018) 0.004(±4.8e−4 ) 0.017(±0.002) 0.949 0.922(±0.019) 0.959(±0.018) 0.004(±8e−4 ) 0.028(±0.005) 0.949 Stealth scan, star topology, TTL=2 neighborhood 0.575(±0.029) 0.684(±0.032) 6e−4 (±1.3e−4 ) 0.008(±0.002) 0.89 0.565(±0.022) 0.676(±0.024) 6.4e−4 (±1.3e−4 ) 0.01(±0.002) 0.889 0.557(±0.021) 0.787(±0.021) 7.5e−4 (±5.2e−4 ) 0.019(±0.003) 0.889 0.561(±0.025) 0.843(±0.014) 5.3e−4 (±1.4e−4 ) 0.032(±0.003) 0.887 Stealth scan, star topology, TTL=3 neighborhood 0.599(±0.027) 0.701(±0.028) 7.3e−4 (±1.7e−4 ) 0.009(±0.002) 0.887 0.584(±0.024) 0.68(±0.026) 8.4e−4 (±3.1e−4 ) 0.01(±0.003) 0.89 0.568(±0.029) 0.793(±0.029) 6.1e−4 (±1.7e−4 ) 0.02(±0.003) 0.887 0.578(±0.025) 0.851(±0.015) 6.7e−4 (±1.6e−4 ) 0.036(±0.003) 0.889 Stealth scan, star topology, attack correlation neighborhood 0.535(±0.022) 0.658(±0.025) 6.69e−4 (±1.7e−4 ) 0.013(±0.002) 0.889 0.563(±0.02) 0.702(±0.022) 9.57e−4 (±5.8e−4 ) 0.016(±0.003) 0.888 0.528(±0.027) 0.752(±0.027) 5.55e−4 (±1.3e−4 ) 0.02(±0.003) 0.891 0.531(±0.023) 0.787(±0.022) 5.8e−4 (±1.6e−4 ) 0.04(±0.004) 0.891 Stealth scan, full mesh topology, attack correlation neighborhood 0.533(±0.017) 0.586(±0.021) 4.5e−4 (±9.9e−5 ) 0.007(±0.001) 0.886 0.528(±0.015) 0.595(±0.018) 8.2e−4 (±3.4e−4 ) 0.01(±0.002) 0.887 0.522(±0.015) 0.672(±0.017) 5.7e−4 (±2.6e−4 ) 0.01(±0.002) 0.881 0.532(±0.014) 0.739(±0.012) 5.4e−4 (±1.1e−4 ) 0.03(±0.002) 0.886 BLID
Accuracy DIAMoND
Gain
0.914 0.911 0.935 0.932
0.022 0.022 0.047 0.045
0.915 0.911 0.932 0.932
0.021 0.021 0.042 0.042
0.904 0.907 0.932 0.939
0.015 0.014 0.043 0.045
0.887 0.89 0.908 0.912
0.006 0.006 0.024 0.03
0.955 0.955 0.964 0.965
0.004 0.005 0.014 0.014
0.953 0.954 0.963 0.963
0.005 0.004 0.014 0.015
0.912 0.91 0.932 0.936
0.022 0.022 0.045 0.05
0.909 0.908 0.932 0.935
0.023 0.018 0.045 0.047
0.91 0.914 0.931 0.924
0.021 0.027 0.041 0.034
0.895 0.896 0.911 0.913
0.01 0.01 0.031 0.027