Jun 27, 2002 - keeper) decides whether or not a new arriving call. (consisting of two flows in opposite ...... 33-39, Port Jefferson (NY), USA,. 25-26 June 2001.
Proceedings of Networks 2002 (10th International Telecommunication Network Strategy and Planning Symposium), pp. 205-212, Munich (Germany), 23-27 June 2002.
Dimensioning QoS-enabled Telephony and Videophony
IP Networks
for High-Quality
Jan Janssen#, Danny De Vleeschauwer#, Maarten J.C. Büchli# and Rob E. Kooij* # Alcatel Bell, Network Strategy Group, Francis Wellesplein 1, B-2018 Antwerp, Belgium * KPN Research Leidschendam, St. Paulusstraat 4, 2264 XZ Leidschendam, The Netherlands
Abstract IP networks are becoming increasingly popular for transporting real-time services like telephony and videophony. In order to dimension the network such that a good quality can be guaranteed to these services delay, jitter and loss have to be kept under control (as these parameters have a considerable impact on the quality). In this paper, we use an accurate heuristic formula to calculate the end-to-end delay for real-time telephony and videophony traffic transported over an IP-based network. Both Head-of-Line (HoL) and Weighted Fair Queuing (WFQ) scheduling are considered. We determine the number of telephony and videophony flows that can be supported by specific IP networks without jeopardizing the quality. Moreover, we also illustrate the effect of the fact that users shift from traditional telephony to videophony on the performance of the real-time services. We also consider the impact of the real-time traffic on the other traffic. For WFQ this impact is minimal. For HoL we calculate the time the other queues are blocked by the real-time queue.
1
Introduction
More and more real-time services are transported over an IP network that traditionally was used to transport TCP-controlled, elastic data applications. Mixing realtime traffic with TCP-controlled traffic in one queue could lead to bad quality for the real-time applications because of the bursty nature of TCP-controlled traffic. For instance, if a voice packet would have to queue behind a burst of TCP packets (e.g. when a large file is being downloaded), this can introduce unacceptably high delays. Therefore, in the Internet Engineering Task Force (IETF) considerable effort has been spent to define mechanisms (i.e. IntServ and DiffServ) with which real-time traffic can be given preferential treatment over data traffic, or, at least, be separated from data traffic. The philosophy behind IntServ is to reserve (e.g. via the Resource ReSerVation Protocol (RSVP)) a separate queue in each router that a flow traverses. Since this is not scalable, DiffServ was developed as an alternative mechanism aggregating flows with similar performance constraints into a limited number of classes. Each traffic aggregate is directed to its own queue. In this paper we assume that the traffic is aggregated in a few classes, of which the highest-priority class contains the telephony and videophony traffic. On top of this highest priority queue, there is certainly one (or several others) to serve TCP-controlled data traffic, and maybe also others to serve e.g. streaming
#
video traffic stemming from Broadcast Video (BV) or Video on Demand (VoD) services. We further assume that for the real-time services like telephony and videophony a softswitch (or gatekeeper) decides whether or not a new arriving call (consisting of two flows in opposite direction) can be accepted and that the operator knows the typical behavior of its telephony and videophony users. Hence, the operator can calculate with e.g. an Erlang-B-like approach [8] how many users are active in worst-case conditions (under the assumption that the softswitch should only block e.g. 1 out of 10000 calls). Based on this calculation the operator typically knows the amount of real-time traffic he needs to transport. The burstiness of the real-time traffic is typically not known. To assess the performance of this real-time traffic the operator needs simple models. In this paper we develop some heuristic formulae, valid under the assumptions justified in Section 2, to assess the performance of real-time traffic. An operator of a wide-scale DiffServ network that has knowledge of the amount of real-time traffic he has to transport, faces the problem of dimensioning his network. In order to ensure that the end-to-end delay of the real-time traffic is not too large and that all the other but the real-time traffic is not starved, the operator has to decide which scheduling mechanism (e.g. Head of Line (HoL) or Weighted Fair Queuing (WFQ)) to use and how much capacity is needed. Moreover, for WFQ, he needs to determine how much capacity has to be reserved for each of the classes by
This work was partly carried out within the framework of the project CoDiNet sponsored by the Flemish Institute for the Promotion of Scientific and Technological Research in the Industry (IWT).
Proceedings of Networks 2002 (10th International Telecommunication Network Strategy and Planning Symposium), pp. 205-212, Munich (Germany), 23-27 June 2002.
choosing appropriate weights. These topics are addressed in this paper, which is organized as follows. In Section 2, we describe the network scenario and the characteristics of the considered telephone and videophone calls. Section 3 contains a high-level presentation of the modeling approach used to quantify the end-to-end queuing delays over an IP-based network with HoL or WFQ scheduling. The mathematical details can be found in [7]. Some results, both for HoL and WFQ, are given in Section 4 for different link capacities and, in the case of WFQ, for different weights assigned to the real-time traffic. Finally, Section 5 draws the conclusions of this study.
2
Scenario and assumptions
2.1
Network topology
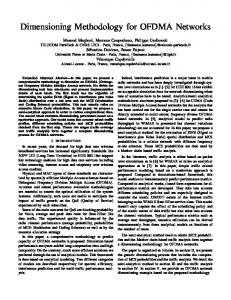
Figure 1 shows the scenario considered in this paper. To each packet-based access network a number of users are connected: K of the users use the telephony service, L use the videophony service, others use a data service (e.g. web browsing, file transfer) or a streaming video service (e.g. VoD, BV). In this paper we only consider the performance of the interactive services, i.e. telephony and videophony. We do not study the performance of the data services, nor do we investigate the performance of VoD and BV. An IPbased backbone network interconnects the access networks. Both the access and backbone networks are Quality of Service (QoS) enabled. K telephones L videophones
K telephones L videophones
Access network
Access network
ER
ER
IP backbone ER
ER
Access network
Access network
K telephones L videophones
K telephones L videophones
(ER = Edge Router)
Fig. 1
Considered scenario
A typical flow is transported over NA access nodes (the sum of the access nodes in the two traversed access networks) and NB backbone nodes. The capacity of an access and backbone node is Rlink,A and Rlink,B, respectively.
2.2
Real-time traffic to be transported
The telephones use the G.711 or the G.726 format and generate a net codec bit rate of 64 kb/s and 32 kb/s, respectively. We take a packetization delay of 30 ms. This means that every 30 ms a voice packet of size St64 = 280 byte or St32 = 160 byte for the G.711 and G.726 codec, respectively, is produced (consisting of a 240 or 120 byte payload and 20 byte IPv4, 8 byte UDP and 12 byte RTP overhead). Hence, the gross bit rate of a voice codec is Rt64 = 74.7 kb/s for the G.711 codec and Rt32 = 42.7 kb/s for the G.726 codec. Of all telephones there is a fraction φ using the G.711 codec (and a fraction 1 - φ using the G.726 codec). The videophones use the H.261 format and generate a net codec bit rate of 384 kb/s. The camera produces an image each 30 ms. We assume that the encoder smoothens the resulting bit rate such that on average one packet of (constant) size Svid = 1480 byte (consisting of a 1440 byte payload and 40 byte overhead) is produced every 30 ms. Hence, a videophone generates a gross bit rate of Rvid = 394.7 kb/s. The (worst-case) packet size for all other services (data, VoD, BV services) equals Sdat = 1500 byte. Remark that both a telephone and a videophone source is Constant Bit Rate (CBR). As will become clear below, we will not need the detailed traffic characteristics for the TCP-controlled data sources, VoD or BV sources. The two central assumptions throughout this paper are the following. First, similar as in [5], we assume that the arrival process of an aggregate of real-time sources at each node can be modeled as a Poisson arrival process. This can be justified as follows. We explained that both types of real-time sources are CBR. Modeling an aggregate of CBR sources at the ingress node as a Poisson process is worst case. In [1] and [2], it has been argued that if a number of flows that are ‘better than Poisson’ (i.e., with lower variability of the interarrival times) are multiplexed in a (FIFO) buffer, then the outgoing streams continue to be better than Poisson. Hence, modeling an aggregate as a Poisson process is worst case. Note that there is recent evidence that even TCP-controlled data traffic is very well approximated by a Poisson arrival process if the load is high enough [4]. Second, we assume that the delays encountered in all consecutive nodes are statistically independent variables. This forms a good approximation if in each node (enough old traffic is routed away and) enough new traffic is multiplexed with the flow under consideration [9], [10], [11]. In any case, it is a worst-case assumption, see also [1]. Since the arrival process can be modeled as a Poisson process, specifying the load is sufficient to describe the traffic. In the access network the loads generated by K telephones and L videophones is given by
Proceedings of Networks 2002 (10th International Telecommunication Network Strategy and Planning Symposium), pp. 205-212, Munich (Germany), 23-27 June 2002.
ρt, A =
KφRt 64 + K (1 − φ ) Rt 32
,
Rlink , A
ρ v, A = L
(1)
Rvid
,
Rlink , A
(2)
respectively. The total load of the real-time traffic in the access network is ρA = ρt,A + ρv,A. In the backbone network, the link speeds will be higher, but (on average) a node will serve traffic from possibly more than one access network. We define the aggregation grade γ as the number of access networks that are typically served by one backbone node. Hence, the load generated by the telephones and the videophones on a backbone node is given by
ρ t ,B = γ
KφRt 64 + K (1 − φ ) Rt 32 Rlink , B
=γ
Rlink , A Rlink , B
ρt, A
,
(3)
ρ v , B = γL
Rvid Rlink , B
=γ
Rlink , A Rlink , B
ρ v, A ,
(4)
respectively. The total load of the real-time traffic in the backbone network is ρB = ρt,B + ρv,B.
2.3
Queuing delay budget
Both the telephony and videophony services are realtime. For the telephone service it is well known that there is a 150 ms end-to-end (phone-to-phone) delay budget in order to have an interactive conversation, provided that the echo on the call is completely removed [6]. We take the same end-to-end delay budget of 150 ms for the videophony service. Part of this budget is consumed in the encoding and packetization stage. For telephony a packetization delay of 30 ms was taken. To that a codec delay of typically 15 ms should be added. This may seem a large value, but it must be taken into account that on the processor performing the encoding other processes run too. For videophony it is harder to specify a clear definition for the packetization delay. On the one hand the raw information does not come at a regular rate, but as big chunks (i.e. images) every 30 ms. On the other hand, there is a previously discussed smoothening action of the encoder that ensures that the output of the video coder is CBR, but also may introduce some delay. Since it is beyond the scope of this paper to discuss videophony codecs in detail, we assume that the videophony encoder and packetizer introduces a similar delay as the telephony encoder and packetizer, i.e. about 45 ms. In the access and backbone networks serialization, route-lookup, propagation and queuing delay is intro-
duced. The former two are negligible with respect to the budget of 150 ms for the wire-speed routers and the link rates considered in this paper. The propagation delay mainly occurs in the backbone as (we assume that) an access network is local. We assume a worst-case propagation delay of 80 ms, which (as the speed of light through a fiber is about 5 µs per km) corresponds to a distance of 16000 km. For calls stretching out over more than 16000 km the delay of 150 ms cannot be guaranteed. In the packet-based network there is also queuing delay, and it is precisely this delay that is assessed in this paper. Queuing delay introduces jitter in the flow of packets stemming from a telephone or videophone source. Since the decoder needs the packets at the original constant rate, the flow needs to be dejittered. Although adaptive dejittering methods exists, we use a static dejittering mechanism in this paper, because it is likely that telephone and videophone calls will generally not last long enough for a dynamic dejittering mechanism to converge. A static dejittering mechanism retains the first arriving packet of a flow for a certain time (referred to as the dejittering delay) in the dejittering buffer and then reads the buffer periodically. If the packet to be played is late, i.e., does not reside in the buffer when it is supposed to be played, this packet is lost. This happens too often if the dejittering delay is chosen too small (and the first arriving packet is a fast one). Therefore, the dejittering delay is often chosen equal to the worst-case queuing delay. The ‘worst-case’ queuing delay is taken to be the (1P)-quantile of the total queuing delay distribution, where P is the fraction of packets that is allowed to get lost in the dejittering buffer. Although some codecs are robust against packet loss we take a value on the safe side for P, i.e. P = 10-5. Finally, the payloads need to be decoded. For telephony this takes a few ms, not only due to the decoding process but also due to echo control. For videophony we assume that the decoder introduces a similar delay as the telephony decoder, i.e. about 5 ms. The result of this reasoning is that there is a delay budget of about 10 ms left for queuing. Also the dejittering delay of the static dejittering mechanism takes this value of 10 ms. The worst-case flow (with 45 ms delay in the packetizer, 80 ms propagation delay, 10 ms total queuing delay, 10 ms dejittering delay and 5 ms delay in the decoder) just consumes the 150 ms budget.
3
Modeling approach
All real-time traffic is mixed in one queue, which seems a straightforward choice, as the delay requirements of both services are quite similar. All other (TCP-controlled data, VOD and BV) traffic is directed into another queue (or several other queues).
Proceedings of Networks 2002 (10th International Telecommunication Network Strategy and Planning Symposium), pp. 205-212, Munich (Germany), 23-27 June 2002.
To serve this set of queues we consider two non-preemptive, work-conserving scheduling disciplines: Head of Line (HoL) and Weighted Fair Queuing (WFQ). A high-level overview of the used theoretical approach is described below. For mathematical details, we refer to (the Appendix of) [7].
3.1
The queuing system with HoL scheduling
In order to assess the performance of the HoL scheduler, we first approximate the delay incurred through a network of HoL nodes by the heuristic formula developed in [5]. This heuristic formula approximates the worst-case queuing (and dejittering) delay value in a voice only network by a (1-P)-quantile of the total queuing delay encountered in consecutive M/G/1 nodes, with P = 10-5 the fraction of packets that is allowed to get lost in the dejittering buffer. To obtain the quantile when also lower-priority data is present, we need to add a perturbation term equal to the service time of a typical data packet (i.e., the maximum time the highest-priority queue can get blocked by a lowerpriority one). In [7], this method is shown to be quite accurate. It slightly underestimates the delay and gets more accurate for higher loads. A disadvantage of the HoL scheduling mechanism is that it can block (i.e., deny service for) the lowerpriority queues for a long time. In order to assess this effect we also calculate the (1-P)-quantile of the busy period of the highest-priority queue, which is a typical (worst-case) time the lower-priority queue gets blocked. This quantile is calculated with a heuristic formula developed and checked in [7].
3.2
The queuing system with WFQ scheduling
The reasoning followed for the queuing system with WFQ is similar as in [3]. The aim of (each variant of) a WFQ implementation is to approximate an ideal Generalized Processor Sharing (GPS) system that separates the bandwidth perfectly. In particular, with αi (with i = A or B for access and backbone, respectively) the weight assigned to the real-time queue, the GPS system guarantees a capacity of at least αiRlink,i for that queue. The WFQ system only approximates the GPS system. The delay in a WFQ system is the one in a GPS system plus a perturbation term. The delay in a GPS system is the delay incurred in a M/G/1 node of capacity αiRlink,i. Again, this delay can be very well approximated with the heuristic formula of [5]. The perturbation term, which is of the order of the service time of a data packet, is in most cases negligi-
ble with respect to the 10 ms budget for the queuing delay. Since the WFQ system with αi = 1 is exactly the same as the HoL system, we take for the perturbation term the same as in HoL. In [3], it was shown (for some simple cases) that the overall results produced by this method closely approximate the results obtained with simulations. We do not calculate the blocking time for WFQ as in this kind of scheduling no queue can block any other queue (that has a weight different from 0) for a prolonged time. The blocking time is of the order of the service time of a typical packet, which is negligible at the link speeds considered in this paper.
4
Results
We present our results from the viewpoint of a network operator in search of the optimal scheduling system for both telephony and videophony services over its packet-based network infrastructure. For simplicity, we assume the access and backbone networks to be managed by the same operator. We take NA = 2, NB = 6, γ = 1 and P = 10-5 as fixed parameters. The influence of the other parameters (Rlink,A, Rlink,B and φ) is investigated below. We first discuss the queuing system with HoL scheduling, after which the WFQ case is commented upon (in which we also investigate the influence of αi).
4.1
The queuing system with HoL scheduling
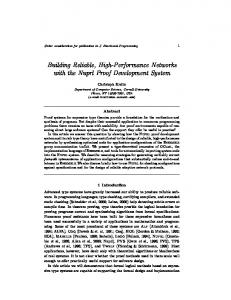
In Figure 2, we present so-called ‘equi-queuing delay’ curves for a HoL scheduling system mixing telephony and videophony traffic in one queue. The variable parameters are chosen to be Rlink,A = 34 Mb/s, Rlink,B = 155 Mb/s and φ = 1, i.e., all calls are transported in the G.711 format. The equi-queuing delay curves connect all (K, L)-pairs that have the same value of the (1-P)-quantile of the end-to-end queuing delay. Recall from Section 2 that the interactivity of the telephone and videophone calls might be harmed when this end-to-end queuing delay exceeds 10 ms. Suppose that initially, no videophony service is offered. From Figure 2, we then can derive the maximum number of simultaneously active telephones K that can be supported given a certain queuing delay value (by determining the intersection of the corresponding equi-queuing delay curve with the K-axis). When videophony services will start to take off and the operator wants to offer the same quality (as before) to all telephony and videophony users (by adhering to the same end-to-end queuing delay bound), the maximum number of simultaneously active telephony users K decreases approximately linearly with the number of simultaneously active videophony users L.
Proceedings of Networks 2002 (10th International Telecommunication Network Strategy and Planning Symposium), pp. 205-212, Munich (Germany), 23-27 June 2002.
15 20
60 7
10
number of videophones L
50 6
9 8
40 5
30
4
20 3 10 2 0 0
50
100
150
200 250 300 number of telephones K
350
400
450
smaller (finite) queuing delays, this ratio of G.726 versus G.711 telephony users increases. More precisely, the smaller the allowed queuing delay, the larger the ratio of G.726 and G.711 telephone calls. This effect is caused by the fact that G.726 packets are smaller, and hence, to reach the same queuing delay, the load of an aggregate of G.726 flows can be slightly higher. When L increases, or, equivalently, when the relative portion of videophony traffic increases, this ratio between the maximum allowable number of G.726 and G.711 telephones will decrease. In particular, there is no difference between the maximum L-values of Figure 2 and Figure 3 when videophony takes up all the capacity (i.e. K = 0).
Fig. 2 Equi-queuing delay (in ms) curves for HoL (Rlink,A = 34 Mb/s, Rlink,B = 155 Mb/s, φ = 1)
20
7 50
number of videophones L
Figure 2 can also be interpreted alternatively. For example, assume that initially (when no videophony is offered), the access network serves 200 simultaneous telephony users during peak hours. The resulting endto-end queuing delay then equals 1.75 ms. As time goes by, a fraction of these 200 users are likely to switch from telephony to videophony. Obviously, this shift will have a serious impact on the performance of the real-time services. For example, the maximum number of videophones L (out of this total of 200 users) that can be supported with an end-to-end queuing delay below 10 ms equals 40. More precisely, for (K, L) = (160, 40), the end-to-end queuing delay equals 9.51 ms. When even more of the 200 users shift from telephony to videophony, the end-to-end queuing delay of 10 ms (and, thus, the overall delay bound of 150 ms) will be exceeded. At that point the increase in delay can be quite severe as can be seen by following the dashed line in Figure 2, connecting all pairs for which K + L = 200. Note also that the maximum number of videophones that can be active while still respecting the queuing delay bound of 10 ms equals 64. To prevent a decrease in interactivity of the real-time services when videophony is getting popular (as observed above), the network operator might opt to use compression techniques for its telephony traffic. In particular, there exist low bit rate codecs for telephony that only result in a slight decrease of the quality, or, equivalently, have small distortion impairments [6]. Figure 3 presents the equi-queuing delay curves when the G.726 codec at 32 kb/s is used for compressing the telephone traffic, i.e. φ = 0. The other parameters remain unchanged. In comparison to Figure 2, similar (K, L)-pairs will have smaller end-to-end queuing delays. Also, the maximum number of telephony users K increases for a fixed queuing delay and a fixed number of videophony users L. When L = 0, the ratio of the number of G.726 and G.711 telephony users equals 1.75 = 74.7/42.7 (the inverse ratio of the gross codec bit rates) for infinite queuing delays or ρA = 1. For
60
10 6
40
15
9 5
8
30 4 20 3 10 2 0 0
100
200
300 400 500 number of telephones K
600
700
800
Fig. 3 Equi-queuing delay (in ms) curves for HoL (Rlink,A = 34 Mb/s, Rlink,B = 155 Mb/s, φ = 0) The comparison between Figure 2 and Figure 3 can also be expressed in terms of our specific example. Again, we have plotted a dashed line through all (K, L)-pairs for which K + L = 200. For (K, L) = (200, 0), i.e., when 200 telephony users are simultaneously active in the access network while videophony is not deployed yet, the end-to-end queuing delay equals 1.36 ms. The maximum number of videophones L (out of the total of 200 users) that can be supported with an end-to-end queuing delay below 10 ms slightly increases to 52 (opposed to 40 when the G.711 codec was used for telephony). More precisely, for (K, L) = (148, 52), the end-to-end queuing delay equals 9.8 ms. When even more of the 200 users shift from telephony to videophony, the end-to-end queuing delay of 10 ms (and, thus, the overall delay bound of 150 ms) will be exceeded. Another, more drastic approach to allow more videophony onto the network without decreasing the interactivity of the real-time services consists in increasing the link speeds in both access and backbone networks. In Figure 4 we present the equi-queuing delay curves for Rlink,A = 155 Mb/s, Rlink,B = 620 Mb/s. We assume that the G.711 codec is used for telephony services, i.e. φ = 1. Roughly speaking, similar (K, L)-pairs will again have smaller end-to-end queuing delays than in Figure 2, or, equivalently, more tele-
Proceedings of Networks 2002 (10th International Telecommunication Network Strategy and Planning Symposium), pp. 205-212, Munich (Germany), 23-27 June 2002.
phones/videophones can be served for a fixed end-toend queuing delay. In particular, 200 real-time service users can be served with an end-to-end queuing delay smaller than 2 ms, independent of the respective amount of telephones and videophone users among them. 400
350
number of videophones L
300
5
3
9
4
250
200
6
7
15 8
150
100
2
50
10
1 20
0 0
200
400
600
800 1000 1200 1400 number of telephones K
1600
1800
2000
Fig. 4 Equi-queuing delay (in ms) curves for HoL (Rlink,A = 155 Mb/s, Rlink,B = 620 Mb/s, φ = 1) 60
number of videophones L
50
40
9 30
10
15 20
20
5
6 7 8
10 2
3
4
1 0 0
50
100
150
200 250 300 number of telephones K
350
400
450
4.2
In order to prevent all queues but the highest (realtime) queue from being blocked for certain periods in time, a WFQ scheduler is considered. In order to allow a more or less fair comparison with HoL scheduling, we again assume that all real-time traffic (telephony and videophony) is mixed in the same queue. We assume that φ = 1 (the G.711 codec is used for telephony), Rlink,A = 155 Mb/s and Rlink,B = 620 Mb/s. The latter link speeds are chosen that high because only portions αA and αB of these bandwidths are (minimally) assigned to the real-time traffic queues in the access and backbone part, respectively. That is, the real-time queue is only served at a fraction of the link capacity (as opposed to HoL where the complete link capacity is in principle available for telephony and videophony traffic). Similarly, also the other queues can be guaranteed a minimum service rate by assigning a specific portion of the bandwidth to them. We assume that the weights are chosen such that their sum is 1. For simplicity, we also assume αA = αB in the remainder of this paper. First, we consider the case with αA = αB = 0.25. Observe that 620 Mb/s × 0.25 = 155 Mb/s and 155 Mb/s × 0.25 ≈ 34 Mb/s. As such, the resulting equi-queuing delay curves (presented in Figure 6) are very similar to the ones of Figure 2. The negligible, constant difference in delays for the same (K, L)-pairs stems from the fact that both for HoL and WFQ, the total service time of a data packet was taken into account as a worst-case assumption. Therefore, the endto-end queuing delays for the WFQ system (with Rlink,A = 155 Mb/s and Rlink,B = 620 Mb/s) are slightly smaller than for the HoL system (with Rlink,A = 34 Mb/s and Rlink,B = 155 Mb/s). 100
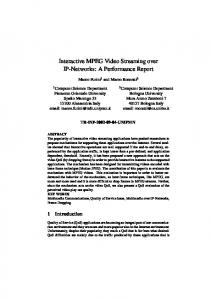
Fig. 5 Equi-busy period (in ms) curves for HoL (Rlink,A = 34 Mb/s, Rlink,B = 155 Mb/s, φ = 1)
90 80
number of videophones L
The disadvantage of a HoL system is that the highestpriority queue can block all other queues. That is, during the busy periods of the highest-priority queue, all queues but the highest do not get any service whatsoever. Figure 5 gives the (1-P)-quantile of the busy periods of the real-time queue (in one access node) for the case considered in Figure 2, i.e., for Rlink,A = 34 Mb/s, Rlink,B = 155 Mb/s, φ = 1 and P = 10-5. It can be seen that even for a small number of real-time users simultaneously active (e.g. K + L = 200) the other queues can be blocked for several ms. This may seriously degrade the performance of the traffic directed to these queues.
The queuing system with WFQ scheduling
70
10 15
8 7
60
9
20
6
4 50
5 40
3
30 2 20 10 1 0 0
50
100
150
200 250 300 350 number of telephones K
400
450
500
Fig. 6 Equi-queuing delay (in ms) curves for WFQ (Rlink,A = 155 Mb/s, Rlink,B = 620 Mb/s, φ = 1, αA = αB = 0.25) With respect to our specific example, the end-to-end queuing delay equals 0.7 ms for (K, L) = (200, 0), i.e., for 200 telephony users and no videophony users. The maximum number of videophones L for which the
Proceedings of Networks 2002 (10th International Telecommunication Network Strategy and Planning Symposium), pp. 205-212, Munich (Germany), 23-27 June 2002.
queuing delay stays below 10 ms equals 55. That is, for (K, L) = (145,55), the end-to-end queuing delay equals 9.71 ms. When even more of the 200 users switch to videophony, the interactivity of the real-time services will decrease due to queuing delays larger than 10 ms, and, thus, end-to-end delays larger than 150 ms. In order to allow more videophony users onto the network without jeopardizing the interactivity of the real-time services, the weights αA and αB of the realtime queue should be increased. Figure 7 and Figure 8 show the equi-queuing delay curves for αA = αB = 0.5 and αA = αB = 0.75, respectively. The other parameters remain the same. On both figures, we also plotted the K + L = 200 line. 200 180 20 160
number of videophones L
8
15
140
7
120 3
6
100 80
10 5
2
60
9 4
40 20 0 0
1 100
200
300
400 500 600 700 number of telephones K
800
900
1000
Fig. 7 Equi-queuing delay (in ms) curves for WFQ (Rlink,A = 155 Mb/s, Rlink,B = 620 Mb/s, φ = 1, αA = αB = 0.5) 300
250
number of videophones L
8 4
200
9 7
150
10 20 15
100 1
5 3
50 6 2 0 0
200
400
600 800 1000 number of telephones K
1200
1400
1600
Fig. 8 Equi-queuing delay (in ms) curves for WFQ (Rlink,A = 155 Mb/s, Rlink,B = 620 Mb/s, φ = 1, αA = αB = 0.75) Obviously, the end-to-end queuing delays decrease for the same (K, L)-pairs as the weight associated to the real-time queue increases. In other words, the larger αA and αB, the more telephony/videophony users can be served for a fixed queuing delay value. We also observe that the larger the weights αA and αB, the larger the similarity between the corresponding WFQ figure and Figure 4 for HoL scheduling (with
the same parameters). This was to be expected, as a WFQ scheduling system with weight 1 for the highestpriority queue equals a HoL scheduling system. The latter observation can also be expressed in terms of our specific example of 200 users shifting gradually from the telephony to the videophony service. In particular, when interactivity is guaranteed, i.e., the endto-end queuing delay has to stay below 10 ms, 170 and (the total amount of) 200 videophony users can be served for αA = αB =0.5 and αA = αB =0.75, respectively.
5
Conclusions and future work
In this paper an accurate heuristic formula was used in order to assess the end-to-end delay of real-time services on an IP network. Only CBR telephony and videophony flows were considered such that the aggregate traffic could be modeled as a Poisson arrival process and, hence, the M/G/1 model could be used to model a node. We also assume that in consecutive nodes the queuing delays are statistically independent. The method presented in this paper can be used to quantitatively assess the total queuing delay, as well as the influence of the type of scheduler upon it. As such, it can be determined how many telephone and videophone users can be supported on a network, given that a certain quality needs to be guaranteed (i.e., a certain delay bound needs to be respected). Since the real-time traffic gets absolute priority in the HoL scheduler, this scheduler will either offer a smaller queuing delay than WFQ for the same amount of telephony/videophony flows or support more telephony/videophony flows within a certain delay bound. However, all other queues (e.g. the data queue) can be starved. That is, since these queues are not visited during possibly long busy periods, they see a service pattern with possibly long interruptions. This may e.g. seriously impact the TCP performance. In case of a WFQ scheduler, a minimum capacity is guaranteed to each queue. Consequently, fewer telephony/videophony flows can be accepted, as the complete link capacity is not available for real-time traffic. Also, the queuing delay is larger than in the case of HoL, although for high link rates these are still acceptable if the weights are chosen appropriately. Finally, since the other queues get a minimum guaranteed bandwidth, the real-time traffic cannot starve the other traffic. That is, the scheduler regularly serves each queue. This is favorable for the performance of TCP. We mainly focused on the performance of the realtime traffic and only indirectly studied the performance of the other traffic flows through the periods the real-time queue block the other queues. An interesting aspect for further study is to investigate the performance of the other queues (serving e.g. BV, VOD and
Proceedings of Networks 2002 (10th International Telecommunication Network Strategy and Planning Symposium), pp. 205-212, Munich (Germany), 23-27 June 2002.
TCP-controlled data) under both HoL and WFQ scheduling.
6
Literature
[1] T. Bonald, A. Proutiere, J. Roberts, “Statistical Guarantees for Streaming Flows Using Expedited Forwarding”, Proceedings of IEEE Infocom 2001, Volume 2, pp. 1104-1112, Anchorage (AK), USA, 22-26 April 2001. [2] F. Brichet, L. Massoulié, J.W. Roberts, “Stochastic Ordering and the Notion of Negligible CDV”, Proceedings of ITC’15, pp. 1433-1444, Washington, USA, June 1997. [3] M.J.C. Büchli, D. De Vleeschauwer, J. Janssen, A. Van Moffaert, G.H. Petit, “Resource Allocation and Management in DiffServ Networks for IP Telephony”, Proceedings of the 11th International Workshop on Network and Operating Systems Support for Digital Audio and Video (NOSSDAV01), pp. 33-39, Port Jefferson (NY), USA, 25-26 June 2001. [4] J. Cao, W.S. Cleveland, D. Lin, D.X. Sun, “Internet Traffic Tends To Poisson and Independent as the Load Increases”, Technical Report, Bell Labs, 2001. (http://cm.bell-labs.com/cm/ms/ departments/sia/doc/ip.poissonindependent.pdf) [5] D. De Vleeschauwer, G.H. Petit, S. Wittevrongel, B. Steyaert, H. Bruneel, “An Accurate ClosedForm Formula to Calculate the Dejittering Delay in Packetised Voice Transport”, Proceedings of the IFIP-TC6 / European Commission International Conference NETWORKING 2000, pp. 374-385, Paris, France, 14-19 May 2000. [6] J. Janssen, D. De Vleeschauwer, M. Büchli, G. H. Petit, “Assessing Voice Quality in Packet-Based Telephony”, IEEE Internet Computing, Special Issue on Internet Telephony, May/June 2002. [7] J. Janssen, D. De Vleeschauwer, M.J.C. Büchli, R.E. Kooij, “Tuning an IP-based Network Transporting Telephony and Videophony”, 9th COST 263 Technical Meeting, Namur, Belgium, 17-18 December 2001. (http://www.fokus.gmd.de/ research/cc/glone/projects/cost263/meetings/ 09-namur/techdocs/Kooij-paper.pdf) [8] L. Kleinrock, “Queueing Systems”, Vol. 1, John Wiley and Sons, New York, 1975. [9] C.P. Kruskal, M. Snir, A. Weiss, “On the Distribution of Delays in Buffered Multistage Interconnection Networks for Uniform and Nonuniform Traffic”, Proceedings of the International Conference on Parallel Processing, pp. 215-219, 1984. [10] W.-C. Lau, S.-Q. Li, “Traffic Distortion and Inter-source Cross-correlation in High-speed Integrated Networks”, Computer Networks and ISDN Systems, Vol. 29, pp. 811-830, 1997. [11] J.L. van den Bergh, C.P.H.M. Lavrijsen, D. De Vleeschauwer, “End-to-end Delays in ATM Networks: Theory and Practice”, Proceedings of the
ATM Developments '95 Conference, Rennes (France), 29-30 March 1995.