domain (e.g., watershed management). ... that provides dependable, consistent, pervasive, and inexpensive access to high-end computational ... Domain Name.
Proceedings of International Conference of Geoinformatics’2002, Nanjing, P.R. China, June, 1-3, 2002
Using Grid-Enabled Teleimmersive Spatial Decision Support Systems (TIDSS) to Visualize Uncertainty for Water Quality Protection in Agroecosystems Shaowen Wang1, David A. Bennett2, Marc P. Armstrong3, R. Rajagopal3, and Edwin Brands2 1. Department of Geography & Research Technology (RT) of Information Technology Services 2. Department of Geography 3. Department of Geography & Program in Applied Mathematical and Computational Sciences The University of Iowa Iowa City, IA 52242 {shaowen-wang | david-bennett | marc-armstrong | r-rajagopal | edwin-brands}@uiowa.edu
ABSTRACT The purpose of this paper is to examine the way Grid computing resources enable teleimmersive spatial decision support systems (TIDSS). Our intent is to construct a link between GIS software and teleimmersive visualization tools in a TIDSS context using computational grids. As motivation for this research, we consider a TIDSS designed to support the analysis of water quality measurements in an agriculture landscape. In particular, we focus on the representation and communication of uncertainty to decision makers. Quite often, the production of high quality visualizations of geographical information and the uncertainty associated with such information requires a significant amount of computation. Computational grids provide an efficient approach for meeting such requirements. Teleimmersion enabled by computational grids supports “same time, different place” collaborative interaction in spatio-temporal virtual environments. A grid-enabled teleimmersion technology is integrated within desktop GIS software through common data formats (e.g., virtual reality modeling language). Such integration results in a TIDSS that helps decision makers investigate uncertainty using high quality visualization tools while they explore issues in water quality protection.
1 INTRODUCTION The Midwestern region of the United States is one of the most agriculturally productive areas of the world. While the use of synthetic chemicals such as herbicides, insecticides, and fertilizers has contributed greatly to the agricultural productivity of this region, non-point source runoff associated with agrichemicals has degraded both surface and ground water quality. Our research project “Water Quality Protection in Agroecosystems - Integrating Science, Technology, and Policy” is designed to link significant scientific concepts and technological ideas (e.g., spatial decision support systems (SDSS) and visualization tools) to public policy. Specifically, elected officials will use the spatial analytical and visualization tools that we develop to access scientific data and apply the knowledge gained from this process to actions that are designed to protect and enhance water quality in agroecosystems (Rajagopal, et al., 2001). SDSS extends the utility of GIS software by customizing software environments for use within a particular problem domain (e.g., watershed management). Though there are numerous examples of how SDSS can be used in the context of watershed management (e.g., Bennett and Vitale, 2002), our focus is on the development of teleimmersive visualization tools that are coupled to geo-processing software through a common data format (i.e., virtual reality modeling language (VRML)) to create a teleimmersive SDSS (TIDSS). This TIDSS will allow officials to explore uncertainty in water quality within the Des Moines and Iowa River watersheds and to evaluate the performance of place-based monitoring strategies (PBMS) (U.S. Environmental Protection Agency, 1997).
1
Proceedings of International Conference of Geoinformatics’2002, Nanjing, P.R. China, June, 1-3, 2002
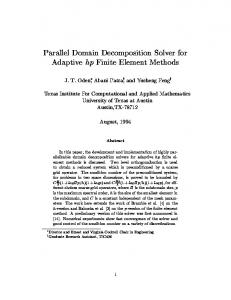
In a TIDSS, GIS software and teleimmersive visualization tools are complementary because GIS software is needed to conduct spatial analysis while teleimmersion is used to illustrate and evaluate key issues related to high dimensional information. A smooth link between GIS and teleimmersive visualization tools is essential if SDSS is to be enhanced with visualization and exploration utilities. To develop this level of interoperability between existing GIS software and teleimmersive visualization tools, moreover, presents a significant challenge. VRML among other 3D data standards1, offers one avenue for the construction of such link. The application of VRML approach is, however, impeded by two shortcomings of VRML (Fisher and Unwin, 2002). The first problem is that VRML files contain a significant amount of redundant information; this hinders rapid data transfer and increases rendering times. The second problem is that VRML only encodes data in vector format, so raster based GIS applications are not directly supported. In our system, only the information that is needed to support visual analysis is extracted from the VRML data for real-time rendering and rapid data transfer. The extracted information is used to create a raster index (Figure 1) for the original VRML data. This raster index is used by TIDSS in three ways: 1) it supports access to specific subsets of VRML data that are of interest to users in the visualization process; 2) it increases access speed to those particular parts of VRML data; and 3) it supports the visualization of raster-based geo-spatial data. The process of creating a raster index is computationally intensive, especially when large VRML data files are processed and high resolution raster data sets must be supported. Because of this computational issue, Grid computing resources are used to compute the raster indices and support real-time immersive visualization within a TIDSS.
2 GRID COMPUTING ENVIRONMENT Using an analogy of the electric power grid, a computational grid is defined as the hardware and software infrastructure that provides dependable, consistent, pervasive, and inexpensive access to high-end computational capabilities (Foster and Kesselman, 1999). In the U.S., the National Aeronautics and Space Administration (NASA), the National Science Foundation (NSF), and the Department of Energy (DOE) have already launched major grid initiatives2. The Grid computing resources used in this research were made available through the National Computational Science Alliance (NCSA) Grid-in-a-Box (GiB)3 testbed. 2.1 Grid-in-a-Box (GiB) testbed The GiB testbed is built by NCSA to facilitate development and deployment of Grid-enabled applications. Currently the GiB testbed is comprised of multiple sites of NCSA partners for advanced computational services (PACS) that have Linux (RedHat 7.1) operating system installed. The Globus Toolkit 2.04 provides Grid services and protocols. Table 1 lists the hardware configuration of the GiB sites. A local Linux node was connected with the GiB testbed using the Globus Toolkit 2.0. Table 1. GiB hardware environment
Domain Name gib01.bu.edu rtgrid1.its.uiowa.edu gibhead.ccs.uky.edu conshead.ncsa.uiuc.edu cornhead.ncsa.uiuc.edu gib.ovl.osc.edu biron.cs.wisc.edu
PBS CPUs 4 1 8 4 8 4 1
Cluster CPU Speed 866MHz (Pentium III) 1300MHZ (Pentium IV) 1000MHz (Pentium III) 300MHz (Pentium II) 300MHz (Pentium II) 498MHz (Pentium III) 996MHz (Pentium III)
Organization Boston University The University of Iowa University of Kentucky NCSA NCSA Ohio State University University of Wisconsin
2.2 Globus Toolkit We use the Globus Toolkit (GT) in this research to access Grid resources in the GiB testbed. GT, a product of the Globus project5 (Grimshaw et al., 1998), comprises a set of modules that include resource location and allocation, 1
http://www.multigen.com/ http://www.gridforum.org 3 http://www.ncsa.uiuc.edu/TechFocus/Deployment/GiB/ 4 http://www.globus.org/gt2/ 5 http://www.globus.org 2
2
Proceedings of International Conference of Geoinformatics’2002, Nanjing, P.R. China, June, 1-3, 2002
communication, unified resource information service, authentication interface, process creation, and data access modules (Foster and Kesselman, 1997). These modules are designed to support a wide variety of applications and programming models, and are organized in a “bag of services” fashion. This “bag of services” approach to the development of Grid middleware does not impose any single programming paradigm such as the object-oriented model defined by the Legion system (Grimshaw et al., 1998). In this research, we place a specific emphasis on the use of the resource allocation module.
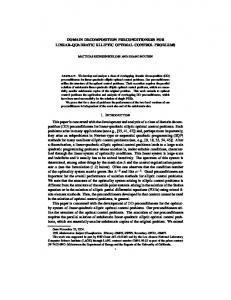
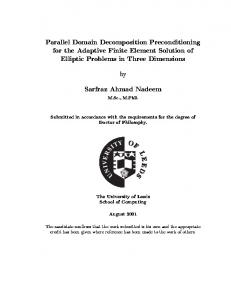
3 TELEIMMERSIVE SDSS (TIDSS) TIDSS has powerful advantages over current SDSS practices. Immersion enables researchers to view relationships in mapped data and model output that would otherwise remain shrouded by the limitations of widely used graphics technologies (Openshaw and Fisher, 1995). The ‘tele’ prefix (to yield teleimmersion) specifies distant synchronous communication using various network technologies, comprised of both hardware and software. Intuitively, when teleimmersion is used in a SDSS context, decision makers are able to collaborate in a geographically distributed and synchronous manner. 3.1 TIDSS architecture The TIDSS is developed using the LIVE (Laboratory for Immersive Visualization for the Environment) facility established in 1998-1999 at The University of Iowa with NASA support. This front-end system includes ImmersaDesks6 (IDesk) and 3D PC desktop systems7. TIDSS software components are classified into several hierachical layers (Figure 2). The TIDSS architecture (Figure 3) is based on the “bag of services” concept in an open grid services architecture (OGSA) (Foster et al., 2002). The TIDSS resource broker is developed to assign heterogeneous computational resources to support the link between GIS software (e.g, used for uncertainty analysis) and teleimmersive visualization tools. Globus TCP API is used to develop groupware that allows users to see and interact with each other using avatar representations (Wang and Armstrong, 2001). TIDSS is also linked to ArcGIS 8.1 software through data import/export utilities that include a VRML transfer function. 3.2 Computational resource allocation in TIDSS The Globus resource specification language (RSL) provides a common interchange language that is used to describe computational resources. The various components of the Globus resource management architecture (Figure 4) manipulate RSL strings to perform resource management functions in cooperation with the other system components.8 The Globus resource allocation manager (GRAM) provides a standardized interface to the local resource management tools at particular sites within the Grid. In this paper, a portable batch system (PBS) (Czajkowski et al., 1998) is used to manage (e.g., queue and run) visualization sub-jobs that are submitted through GT tools. The dynamically-updated request online coallocator (DUROC) coordinates a request that may span multiple GRAMs. DUROC is used to schedule the computation (Wang and Armstrong, 2002) required to create a raster index for VRML data. An example of an RSL script is shown in Figure 5. The GT command line tool globusrun is used to submit jobs to Globus-managed resources. This tool uses the RSL script as input, and conducts the specified computing tasks. 3.3 Creation of raster indices for VRML We developed an algorithm called SplitToRaster (Figure 6) to implement interoperability between GIS software and visualization tools. This algorithm maps VRML polygonal information to a raster format at a user specified resolution; it also calculates the slope of each raster cell. This algorithm has computation complexity of O(n3). To manage the computational demand associated with the creation of raster indices, the GiB computational resources are used through DUROC protocol provided by GT. These distributed resources can help achieve real-time computation of SplitToRaster algorithm. For example, to generate a ten by ten raster index for a 10 Megabyte VRML can be finished within 2 seconds. Whereas, without GiB resources, the computation would take 61 seconds using a SGI workstation (Octane 195MHZ MIPS R10000 CPU).
6
http://www.fakespacesystems.com http://www.demensional.com/ 8 http://www-fp.globus.org/gram/rsl_spec1.html 7
3
Proceedings of International Conference of Geoinformatics’2002, Nanjing, P.R. China, June, 1-3, 2002
4 VISUALIZATION OF UNCERTAINTY IN TIDSS The visualization of uncertainty in TIDSS uses a spatial-temporal virtual environment framework (Howard and MacEcheran, 1996). TIDSS also integrates Grid computing resources to support real-time visualization and computationally intensive spatial analysis. The communication of uncertainty to decision-makers in TIDSS is implemented through the interaction of avatars that represent decision-makers. This communication strategy aims to remove the “conceptual bottleneck” (Armstrong and Densham, 1995) that impedes the use and dissemination of mapped spatial information among non-specialists. 4.1 Definition of uncertainty Uncertainty (Unwin, 1995) is a concept that is related to variability, reliability (MacEachren, 1995), error (Heuvelink, 1998), and data quality (Moellering, 1987) in spatial and temporal measurement. In this paper, we consider the specific types of uncertainty that are related to water quality monitoring programs, and construct a 3D representation of uncertainty within a TIDSS. The selected mechanisms for the visual representation of uncertainty include: glyphs (Pang et al., 1997) and animation (Ehlschlaeger et al., 1997). 4.2 Representation of uncertainty Uncertainty is introduced from the following sources in our water quality protection project: 1) measurement error in water quality monitoring and spatio-temporal variability in the natural environment, 2) the propagation of uncertainty through GIS operations, and 3) embedded uncertainty in spatial datasets downloaded from public domain repositories. In this paper, glyphs and animation are used to represent uncertainty from source 3), while uncertainty from sources 1) and 2) are left for future research. Glyphs (also referred to as icons) are graphical entities that convey one or more data values via attributes such as shape, size, color, and position (Wittenbrink, et al., 1996). Figure 7 shows an example of uncertainty representation using glyphs. The height of each glyph bar is determined by actual measurement of a water quality parameter. The hue of each glyph indicates the type of these measured water quality parameters (e.g., atrazine and nitrate). The brightness (light to dark) of glyph represents the uncertainty (lowest to highest) of measured values. The lighter a glyph bar is, the more certain we are about the associated value. And a transfer function can be defined to characterize the relationship between the lightness of glyph bars and the uncertainty of measured values. Animation is used to depict the temporal variability of the measured water quality parameters.
5 CONCLUDING DISCUSSION Using a set of software tools, we are able to assemble the heterogeneous computational resources of the Grid in a seamless way, enabling geographers to conduct computationally intensive visualization studies (e.g., uncertainty visualization). TIDSS, driven by the computational power of the Grid, provides a suitable workbench that supports real-time collaborative visualization. In a TIDSS, an efficient link to support visual analysis between GIS software and teleimmersive visualization tools was built by creating raster indices for VRML data using GiB computational resources. In future research, user studies will be designed to demonstrate whether the association of uncertainty with a realistic 3D landscape in a TIDSS can be used to communicate uncertainty to decision-makers effectively in our water quality protection project.
ACKNOWLEDGMENTS We thank The University of Iowa and the U.S. Department of Agriculture for funding this research. Although the research in this paper has been funded wholly or in part by the U. S. Department of Agriculture through the Award# 2001-51130-11373 (Water Quality Protection in Agroecosystems) to the University of Iowa, it has not been subjected to agency review and does not necessarily reflect the views of the agency. Therefore, no official endorsement should be inferred.
REFERENCE Armstrong, M.P., 2000, Geography and computational science, Annals of the Association of American Geographers, 90 (1): 146-156. Armstrong, M. P. and Densham, P. J., 1995, GIS and group decision-making: a look at the dark side, Proceedings of GIS/LIS’95, Nashville, Tennessee, American Congress on Surveying and Mapping, Washington, D.C., 1119.
4
Proceedings of International Conference of Geoinformatics’2002, Nanjing, P.R. China, June, 1-3, 2002
Bennett, D. A. and Vitale, A., 2002, Evaluating non-point pollution policy using a loosely coupled SDSS, Environmental Management, accepted. Czajkowski, K., Foster, I., Kesselman, C., Karonis, N., Martin, S., Smith, W., and Tuecke, S., 1998, A resource management architecture for metacomputing systems, In Proceeding of IPPS/SPDP'98 Workshop on Job 9 Scheduling Strategies for Parallel Processing. Ehlschlaeger, C. R., Shortridge, A. M., and Goodchild, M. F., 1997, Visualizing spatial data uncertainty using animation, Computers & Geosciences, 23(4), 387-395. Fisher, P. and Unwin, D., 2002, Virtual Reality in Geography, page 113, Taylor & Francis, London and New York. Foster, I. and Kesselman, C., 1997, Globus: A metacomputing infrastructure toolkit, International Journal of Supercomputing Applications and High Performance Computing, 1997, 11(2), 115-128. Foster, I. and Kesselman, C., 1998, The Globus project: A status report, 7th IEEE Heterogeneous Computing Workshop (HCW '98), March, 1998, 4-18. Foster, I. and Kesselman, C., 1999, The Grid: Blueprint for a New Computing Infrastructure, Morgan Kaufman, San Francisco, CA. Foster, I., Kesselman, C., and Tuecke, S., 2001, The anatomy of the grid: enabling scalable virtual organizations, International Journal of Supercomputer Applications, 15(3), 200-222. Foster, I., Kesselman, C., Nick, J., and Tuecke, S., 2002, The physiology of the grid: An open grid services architecture for distributed systems integration.10 Grimshaw, A., Ferrari, A., Lindahl, G., and Holcomb, K., 1998, Metasystems, Communications of the ACM, 1998, 41(11), 46-55. Heuvelink, G. B. M., 1998, Error Propagation in Environmental Modeling, Taylor and Francis, Bristol. Howard, D. and MacEachren, A., 1996, Interface design for geographic visualization: Tools for representing reliability, Cartography and Geographic Information Systems, 23(2):59-77. MacEachren, A. M., 1995, How Maps Work: Representation, Visualization, and Design, page 513, The Guilford Press, New York. Moellering, H. (ed.), 1987, A Draft Proposed Standard for Digital Cartographic Data, National Committee for Digital Cartographic Data Standards, Columbus, Ohio. Openshaw, S. and Fisher, M. M., 1995, A framework for research on spatial analysis relevant to geo-statistical information systems in Europe, Geographical Systems, 2(4), 325-338. Pang, A., Wittenbrink, C. M., and Lodha, S. K., 1997, Approaches to uncertainty visualization, The Visual Computer, 13(8), 370-390. Rajagopal, R., Bennett, D. A., Brands, E., and Osterberg, D., 2001, Water Quality Protection in Agroecosystems: Integrating Science, Technology, and Policy, Proposal submitted to and funded by the U. S. Department of Agriculture. Unwin, D. J., 1995, Geographical information systems and the problem of “error and uncertainty”, Progress in Human Geography, 19(4), 549-558. U.S. Environmental Protection Agency, 1997, Performance based measurement system, Federal Register 6, October, 62(193): 52098-52105. Van Der Wel, F. J. M., Van Der Gaag, L. C., and Gorte, B. G. H., 1998, Visual exploration of uncertainty in remote sensing classification, Computer and Geosciences, 24(4), 335-343. Wang, S. and Armstrong, M. P., 2001, Development and evaluation of a teleimmersion framework for collaborative spatial decision-making, Paper presented at The Association of American Geographers 97th Annual Meeting 1-5 March 2001, New York, NY. Wang, S. and Armstrong, M. P., 2002, Domain decomposition for spatial interpolation in grid computing environments, Parallel Computing - Special issue on HPC with Geographical Data (abstract accepted). Wittenbrink, C., Pang, A., and Lodha, S., 1996, Glyphs for visualizing uncertainty in vector fields, IEEE Transanctions on Visualization and Computer Graphics, 2(3), 266-279.
9
ftp://ftp.globus.org/pub/globus/papers/gram97.pdf http://www.globus.org/research/papers/ogsa.pdf
10
5
Proceedings of International Conference of Geoinformatics’2002, Nanjing, P.R. China, June, 1-3, 2002
Figures
Figure 1. A ten by ten raster index is created for a VRML data, an avatar (a user’s hand) is displayed on top of the VRML represented landscape
6
Proceedings of International Conference of Geoinformatics’2002, Nanjing, P.R. China, June, 1-3, 2002
http://www.fakespacesystems.com/
Shared virtual space
IDesk
TIDSS Teleimmersion Groupware
IDesk
http://www.stereovision.net/
Application specific middleware (e.g., resource broker)
Desktop 3D Graphics Environment
Grid network protocols Grid hardware infrastructure --- high-speed and reliable network
Two users’ interaction in a prototype TIDSS (Wang and Armstrong, 2001)
Desktop GIS Software (e.g., ArcGIS 8.1)
Figure 2. A prototype TIDSS
TIDSS
TIDSS resource broker TIDSS resource broker
Globus Data Import/Export Utilities
Desktop GIS Software
MDS1
Data Transfer (e.g., GridFtp)
DUROC2
TCP API
Uncertainty Analysis Tools 1.
2.
Groupware
TIDSS Resource Broker
Immersive Visualization
MDS: Metacomputing Directory Service DUROC: Dynamically-Updated Request Online Coallocator Figure 3. A TIDSS architecture
7
Proceedings of International Conference of Geoinformatics’2002, Nanjing, P.R. China, June, 1-3, 2002
TIDSS
Broker Assign resources to computational tasks
DUROC
GRAM
PBS Figure 4. Computational resource management architecture in this study
+ ( & (resourceManagerContact="gibhead.ccs.uky.edu") (hostCount=1) (jobtype=single) (label="subjob 0") (environment= (GLOBUS_DUROC_SUBJOB_INDEX 0) (GLOBUS_TCP_PORT_RANGE "3000,3090") ) (directory=/home/shawang/RasterVRML/) (executable=/home/shawang/RasterVRML/RasterVRML) (auguments="