materials Review
Toughening Mechanisms in Nanolayered MAX Phase Ceramics—A Review Xinhua Chen 1 and Guoping Bei 2, * 1 2
*
School of Mechanical Electronic and Automobile Engineering, Beijing University of Civil Engineering and Architecture, Beijing 100044, China;
[email protected] Department of Materials Science and Engineering, 3ME, Delft University of Technology, Mekelweg 2, 2628CD Delft, The Netherlands Correspondence:
[email protected]; Tel.: +31-15-27-85954
Academic Editor: Jérôme Chevalier Received: 23 February 2017; Accepted: 23 March 2017; Published: 30 March 2017
Abstract: Advanced engineering and functional ceramics are sensitive to damage cracks, which delay the wide applications of these materials in various fields. Ceramic composites with enhanced fracture toughness may trigger a paradigm for design and application of the brittle components. This paper reviews the toughening mechanisms for the nanolayered MAX phase ceramics. The main toughening mechanisms for these ternary compounds were controlled by particle toughening, phase-transformation toughening and fiber-reinforced toughening, as well as texture toughening. Based on the various toughening mechanisms in MAX phase, models of SiC particles and fibers toughening Ti3 SiC2 are established to predict and explain the toughening mechanisms. The modeling work provides insights and guidance to fabricate MAX phase-related composites with optimized microstructures in order to achieve the desired mechanical properties required for harsh application environments. Keywords: cracks; toughening mechanism; MAX phase; finite element model
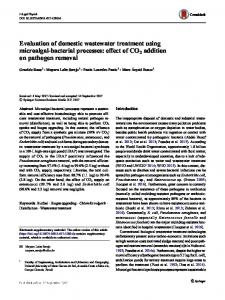
1. Introduction Conventional ceramic materials mainly include glasses, structural clay products, whitewares, refractories, abrasives, cement and the newly developed advanced ceramics. Ceramic materials offer many distinct advantages such as excellent corrosion, wear resistance, high hardness and stiffness, chemical inertness, high-temperature characteristics as well as low density, which make them attractive for applications such as industries [1–4], medical [5], fuel constituents [6,7] and daily life [8], ranging in size scale from micro-electromechanical systems through large aerospace components. However, ceramic materials are severely limited in various fields of human activities by their mechanical properties [9–11]. The Achilles heel of ceramic materials is the low reliability, which is given by the disposition of inherent brittleness to catastrophic fracture with very low energy absorption. One of the macroscopic properties that characterizes this disposition of a ceramic is the fracture toughness (KIC ) which is the resistance of ceramics to incipient cracking or defect generation and the microstructural mechanisms that are the source of such resistance [1]. The fracture toughness can be strongly influenced by microstructure or by the using of various reinforcements. There are two fundamentally different approaches: flaw control and toughening [12]. The toughening mechanisms have been well documented and can be conveniently considered to involve either intrinsic toughening mechanisms or extrinsic toughening mechanisms (Figure 1) [13]. The intrinsic toughening is an inherent property of the material, which is induced essentially from plasticity and enhances a material’s inherent damage resistance. Thus, it is active irrespective of crack size and geometry. The intrinsic toughening is the primary source of fracture resistance in ductile materials [13]. In contrast, most structural Materials 2017, 10, 366; doi:10.3390/ma10040366
www.mdpi.com/journal/materials
Materials 2017, 10, 366
2 of 12
ceramics are essentially impossible to be tough intrinsically due to the absence of mobile dislocation activity [13,14] and the extrinsic toughening is the primary source of toughening in ceramics which act primarily behind the tip to impede crack advance. Extrinsic toughening acts to lower the local stress and strain fields at the crack tip without the inherent fracture resistance of the material changed; as it depends on the presence of a crack, it affects only the crack-growth toughness, specifically through the generation of a rising R-curve [13]. So far, a number of extrinsic toughening methods have been developed: transformation toughening, dispersed ductile/brittle particle toughening (microcracking toughening), fiber/lamella bridge toughening [15], whisker toughening [16], the frictional interlocking of grains during intergranular fracture in monolithic ceramics and complex structure toughening etc. Intergranular fracture is generally an essential requirement here for the operation of these mechanisms.
1 Figure 1. Schematic illustrating both intrinsic and extrinsic mechanisms of toughening mechanisms associated with crack extension [13].
MAX phases are a group of new nanolayered ceramics with a general composition of Mn+1 AXn [17–22] where M is an early transition metal, A is IIIA or IVA element, and X = C or N (n = 1~7). Until now, more than 50 M2 AX phases (Ti2 AlC, Cr2 AlC, Ti2 SnC etc.), 6 M3 AX2 phases (Ti3 SiC2 , Ti3 AlC2 etc.) and 8 M4 AX3 phases (Ti4 AlN3 , Nb4 AlC3 , etc.) have been discovered and investigated along with many possible solid solution permutations and combinations [18]. In the unit cell of MAX phase, the M and X atoms form two common edges, M6 X tetrahedron with the stronger covalent bond which is separated by A atomic planes, and the link between A atomic planes and M6 X tetrahedron is weaker due to the M–A metallic bond. Due to such unique nanolaminated structure, the MAX phases are able to combine metal and ceramic materials demonstrating high thermal and electrical conductivities, excellent machinability and high-temperature oxidation resistance. Recently, MAX phases have attracted much attention due to their special qualities and potential applications in sensors, radiation hardened in nuclear energy and electrochemical energy storage systems [18–21]. In this content, enhancement of the reliability of these nanolayered MAX phases with desired mechanical properties becomes critical. The present work gives a critical review of toughening mechanisms for the nanolayered MAX phases. Based on the present toughening work for MAX phases, microstructure-based models were established for a better understanding of the toughening mechanisms of these ceramics with nanolayered structures. Finally, an outlook of future directions for the toughening of these nanolayered ceramics is also provided.
Materials 2017, 10, 366
2. Toughening in Nanolayered MAX Phases Materials 2017, 10, 366
3 of 12
3 of 12
The fascinating MAX phase ceramics have gained increasing attention due to their fruitful 2. Toughening in Nanolayered MAX Phases potential applications in industry. Great efforts have been made to investigate the fracture fascinating MAX phase ceramics have[23]. gained attention due to their fruitful toughnessThe and its enhancement of MAX phases Theincreasing toughening mechanisms in MAX phases potential applications in industry. Great efforts have been made to investigate the fracture toughness can be categorized into four basic types: particle toughening, phase-transformation toughening, and its enhancement of MAX phases [23]. The toughening mechanisms in MAX phases can be fiber-reinforced toughening, and texture toughening. categorized into four basic types: particle toughening, phase-transformation toughening, fiber-reinforced toughening, and texture toughening. 2.1. Particle Toughening
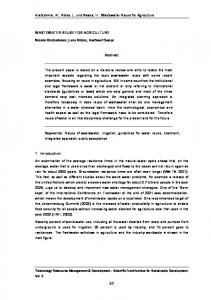
2.1. Particle The particleToughening toughening is a general concept that refers to impending crack growth by dispersion particles such as TiC toughening [24], Al2 O3 is[25], ZrC [26], BN [27,28] and to carbon nanotubes The particle a general concept that refers impending crack (CNTs) growth [29] by etc. Unfortunately, these brittle can the toughness of MAX dispersion particles such asparticle TiC [24],reinforcements Al2O3 [25], ZrC [26], BNmodestly [27,28] andenhance carbon nanotubes (CNTs) [29] phases to lack of these plasticity ceramic particles, and the mostenhance common toughening etc.due Unfortunately, brittleof particle reinforcements can modestly the activated toughness of MAX phases due lackdeflection of plasticity of crack ceramic particles, and the most common activated toughening mechanisms are to crack and bridging. mechanisms are crack deflection and crack bridging. ZrC particles-reinforced Ti3 AlC2 composites were obtained by in situ reactive hot-pressing at ZrC particles-reinforced Ti3AlC 2 composites were obtained by in situ reactive hot-pressing at 1500 ◦ C under a pressure of 30 MPa for 2 h in Ar using Ti, Al, graphite and ZrC powders as starting 1500 °C under a pressure of 30 MPa for 2 h in Ar using Ti, Al, graphite and ZrC powders as starting materials [26], and the fracture toughness of 20 vol % ZrC/Ti3 AlC2 composite could reach up to materials [26], and the fracture toughness of 20 vol % ZrC/Ti3AlC2 composite could reach up to 1/2 11.5 ± 1.0 MPa·m1/2 while the fracture toughness of monolithic Ti3 AlC2 was 7.8 ± 0.4 MPa ·m . 11.5 ± 1.0 MPa·m1/2 while the fracture toughness of monolithic Ti3AlC 2 was 7.8 ± 0.4 MPa·m1/2. As shown in Figure 2, the fracture toughness improvement could be ascribed to energy consuming by As shown in Figure 2, the fracture toughness improvement could be ascribed to energy consuming ZrC particles and residual stresses in theinZrC/Ti derived from the cooling process in 3 AlC 2 composite by ZrC particles and residual stresses the ZrC/Ti 3AlC 2 composite derived from the cooling process the composite preparation. in the composite preparation.
Figure 2. SEM micrographs of the fracture surface of the 20 vol % ZrC/Ti3AlC2 composite.
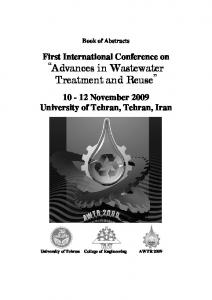
Figure 2. SEM micrographs of the fracture surface of the 20 vol % ZrC/Ti3 AlC2 composite. (a) Interface (a) Interface between Ti3AlC2 and Zr, the inset: Backscattering image of area pointed with the white between TiThe Zr,and the“Z” inset: Backscattering of area pointed with the white arrow; 3 AlC 2 and“T”, ZrC, respectively; (b) A crack crossing through arrow; Letters represent Ti3AlC2, and image The Letters “T”, and andZrC “Z”particle represent Ti3AlC2 grain [26]. Ti3 AlC2 , and ZrC, respectively; (b) A crack crossing through Ti3 AlC2 grain and ZrC particle [26]. A (TiB2 + TiC)/Ti3SiC2 composite with higher fracture toughness was obtained by hot-pressing at 1500 under a pressure of 25 MPa for 2 h in Ar atmosphere by applying TiH2, Si, graphite and A (TiB2 °C + TiC)/Ti 3 SiC2 composite with higher fracture toughness was obtained by hot-pressing at B 4C powders as starting materials [24]. The microstructures of the (TiB2 + TiC)/Ti3SiC2 composites ◦ 1500 C under a pressure of 25 MPa for 2 h in Ar atmosphere by applying TiH2 , Si, graphite and B4 C (10 vol % TiB2) characterized by high-resolution transmission electron microscope (HRTEM) powders as starting materials [24]. The microstructures of the (TiB2 + TiC)/Ti3 SiC2 composites (10 vol % demonstrated clean and clear grain boundaries between the Ti3SiC2 matrix and reinforcements TiB2 ) characterized by high-resolution transmission electron microscope (HRTEM) demonstrated (Figure 3a,b). The fracture toughness of the as-prepared composites was higher than the pure Ti3SiC2 cleanceramic and clear grainTiboundaries between the Ti3 SiC and reinforcements (Figure 3a,b). 2 matrix and other 3SiC2-matrix composites [30]. The fracture toughness of the (TiB2 + TiC)/Ti 3SiC2 The fracture toughness of the as-prepared composites was higher than the pure Ti SiC ceramic 1/2 3 2 composites increased from about 9 MPa·m for the composites with 5 vol % TiB2 reinforcements to and 1/2 forcomposites other9.55 Ti3 SiC [30]. fracture toughness of the (TiB2 +further TiC)/Ti MPa·m the one with 10 The vol % TiB2 reinforcements. However, increasing TiB2 2 -matrix 3 SiC2 composites volume content up9 to 20 vol % resulted in a reduction of the fracture of the composites [24]. increased from about MPa ·m1/2 for the composites with 5 vol % TiBtoughness reinforcements to 9.55 MPa ·m1/2 2 The improvement toughness ofHowever, the composites was due to theTiB very close interatomic for the one with 10 volof%the TiBfracture further increasing content up to 2 reinforcements. 2 volume distance of close-packed plane of atoms for TiB 2 (0.3028 nm) and TiC (0.3055 nm), resulting in a 20 vol % resulted in a reduction of the fracture toughness of the composites [24]. The improvement of coherent interface with strong binding energy (Figure 3c), which would lead to transgranular the fracture toughness of the composites was due to the very close interatomic distance of close-packed fracture and increase fracture energy as well as the residual compressive stress caused by the plane of atoms for TiB2 (0.3028 nm) and TiC (0.3055 nm), resulting in a coherent interface with strong thermal expansion coefficient mismatch, which could increase the crack propagation resistance [24].
binding energy (Figure 3c), which would lead to transgranular fracture and increase fracture energy as well as the residual compressive stress caused by the thermal expansion coefficient mismatch, which could increase the crack propagation resistance [24].
Materials 2017, 10, 366 Materials 2017, 10, 366
4 of 12 4 of 12
Materials 2017, 10, 366
4 of 12
Figure 3. (a) TEM micrograph of the (TiB2+TiC)/Ti3SiC2 composite with 10 vol % TiB2; (b) HRTEM
Figure 3. image (a) TEM micrograph of for theTi(TiB +TiC)/Ti3 SiC 10 vol % TiB (b)2 HRTEM 2 composite 3SiC22 and TiC; (c) HRTEM image of with interface structure for2 ;TiB of interface structure image of and interface structure for Ti3 SiC2 and TiC; (c) HRTEM image of interface structure for TiB2 and TiC [24]. TiC [24].
2.2.
2.2. WhiskerFigure 3. (a) and TEMFiber-Reinforced micrograph ofToughening the (TiB2+TiC)/Ti3SiC2 composite with 10 vol % TiB2; (b) HRTEM 3SiC2 and TiC; (c) HRTEM image of interface structure for TiB2 imageInofthe interface structure for Ti whisker- and fiber-reinforced Whisker- and Fiber-Reinforced Toughening ceramic composites, the reinforcements could provide a and TiC [24]. ceramic matrix with large strains before failure and maintain themselves intact. However, limited
In the whiskerfiber-reinforced composites, the could provide a work has beenand performed to investigateceramic the toughening behaviors of reinforcements fiber- or whisker-reinforced
2.2. Whiskerand Fiber-Reinforced Toughening MAX phases due to the high reactivity and MAX phase matrix. Most of the work limited ceramic matrix with large strains before between failure the andfibers maintain themselves intact. However, focused on the fabrication of the whisker or fiber/MAX phase composites and the main fibers a MAX the performed whisker- and composites, the of reinforcements could provide work hasIn been to fiber-reinforced investigate the ceramic toughening behaviors fiber- or whisker-reinforced include SiC fiber [31–33], carbon fiber [34] and Al2O3 fiber [35,36]. ceramic matrix withreactivity large strains beforethe failure and maintain themselves intact. However, limited phases due to the high between fibers and MAX phase matrix. Most of the work focused The reactivity of Ti2AlC or Ti3SiC2 powders with uncoated SiC fibers at the temperature up to work has been performed to investigate the toughening behaviors of fiberor whisker-reinforced on the fabrication of the whisker or fiber/MAX phase composites and the main fibers include SiC 1550 °C were evaluated [31]. The results indicated that the uncoated SiC fibers could be used as phases due to high reactivity between the fiberstoand MAX phase matrix. Most of the work reinforcement inthe Ti3SiC 2 but not Ti 2 AlC, attributing the reactivity that no apparent reaction fiberMAX [31–33], carbon fiber [34] and Alin O fiber [35,36]. 2 3 focused on the fabrication of the whisker or fiber/MAX phase composites and the main fibers between 3SiC2 and SiC fibers, while Ti2AlC could react with SiC fibers to form The occurred reactivity of Ti2TiAlC or Ti3 SiC2 powders with uncoated SiC fibers at the temperature include SiC1−xfiber carbon fiber [34] and 2O3 fiber Ti3(Al Six)C2[31–33], , TiC and Al1+xTi 1−x alloy. To Al reduce the[35,36]. reaction between the SiC fibers and up to 1550 ◦ C were evaluated [31]. The results indicated that the uncoated SiC fibers could be The reactivity of Ti 2 AlC or Ti 3 SiC 2 powders with uncoated at the up to Al-contained MAX phase, a Ti barrier layer was applied betweenSiC thefibers SiC fibers andtemperature Ti3AlC2 which used1550 as reinforcement in Ti[31]. notdiffusion in Ti2 AlC, attributing the reactivity that no 3 SiC 2 but could effectively hinder the inward of that Al from the Tito 3AlC 2 matrix In used theapparent °C were evaluated The results indicated the uncoated SiC fibers [32,33]. could be as reaction occurred Ti SiCin and SiC fibers, while AlC could react with SiC f/Ti3AlCin 2 between composites prepared and 1300 °C, only of that Ti5(Al,Si) 3 alloy andSiC TiC, fibers to 3not 2 at 2phases reinforcement Ti3SiC2 but Ti1250 2AlC, attributing to minor theTireactivity no apparent reaction as well Ti22AlC were detected to the monolithic Ti 3AlC2the bulk, formoccurred Ti3 (Al , Ti TiC and Al1+x alloy. ToCompared reduce the reaction between SiC fibers 3SiC 2 and SiCTias while Ti 2AlC could react with SiC fibers tothe form and x )C 1−between x Sias 1fibers, −xinterfaces. load-displacement curves of as-prepared composites showed a noncatastrophic failure and a Ti3(Al1−xSixMAX )C2, TiC and aAl Ti1−x alloy. reduce the between reaction the between the SiC and Al-contained phase, Ti1+xbarrier layerTowas applied SiC fibers and fibers Ti3 AlC 2 which step-like fracture model was observed in the fracture surfaces using a field emission scanning electron MAX phase, a Ti barrier layerof was applied between the SiC fibers andIn Tithe 3AlC 2 which couldAl-contained effectively hinder the inward diffusion Al from the Ti AlC matrix [32,33]. SiC /Ti 3 2 3 AlC2 f microscope (FE-SEM, Figure 4) which indicated an improvement of the toughness [32]. could effectively diffusion of Alphases from the 3AlC2 matrix [32,33]. In the composites prepared hinder at 1250the andinward 1300 ◦ C, only minor of TiTi5 (Al,Si) alloy and TiC, as well as 3 SiC f/Ti3AlC2 composites prepared at 1250 and 1300 °C, only minor phases of Ti5(Al,Si)3 alloy and TiC, Ti2 AlC were detected as interfaces. Compared to the monolithic Ti3 AlC2 bulk, the load-displacement as well as Ti2AlC were detected as interfaces. Compared to the monolithic Ti3AlC2 bulk, the curves of as-prepared composites showed a noncatastrophic failure and a step-like fracture model load-displacement curves of as-prepared composites showed a noncatastrophic failure and a was observed in the fracture surfaces using a field emission scanning electron microscope (FE-SEM, step-like fracture model was observed in the fracture surfaces using a field emission scanning electron Figure 4) which(FE-SEM, indicated an improvement of the toughness [32]. microscope Figure 4) which indicated an improvement of the toughness [32].
Figure 4. FE-SEM images of the fracture surfaces of (a,c) composites prepared at 1250 °C and (b,d) composites prepared at 1300 °C; the images show a step-like fracture model (a,b) and multiple transversal cracks in the matrix (c,d) [32].
Furthermore, Ti2AlC matrix loaded with two type of Al2O3 fibers (20 vol %) was obtained by spark plasma sintering (named as Ti2AlC/720f and Ti2AlC/610f) [36]. The fracture experiments and the post-mortem analysis of the fracture surface by SEM revealed that kinking along with intergranular cracking andof delamination played an important role in deformation Ti2and AlC. Figure 4. FE-SEM images the fracture surfaces of (a,c) composites prepared at 1250of °C 1/2) was higher Figure FE-SEM images of the(5.46 fracture surfaces (a,c) prepared at MPa·m 1250 ◦1/2C) and The4.dynamic fracture toughness thancomposites the quasi-static value (b,d) composites prepared at 1300 °C; MPa·m the images showofa step-like fracture model (a,b)(4.03 and multiple ◦ C; (b,d)transversal composites prepared at 1300 the images show step-like fracture model (a,b)increasing and multiple by approximately and the fracture toughness ofathe composites reduced when cracks in35%, the matrix (c,d) [32]. the temperature. transversal cracks in the matrix (c,d) [32].
Furthermore, Ti2AlC matrix loaded with two type of Al2O3 fibers (20 vol %) was obtained by spark plasma sintering Ti2AlC/720f and Ti 2AlC/610f) [36]. The fracture experiments and Furthermore, Ti2 AlC(named matrix as loaded with two type of Al2 O3 fibers (20 vol %) was obtained by the post-mortem analysis of the fracture surface by SEM revealed that kinking along with spark plasma sintering (named as Ti2 AlC/720f and Ti2 AlC/610f) [36]. The fracture experiments and intergranular cracking and delamination played an important role in deformation of Ti2AlC. the post-mortem analysis of the fracture surface by SEM revealed that kinking along with intergranular The dynamic fracture toughness (5.46 MPa·m1/2) was higher than the quasi-static value (4.03 MPa·m1/2) cracking and delamination played an important role in of Ti dynamic fracture 2 AlC. The by approximately 35%, and the fracture toughness ofdeformation the composites reduced when increasing 1/2 ) was higher than the quasi-static value (4.03 MPa·m1/2 ) by approximately toughness (5.46 MPa · m the temperature.
35%, and the fracture toughness of the composites reduced when increasing the temperature.
Materials 2017, 10, 366 Materials 2017, 10, 366
5 of 12 5 of 12
2.3. Transformation Transformation Toughening Toughening Transformation toughening in MAX phases can be A 20 wt % be traced traced back back to to 2007 2007 [37,38]. [37,38]. A ◦ C under a pressure ZrO22/Ti /Ti33AlC AlC2 2was wasobtained obtainedby byuniaxial uniaxialhot-pressing hot-pressing at at 1450 1450 °C under a pressure of 20 MPa for 2 h in 1/2, vacuum ·m1/2 vacuum and and the themeasured measuredfracture fracturetoughness toughnessofof2020wtwt%%ZrO ZrO 2/Ti AlC22 composite compositewas was6.8 6.8MPa MPa·m 2 /Ti 3 3AlC 1/2 while the fracture toughness of monolithic Ti33AlC AlC22 was was4.6 4.6MPa·m MPa·m1/2 [37]. [37]. The SEM observations The SEM observations of of the fracture surface indicated that the fracture toughness improvement can be ascribed to the the fracture surface indicated that the fracture toughness improvement can be ascribed compressive stress stress in in the the matrix matrix generated generated by by the the ZrO ZrO22 particles transformation process. process. In the 3 mol mol % % yttria yttria stabilized stabilized tetragonal zirconia ceramics (3Y-TZP) reinforced Ti3SiC2 composites prepared by spark plasma sintering (SPS) at 1300 ◦°C, C, the fracture toughness could reach 1/2 1/2 11.94 ·m with with 30 vol % ofof m-ZrO could be be found on 11.94 MPa MPa·m % 3Y-TZP 3Y-TZPadditions additions[38]. [38].Some Someamount amount m-ZrO 2 phase could found 2 phase the fracture surface indicating thatthat the the phase transformation of T-ZrO → M-ZrO occurred during the on the fracture surface indicating phase transformation of T-ZrO 2 →M-ZrO 2 occurred during 2 2 fracture [38]. [38]. On the other toughening is not an exclusive mechanism the fracture On the hand, othertransformation hand, transformation toughening is not antoughening exclusive toughening in the zirconia The second phase transformation mechanism in toughened the zirconiacomposites toughened(ZTCs). composites (ZTCs).phase The formed second by phase formed by phase could toughen the matrix through multiple toughening mechanisms to a different degree, such as transformation could toughen the matrix through multiple toughening mechanisms to a different crack deflection and bridging [39]. degree, such as crack deflection and bridging [39]. 2.4. 2.4. Texture Texture Toughening Toughening Texture So far, far, Texture is is also also an an effective effective approach approach for for toughening toughening of of MAX MAX phases phases ceramics ceramics [40–46]. [40–46]. So slip slip casting casting in in aa strong strong magnetic magnetic field field coupled coupled with with spark spark plasma plasma sintering sintering was was applied applied to to produce produce textured MAX phases. textured MAX phases. Textured AlC33 ceramic ceramic with with aa shell-like Textured nanolayered nanolayered Nb Nb44AlC shell-like microstructure microstructure was was fabricated fabricated by by strong magnetic field alignment technology followed by spark plasma sintering [40]. After sintering, strong magnetic field alignment technology followed by spark plasma sintering [40]. After sintering, the were schematized and analyzed by SEMbyand TEMand observations (Figure 5). the tailored tailoredmicrostructures microstructures were schematized and analyzed SEM TEM observations Figure shows that the texture microstructure can activate toughening mechanisms of crack (Figure65). Figure 6 shows that the texture microstructure canthe activate the toughening mechanisms deflection, through grain pull-out and bridging in Nb AlC ceramic. Consequently, the fracture 4 of crack deflection, through grain pull-out and bridging in3 Nb4AlC3 ceramic. Consequently, the 1/2 for toughness of the textured Nb AlC ceramic was extremely high and increased from 7.1 MPa · m 4 3 fracture toughness of the textured Nb4AlC3 ceramic was extremely high and increased from the as-grown ceramic to 17.9 ±ceramic 5.16 and 1.38 MPa ·m1/2 along the directions of directions parallel and 1/2 for 1/2 along the 7.1 MPa·m the as-grown to 11.49 17.9 ±± 5.16 and 11.49 ± 1.38 MPa·m of perpendicular to the c-axis direction, respectively [40]. Similar work has been reported on 211 parallel and perpendicular to the c-axis direction, respectively [40]. Similar work has beenother reported and 312 MAX phases a spark plasma and thefacility fractureand toughness of Ti2toughness AlC increased on other 211 and 312 in MAX phases in a facility spark plasma the fracture of Tifrom 2AlC 1/2 in the as-sintered ceramic to 7.9 MPa·m1/2 and 6.5 MPa·m1/2 parallel and perpendicular 6.0 MPa · m 1/2 1/2 1/2 increased from 6.0 MPa·m in the as-sintered ceramic to 7.9 MPa·m and 6.5 MPa·m parallel and to the loading direction, respectively, in respectively, the deformedinceramic [42]. ceramic [42]. perpendicular to the loading direction, the deformed
Figure Figure 5. 5. Cont. Cont.
Materials 2017, 10, 366 Materials 2017, 10, 366 Materials 2017, 10, 366
6 of 12 6 of 12 6 of 12
Figure 5. (a) Schematic diagram of tailored dense bulk nanolayered Nb4AlC3 ceramic, showing the Figure 5. ceramic, showing showing the the Figure 5. (a) (a) Schematic Schematic diagram diagram of of tailored tailored dense dense bulk bulk nanolayered nanolayered Nb Nb44AlC AlC3 ceramic, orderly stacking of grains whose c-axes are perpendicular to the textured top surface; (b,c) SEM orderly stacking stacking of of grains grains whose whose c-axes c-axes are are perpendicular to the the textured (b,c) SEM SEM orderly perpendicular to textured top top surface; surface; (b,c) micrographs of etched textured side and top surface; (d,e) High-resolution transmission electron micrographs of of etched etched textured textured side side and electron micrographs and top top surface; surface; (d,e) (d,e) High-resolution High-resolution transmission transmission electron microscope atomic images of grain boundaries (indicated by arrows) observed from the textured microscope atomic images of grain boundaries (indicated by arrows) observed from the textured side microscope atomic images of grain boundaries (indicated by arrows) observed from the textured side and top surface directions [40]. and top surface directions [40]. side and top surface directions [40].
Figure 6. SEM micrographs of the in situ crack propagation of textured Nb4AlC3 [40]. Figure 6. SEM micrographs of the in situ crack propagation of [40]. of textured textured Nb Nb44AlC3 [40].
3. Toughening Models for MAX Phases 3. Toughening Models for MAX Phases The toughening mechanisms in ceramics can be understood and predicted by the modeling The toughening tougheningmechanisms mechanismsininceramics ceramics understood predicted bymodeling the modeling cancan be be understood andand predicted by the work work which can contribute insights and theoretical instructions for material design, process work which can contribute insights and theoretical instructions for material design, process which can contribute insights and theoretical instructions for material design, process development development and optimization. Many approaches were applied and developed for ceramic development andMany optimization. approaches were applied and developed for ceramic and optimization. approachesMany were as applied and developed ceramic toughening toughening mechanism simulations such finite element methodfor (FEM), first principles mechanism calculation toughening mechanism simulations such as (FEM), finite element method (FEM), first principles calculation simulations as finite element method first principles calculation (FPC) [47,48] and the (FPC) [47,48]such and the empirical electron theory (EET) of solids and molecules [49–52]. (FPC) [47,48] and the empirical electron theory (EET) of [49–52]. solids and molecules [49–52]. empirical electron theory (EET) of solids and molecules For a comprehensive understanding of the toughening mechanisms in these nanolayered MAX For a comprehensive understanding of the toughening mechanisms in these nanolayered MAX phase ceramics, SiC particle and fiber-reinforced Ti3SiC2 composites were selected as models and phase ceramics, SiC particle and fiber-reinforced Ti Ti33SiC22 composites were selected models and composites selected as simulated using a primary 3D finite element model (3D-FEM), which iswere schematically represented in simulated using a primary 3D finite element model (3D-FEM), which is schematically represented in simulated using a primary 3Dparameters finite element (3D-FEM), whichin is Table schematically represented Figure 7. The main material usedmodel in 3D-FEM are listed 1. For the SiC fiber Figure 7. 7. TheThe main material parameters used inin3D-FEM in Figure main material parameters used 3D-FEMare arelisted listedininTable Table1.1. For For the the SiC SiC fiber toughening Ti3SiC 2 MAX phase, the elliptical SiC fibers with a length–diameter ratio of 20:1 was toughening Ti33SiC 22 MAX phase, the elliptical SiC fibers with aa length–diameter ratio of 20:1 was toughening SiC MAX phase, the elliptical SiC fibers with length–diameter ratio of applied in 3D-FEM. applied in 3D-FEM. Table 1. Main material parameters in 3D-FEM. Table Table 1. Main material parameters in 3D-FEM. Composites Composites Composites SiC-Ti3SiC2 SiC-Ti 3SiC2 system SiC-Ti 3 SiC2 system system SiC-Ti3SiC2 SiC-Ti 3SiC2 system SiC-Ti 3 SiC2 system system
Materials Materials Materials Ti3SiC2 matrix TiSiC 3SiC2 matrix particle Ti3 SiC 2 matrix particle TiSiC 3SiC2 matrix SiC particle Ti3SiC2 matrix Ti3SiC-Fiber SiC2 matrix SiC-Fiber SiC-Fiber
Young’s Young’s Modulus Young’s(GPa) Modulus (GPa) Modulus 333(GPa) 333 440 333 440 333 440 333 450 333 450 450
Poisson’s Poisson’s Ratio Poisson’s Ratio Ratio 0.2 0.2 0.14 0.2 0.14 0.2 0.14 0.2 0.14 0.2 0.14 0.14
Dimension Dimension Dimension 0.05 × 0.1 × 0.002 mm3 0.05 R× =0.1 × 0.002 mm33 mmmm 0.05 × 0.10.006 × 0.002 R× =0.1 0.006 mm 3 0.05R × 0.002 = 0.006 mm mm3 0.05 ×a10.1 × 0.002 = 0.08 mmmm3 0.05 ×a10.1 × 0.002 mm 0.08 mm mm b1 ==0.004 0.08 mm mm ba11 == 0.004 b1 = 0.004 mm
Volume Volume Fraction Volume (%) Fraction (%) Fraction 93.2(%) 93.2 6.8 93.2 6.8 95 6.8 95 5.0 95 5.0 5.0
Half Crack Half Crack Length (mm) Half Crack Length (mm) Length (mm) 0.005 0.005 0.005
0.005 0.005 0.005
Materials 2017, 10, 366
7 of 12
Materials 2017, 10, 366
7 of 12
Materials 2017, 10, 366
7 of 12
Figure 7. 7. 3D 3D finite finite element element model model (3D-FEM) (3D-FEM)of ofSiC-reinforced SiC-reinforcedTi Ti33SiC SiC22 MAX MAX phase phase with with aa crack crack on on the the Figure left, (a) (a) SiC SiC particle particle (b) (b) SiC SiC fiber fiberwith withaalength–diameter length–diameterratio ratioisis20:1. 20:1. left, Figure 7. 3D finite element model (3D-FEM) of SiC-reinforced Ti3SiC2 MAX phase with a crack on the (a) SiCmechanics, particle (b) SiC fiber a length–diameter is 20:1. Inleft, fracture there arewith three types of basicratio fracture modes, as shown in Figure 8: Mode I
In fracture mechanics, there are three types of basic fracture modes, as shown in Figure 8: Mode I Opening model, Mode II Shearing mode and Mode III Tearing mode, where (x1, x2, x3) is the local Opening Mode II Shearing and Mode III Tearingmodes, mode,as where (xin x2 , x3 ) 8: is the local 1 , Figure In model, fracture mechanics, aremode three types of basic shown I Cartesian coordinate systemthere centered at the crack frontfracture with the x1-axis perpendicular to Mode the crack Cartesian coordinate system centered at the crack front with the x -axis perpendicular to the crack 1 Opening model, Mode II Shearing mode and Mode III Tearing mode, where (x 1, x2, x3) is the local front, the x2-axis perpendicular to the crack plane, and the x3-axis along the crack front. In those front, the x2 -axis perpendicular to the at crack plane,front and with the xthe along the crack front. those 3 -axis Cartesian coordinate system centered the crack x1-axis to which theIn crack modes, the stress-intensity factor, K, is a parameter describing the fieldperpendicular of the crack tip only modes, the stress-intensity factor, K, is a parameter describing the field of the crack tip which only front, the x2-axis perpendicular to the crack plane, and the x3-axis along the crack front. In those correlates to the loads and geometries. In the present study, Mode I, the opening mode, was selected correlates loads and geometries. presentdescribing study, Mode the of opening mode, was selected modes, to thethe stress-intensity factor, K, isIna the parameter the I,field the crack tip which only for SiC particle and fiber-reinforced Ti3SiC2 composites where the stress-intensity factor, KI, can be forcorrelates SiC particle and fiber-reinforced Ti3In SiCthe where theI, stress-intensity factor, KI , can be to the loads and geometries. present study, Mode the opening mode, was selected 2 composites expressed by the following formula and be obtained from the extended finite element method expressed by the following formula and fromwhere the extended finite element method (EFEM) for SiC particle and fiber-reinforced Ti3be SiCobtained 2 composites the stress-intensity factor, KI, can be (EFEM) by using an ABAQUS/CAE 2016 software package. by the following formula andpackage. be obtained from the extended finite element method by expressed using an ABAQUS/CAE 2016 software (EFEM) by using an ABAQUS/CAE 2016 software K I lim 22 ( x1 apackage. r , x2 0)√ 2πr (1) r 0 σ22 ( x1 = a + r, x2 = 0) 2πr KI = lim (1) →0 ( x a r , x 0) 2πr K I rlim (1) 22 1 2 0 In the formula, σ22 is the biaxialr stress in the vicinity of the crack tip, x1 and x2 are Cartesian In the formula, σ22 is the biaxial stress in the vicinity of the crack tip, x1 and x2 are Cartesian coordinates at x 1 -axis and x 2 -axis, respectively, a is the crack length thex2 radius for a 3D In the formula, σ22 is the biaxial stress in the vicinity of the crack and tip, xr1 is and are Cartesian coordinates at x1 -axis and x2 -axis, respectively, a is the crack length and r is the radius for a 3D penny-shaped crack. coordinates at x1-axis and x2-axis, respectively, a is the crack length and r is the radius for a 3D penny-shaped crack. penny-shaped crack.
Figure 8. Schematic of the basic fracture modes under three-dimensional cracks: (a) Mode I (opening); Figure 8. Schematic of the basic fracture modes under three-dimensional cracks: (a) Mode I (opening); Figure 8. Schematic of the modes under three-dimensional cracks: (a) Mode I (opening); (b) Mode II (shearing); (c) basic Modefracture III (tearing). (b) Mode II (shearing); (c) Mode III (tearing). (b) Mode II (shearing); (c) Mode III (tearing).
3.1.3.1. SiC Particle-Reinforced 2 MAX Phase SiC Particle-ReinforcedTiTi3SiC 3SiC2 MAX Phase Figure 9a9arepresents for the thecomposite compositeofofSiC SiCparticle-reinforced particle-reinforced 3SiC2 Figure representsthe thefinite finiteelement element mesh mesh for Ti3Ti SiC 2 matrix, and Figure 9b shows the boundary conditions applied on the top and bottom sides of matrix, and Figure 9b shows the boundary conditions applied on the top and bottom sides of thethe
Materials 2017, 10, 366
8 of 12
3.1. SiC Particle-Reinforced Ti3 SiC2 MAX Phase Figure 9a represents the finite element mesh for the composite of SiC particle-reinforced Ti3 SiC2 matrix, and Figure 9b shows the boundary conditions applied on the top and bottom sides of the Materials 2017, 10, 366 8 of 12 geometry respect to the X axis and Y axis respectively. The geometry displacement at the X axis Materials 2017, 10, 366 8 of 12 direction is constrained to zero. 10 illustrates theThe maximum stress at geometry respect to the X axisFigure and Y axis respectively. geometryprincipal displacement at distribution the X axis the onset of crack propagation predicted by the fracture model for the composite with 6.8 vol % SiC direction is constrained to zero. Figure 10 illustrates the maximum principal stress distribution at the geometry respect to the X axis and Y axis respectively. The geometry displacement at the X axis onset of crack propagation predicted the stress-intensity fracture for the composite 6.8 this vol % reinforcement. corresponding value by of illustrates the factor, KI , obtained from simulation direction isThe constrained to zero. Figure 10 themodel maximum principal stresswith distribution at SiC the 1/2 . As reinforcement. The corresponding value of the stress-intensity factor, K I, obtained from is 6.26 MPa · m shown in Figure 10, the SiC particles can prevent crack from propagating onset of crack propagation predicted by the fracture model for the composite with 6.8 vol % this SiC and 1/2 As shown in Figure 10, the SiC particles can prevent crack from simulation is 6.26 lead reinforcement. to stress concentration at . the crack tip of and stress-intensity factor considered TheMPa·m corresponding value thethestress-intensity factor, KI, Kobtained this as I can be from propagating and lead to stress concentration at the crack tip and the stress-intensity factor K I can be 1/2 1/2 simulation MPa·m . As shown in KFigure 10, MPa the SiC can prevent cracka from a critical factor is for6.26 fracture toughness (KI = ·m particles ), which demonstrates sufficient IC = 6.26 considered asand a critical factor for fracture toughness (KI = K IC = 6.26 MPa·m1/2), which demonstrates a propagating lead tothe stress concentration at the crack the stress-intensity factor K I can be reinforcement to enhance toughness of monolithic Ti3tip SiCand MAX phase [30]. 2 sufficient reinforcement to enhance the toughness of(K monolithic Ti3SiC2 MAX phase [30]. considered as a critical factor for fracture toughness I = KIC = 6.26 MPa·m1/2), which demonstrates a sufficient reinforcement to enhance the toughness of monolithic Ti3SiC2 MAX phase [30].
Figure 9. (a) Finite element mesh and (b) boundary conditions for the composite of SiC
Figure 9. (a) Finite Tielement mesh and (b) boundary conditions for the composite of SiC particles-reinforced 3SiC2. Figure 9. (a) Finite element mesh and (b) boundary conditions for the composite of SiC particles-reinforced Ti3 SiC2 . particles-reinforced Ti3SiC2.
Figure 10. Predicted maximum principal stress distribution at the onset of crack propagation for the composite of SiC particle-reinforced Ti3SiC2. Figure 10. Predicted maximum principal stress distribution at the onset of crack propagation for the Figure 10. Predicted maximum principal stress distribution at the onset of crack propagation for the composite of SiC particle-reinforced Ti3SiC 2.
3.2. SiC Fiber-Reinforced Ti3SiC2 MAXTi Phase composite of SiC particle-reinforced 3 SiC2 .
3.2. SiC Fiber-Reinforced Ti3SiC2 MAX Phase Similar to SiC particle-reinforced Ti3SiC2 MAX phase, Figure 11 shows the finite element mesh and boundary constraint for the SiC fiber-reinforced Ti3SiCFigure 2 composite. In the finite element mesh Similar to SiC particle-reinforced Ti3SiC2 MAX phase, 11 shows the finite element mesh and boundary constraint for the SiC fiber-reinforced Ti3SiC2 composite. In the finite element mesh
Materials 2017, 10, 366
9 of 12
3.2. SiC Fiber-Reinforced Ti3 SiC2 MAX Phase Similar to SiC particle-reinforced Ti3 SiC2 MAX phase, Figure 11 shows the finite element mesh and boundary constraint for the SiC fiber-reinforced Ti3 SiC2 composite. In the finite element mesh Materials 2017, 10, 366 9 of 12 (Figure 11a), the seed point distribution on the inner ellipse SiC fiber edge are 16 points and the seed distribution on the edge distribution of Ti3 SiC2 matrix are 6ellipse pointsSiC at its high dimension, 4 points its long (Figure 11a), thecubic seed point on the inner fiber edge are 16 points and theat seed dimension and 1on point at its edge wideofdimension. Forare the6 boundary as shown in Figure 11b, the distribution the cubic Ti33SiC22 matrix points at itsconstraint, high dimension, 4 points at its long dimensionofand point at3its dimension. For the boundary constraint, as1shown in Figure displacement the1top of Ti SiCwide constraint to − 4 × 105 mm in the U direction, −2 ×11b, 105 mm 2 matrix 55 mm in the U1 direction, the displacement of the top of Ti 3 SiC 2 matrix constraint to −4 × 10 2 in the U2 direction and 0 mm in the U3 3 direction, the displacement of the bottom of1Ti3 SiC2 matrix 55 mm in the −2 × 10to U22 in direction 0 mm in−the 33 direction, the U displacement of the bottom of 5 mm in the constraint 4 × 105 mm the U1and direction, 2 ×U10 1 direction and 0 mm in the U3 5 5 5 5 Ti33SiC22 matrix constraint to 4 × 10 mm in the U11 direction, −2 × 10 mm in the U11 direction and 0 mm direction. Consequently, Figure 12 shows the predicted maximum principal stress distribution at in the U33 direction. Consequently, Figure 12 shows the predicted maximum principal stress the onset of crack propagation for the proposed SiC fiber-reinforced Ti3 SiC2 composites with 5 vol % distribution at the onset of crack propagation for the proposed SiC fiber-reinforced Ti33SiC22 reinforcements The 5predicted maximum .principal stress is 176.2 MPa. The higher the maximum composites . with vol % reinforcements . The predicted maximum principal stress is 176.2 MPa. principal stress, the stronger the fiber can prevent crack from The stress-intensity The higher the maximum principal stress, the stronger the fiberinitiating. can prevent crack from initiating.factor 1/2 indicating a significant improvement 1/2 KI computed from 3D-FEM method is 12.65 MP · m 1/2 The stress-intensity factor KII computed from 3D-FEM method is 12.65 MP·m indicating ain the significant improvement in the toughness of the Ti33SiC22 MAX phases. toughness of the Ti3 SiC2 MAX phases.
Figure 11. (a) Finite element mesh; (b) boundary constraint for the composite of SiC fiber-reinforced Ti33SiC22.
Figure 11. (a) Finite element mesh; (b) boundary constraint for the composite of SiC fiber-reinforced Ti3 SiC2 .
Figure 12. Predicted maximum principal stress distribution at the onset of crack propagation for the
Figure 12. Predicted maximum principal stress distribution at the onset of crack propagation for the SiC fiber-reinforced Ti33SiC22 composites. SiC fiber-reinforced Ti3 SiC2 composites.
The successful prediction of toughness of the SiC particle and fiber-reinforced Ti33SiC22 using 3D-FEM can provide insight of and valuable guidance to particle the experimental work to fabricate MAX The successful prediction toughness of the SiC and fiber-reinforced Ti3 SiC 2 using phase-based composites withand optimized microstructures obtain the desired mechanical properties.MAX 3D-FEM can provide insight valuable guidance toto the experimental work to fabricate However, more modeling be done to further optimize the microstructures of the phase-based composites withprediction optimizedshould microstructures to obtain the desired mechanical properties. composites to achieve the required properties for their applications.
Materials 2017, 10, 366
10 of 12
However, more modeling prediction should be done to further optimize the microstructures of the composites to achieve the required properties for their applications. 4. Conclusions This paper reviews the toughening mechanisms for a family of nanolayered MAX phases and the related composites. Based on the experimental results, SiC particle and fiber toughening MAX phase models were established for a better understanding of the toughening mechanisms and prediction of the improvement of the toughness, which may contribute with insights and theoretical instructions for material design, process development, and optimization. Meanwhile, it also opens many perspectives in toughening those nanolayered ceramics: (1)
(2)
(3)
To apply these nanolayered MAX phases as higher performance and reliable structural components, a further tailoring of the microstructure should be done to enhance both strength and toughness. Through additional microstructure modification e.g., by grain size control, it is probable that the flexural strength or fracture toughness can be further enhanced. For the fiber toughening MAX phases, more work should be done to optimize the interface between MAX phase and fibers, e.g., by selecting different fibers which could be phase equilibrium with MAX phase during the high-temperature processing or by new processing methods that can consolidate the composites with fast densification technology to reduce or avoid the reaction between the fibers and MAX phase matrix. The modeling work presented here is just a first attempt to predict the improved toughness of the MAX phase-based composites by using 3D-FEM. However, more modeling parameters such as selection of proper reinforcements, the volume fraction of reinforcement as well as size and dimensions of the reinforcements etc. need to be further investigated and refined, which may provide valuable theoretical guidelines for material design, process development, and optimization.
Success in addressing these points may expand MAX phases and related composites to numerous structural and high-temperature applications. Acknowledgments: This study was financially supported by the Open Research Fund Program of the Beijing Key Laboratory of Performance Guarantee on Urban Rail Transit Vehicles (No. 06080915001) and the Science Research Fund Program of Beijing University of Civil Engineering and Architecture (No. 00331615028). The authors also would like to thank Lucia Carabat from 3ME, TU-Delft for her refinements of the manuscript. Author Contributions: Guoping Bei conceived and designed the modeling work and Xinhua Chen performed the FEM. Guoping Bei constructed the manuscript and Guoping Bei and Xinhua Chen wrote the paper equally. Conflicts of Interest: The authors declare no conflict of interest.
References 1.
2.
3.
4.
5.
Song, K.; Xu, Y.; Zhao, N.; Zhong, L.; Shang, Z.; Shen, L.; Wang, J. Evaluation of Fracture Toughness of Tantalum Carbide Ceramic Layer: A Vickers Indentation Method. J. Mater. Eng. Perform. 2016, 25, 3057–3064. [CrossRef] Naguib, M.; Come, J.; Dyatkin, B.; Presser, V.; Taberna, P.-L.; Simon, P.; Barsoum, M.W.; Gogotsi, Y. MXene: A promising transition metal carbide anode for lithium-ion batteries. Electrochem. Commun. 2012, 16, 61–64. [CrossRef] Wang, S.F.; Zhang, J.; Luo, D.W.; Gu, F.; Tang, D.Y.; Dong, Z.L.; Tan, G.E.B.; Que, W.X.; Zhang, T.S.; Li, S.; et al. Transparent ceramics: Processing, materials and applications. Prog. Solid State Chem. 2013, 41, 20–54. [CrossRef] Swain, M.V. Toughening Mechanisms for Ceramics A2—SALAMA, K. In Proceedings of the 7th International Conference On Fracture (ICF7), Houston, TX, USA, 20–24 March 1989; Ravi-Chandar, K., Taplin, D.M.R., Rao, P.R., Eds.; Pergamon: Oxford, UK, 1989; pp. 3739–3786. Guazzato, M.; Albakry, M.; Ringer, S.P.; Swain, M.V. Strength, fracture toughness and microstructure of a selection of all-ceramic materials. Part II. Zirconia-based dental ceramics. Dent. Mater. 2004, 20, 449–456. [CrossRef] [PubMed]
Materials 2017, 10, 366
6. 7. 8. 9. 10. 11. 12. 13. 14. 15. 16. 17. 18. 19. 20. 21. 22. 23.
24. 25. 26.
27. 28. 29. 30.
11 of 12
Abram, T.; Ion, S. Generation-IV nuclear power: A review of the state of the science. Energy Policy 2008, 36, 4323–4330. [CrossRef] Yvon, P.; Carré, F. Structural materials challenges for advanced reactor systems. J. Nucl. Mater. 2009, 385, 217–222. [CrossRef] Hammel, E.C.; Ighodaro, O.L.R.; Okoli, O.I. Processing and properties of advanced porous ceramics: An application based review. Ceram. Int. 2014, 40, 15351–15370. [CrossRef] Hillig, W.B. Strength and Toughness of Ceramic Matrix Composites. Annu. Rev. Mater. Sci. 1987, 17, 341–383. [CrossRef] Gogotsi, G.A. Fracture toughness of ceramics and ceramic composites. Ceram. Int. 2003, 29, 777–784. [CrossRef] Vallauri, D.; Atías Adrián, I.C.; Chrysanthou, A. TiC–TiB2 composites: A review of phase relationships, processing and properties. J. Eur. Ceram. Soc. 2008, 28, 1697–1713. [CrossRef] Rühle, M.; Evans, A.G. High toughness ceramics and ceramic composites. Prog. Mater Sci. 1989, 33, 85–167. [CrossRef] Ritchie, R.O. The conflicts between strength and toughness. Nat. Mater. 2011, 10, 817–822. [CrossRef] [PubMed] Launey, M.E.; Ritchie, R.O. On the Fracture Toughness of Advanced Materials. Adv. Mater. 2009, 21, 2103–2110. [CrossRef] Clegg, W.J.; Kendall, K.; Alford, N.M.; Button, T.W.; Birchall, J.D. A simple way to make tough ceramics. Nature 1990, 347, 455–457. [CrossRef] Barsoum, M.W.; Kangutkar, P.; Wang, A.S.D. Matrix crack initiation in ceramic matrix composites Part I: Experiments and test results. Compos. Sci. Technol. 1992, 44, 257–269. [CrossRef] Barsoum, M.W. The MN+1 AXN phases: A new class of solids: Thermodynamically stable nanolaminates. Prog. Solid State Chem. 2000, 28, 201–281. [CrossRef] Sun, Z.M. Progress in research and development on MAX phases: A family of layered ternary compounds. Int. Mater. Rev. 2011, 56, 143–166. [CrossRef] Zhang, H.B.; Bao, Y.W.; Zhou, Y.C. Current Status in Layered Ternary Carbide Ti3 SiC2 , a Review. J. Mater. Sci. Technol. 2009, 25, 1–38. Wang, X.H.; Zhou, Y.C. Layered Machinable and Electrically Conductive Ti2 AlC and Ti3 AlC2 Ceramics: A Review. J. Mater. Sci. Technol. 2010, 26, 385–426. [CrossRef] Barsoum, M.W.; Radovic, M. Elastic and Mechanical Properties of the MAX Phases. Annu. Rev. Mater. Sci. 2011, 41, 195–227. [CrossRef] Bei, G.P.; Gauthier-Brunet, V.; Tromas, C.; Dubois, S. Synthesis, characterization, and intrinsic hardness of layered nanolaminate Ti3 AlC2 and Ti3 Al0. 8 Sn0.2 C2 solid solution. J. Am. Ceram. Soc. 2012, 95, 102–107. [CrossRef] Wan, D.T.; Meng, F.L.; Zhou, Y.C.; Bao, Y.W.; Chen, J.X. Effect of grain size, notch width, and testing temperature on the fracture toughness of Ti3 Si(Al)C2 and Ti3 AlC2 using the chevron-notched beam (CNB) method. J. Eur. Ceram. Soc. 2008, 28, 663–669. [CrossRef] Yang, J.; Pan, L.; Gu, W.; Qiu, T.; Zhang, Y.; Zhu, S. Microstructure and mechanical properties of in situ synthesized (TiB2 + TiC)/Ti3 SiC2 composites. Ceram. Int. 2012, 38, 649–655. [CrossRef] Chen, J.; Liu, M.; Bao, Y.; Zhou, Y. Failure-mode dependence of the strengthening effect in Ti3 AlC2 /10 vol % Al2 O3 composite. Int. Mater. Res. 2006, 97, 1115–1118. [CrossRef] Song, G.M.; Xu, Q.; Sloof, W.G.; Li, S.B.; van der Zwaag, S. Toughening of a ZrC particle-reinforced Ti3 AIC2 composite. In Mechanical Properties and Processing of Ceramic Binary, Ternary, and Composite Systems: Ceramic Engineering and Science Proceedings, Daytona Beach, Florida USA, 27 January–1 February 2008; Salem, J., Hilma, G., Fahrenholtz, W., Eds.; John Wiley & Sons, Inc: Hoboken, NJ, USA, 2009; pp. 31–39. Li, L.; Zhou, A.; Wang, L.; Li, S.; Wu, D.; Yan, C. In situ synthesis of cBN–Ti3 AlC2 composites by high-pressure and high-temperature technology. Diam. Relat. Mater. 2012, 29, 8–12. [CrossRef] Benko, E.; Klimczyk, P.; Mackiewicz, S.; Barr, T.L.; Piskorska, E. cBN–Ti3 SiC2 composites. Diam. Relat. Mater. 2004, 13, 521–525. [CrossRef] Bendjemil, B.; Bougdira, J.; Zhang, F.; Burkel, E. Nano-ceramics Ti3 SiC2 max phase reinforced single walled carbon nanotubes by spark plasma sintering. Int. Nanoelectron. Mater. 2017, 10, 47–62. [CrossRef] Konoplyuk, S.; Abe, T.; Uchimoto, T.; Takagi, T. Synthesis of Ti3 SiC2 /TiC composites from TiH2 /SiC/TiC powders. Mater. Lett. 2005, 59, 2342–2346. [CrossRef]
Materials 2017, 10, 366
31.
32. 33. 34. 35.
36.
37. 38. 39. 40. 41. 42. 43. 44. 45. 46.
47. 48. 49. 50. 51. 52.
12 of 12
Spencer, C.B.; Córdoba, J.M.; Obando, N.H.; Radovic, M.; Odén, M.; Hultman, L.; Barsoum, M.W. The Reactivity of Ti2 AlC and Ti3 SiC2 with SiC Fibers and Powders up to Temperatures of 1550 ◦ C. J. Am. Ceram. Soc. 2011, 94, 1737–1743. [CrossRef] Guo, S. Improvement of mechanical properties of SiC(SCS-6) fibre-reinforced Ti3 AlC2 matrix composites with Ti barrier layer. J. Eur. Ceram. Soc. 2016, 36, 1349–1358. [CrossRef] Guo, S.; Hu, C.; Gao, H.; Tanaka, Y.; Kagawa, Y. SiC(SCS-6) fiber-reinforced Ti3 AlC2 matrix composites: Interfacial characterization and mechanical behavior. J. Eur. Ceram. Soc. 2015, 35, 1375–1384. [CrossRef] Lenz, F.; Krenkel, W. Fabrication of fiber composites with a MAX phase matrix by reactive melt infiltration. IOP Conf. Ser. Mater. Sci. Eng. 2011, 18, 202030. [CrossRef] Spencer, C.B.; Córdoba, J.M.; Obando, N.; Sakulich, A.; Radovic, M.; Odén, M.; Hultman, L.; Barsoum, M.W. Phase Evaluation in Al2 O3 Fiber-Reinforced Ti2 AlC During Sintering in the 1300 ◦ C–1500 ◦ C Temperature Range. J. Am. Ceram. Soc. 2011, 94, 3327–3334. [CrossRef] Naik Parrikar, P.; Gao, H.; Radovic, M.; Shukla, A. Static and Dynamic Thermo-Mechanical Behavior of Ti2 AlC MAX Phase and Fiber Reinforced Ti2 AlC Composites. In Dynamic Behavior of Materials, Proceedings of the 2014 Annual Conference on Experimental and Applied Mechanics; Song, B., Casem, D., Kimberley, J., Eds.; Springer International Publishing: Cham, Switzerland, 2015; Volume 1, pp. 9–14. Peng, L.M. Preparation and Properties of Ternary Ti3 AlC2 and its Composites from Ti–Al–C Powder Mixtures with Ceramic Particulates. J. Am. Ceram. Soc. 2007, 90, 1312–1314. [CrossRef] Shi, S.L.; Pan, W. Toughening of Ti3 SiC2 with 3Y-TZP addition by spark plasma sintering. Mater. Sci. Eng. A 2007, 447, 303–306. [CrossRef] Pan, W.; Shi, S.-L. Microstructure and mechanical properties of Ti3 SiC2 /3Y-TZP composites by spark plasma sintering. J. Eur. Ceram. Soc. 2007, 27, 413–417. [CrossRef] Hu, C.; Sakka, Y.; Grasso, S.; Nishimura, T.; Guo, S.; Tanaka, H. Shell-like nanolayered Nb4 AlC3 ceramic with high strength and toughness. Scr. Mater. 2011, 64, 765–768. [CrossRef] Hu, C.; Sakka, Y.; Grasso, S.; Suzuki, T.; Tanaka, H. Tailoring Ti3 SiC2 Ceramic via a Strong Magnetic Field Alignment Method Followed by Spark Plasma Sintering. J. Am. Ceram. Soc. 2011, 94, 742–748. [CrossRef] Lapauw, T.; Vanmeensel, K.; Lambrinou, K.; Vleugels, J. A new method to texture dense Mn+1 AXn ceramics by spark plasma deformation. Scr. Mater. 2016, 111, 98–101. [CrossRef] Sato, K.; Mishra, M.; Hirano, H.; Suzuki, T.S.; Sakka, Y. Fabrication of textured Ti3 SiC2 ceramic by slip casting in a strong magnetic field and pressureless sintering. J. Ceram. Soc. Jpn. 2014, 122, 817–821. [CrossRef] Hu, C.; Sakka, Y.; Tanaka, H.; Nishimura, T.; Grasso, S. Fabrication of Textured Nb4 AlC3 Ceramic by Slip Casting in a Strong Magnetic Field and Spark Plasma Sintering. J. Am. Ceram. Soc. 2011, 94, 410–415. [CrossRef] Chunfeng, H.; Yoshio, S.; Toshiyuki, N.; Shuqi, G.; Salvatore, G.; Hidehiko, T. Physical and mechanical properties of highly textured polycrystalline Nb4 AlC3 ceramic. Sci. Technol. Adv. Mater. 2011, 12, 044603. Zhang, H.B.; Hu, C.F.; Sato, K.; Grasso, S.; Estili, M.; Guo, S.Q.; Morita, K.; Yoshida, H.; Nishimura, T.; Suzuki, T.S.; et al. Tailoring Ti3 AlC2 ceramic with high anisotropic physical and mechanical properties. J. Eur. Ceram. Soc. 2015, 35, 393–397. [CrossRef] Friedman, J.R.; Patel, V.; Chen, W.; Tolpygo, S.; Lukens, J.E. Quantum superposition of distinct macroscopic states. Nature 2000, 406, 43–46. [CrossRef] [PubMed] Blatter, G. Schrödinger’s cat is now fat. Nature 2000, 406, 25–26. [CrossRef] [PubMed] Li, Z.; Huang, Q.; Wu, Y.; Li, Z. Application of the C-Me segregating theory in solid alloys to ceramics. Sci. China Ser. E 2007, 50, 462–471. [CrossRef] Cheng, K.J. Application of the TFD Model and Yu’s Theory to Material Design. Prog. Nat. Sci. 1993, 3, 211–230. Cheng, L.; Lin, L.Z.; Qing, Z.Y. Theoretical Research on Phase Transformations in Metastable β-Titanium Alloys. Metall. Mater. Trans. A 2009, 40, 1049–1058. Huang, Y.R. The empirical electron theory of solids and molecules. Chin. Sci. Bull. 1978, 23, 217–224. © 2017 by the authors. Licensee MDPI, Basel, Switzerland. This article is an open access article distributed under the terms and conditions of the Creative Commons Attribution (CC BY) license (http://creativecommons.org/licenses/by/4.0/).