50. 75. 100. 125. 150. 2000 2001 2002 2003 2004 2005 2006 2007 2008 2009
2010 2011. $. /b b ... Source: BP, plc., Statistical Review of World Energy 2011 ...
Perspectives on Energy Security and Transportation The Intersection of American Economic and Foreign Policy Challenges
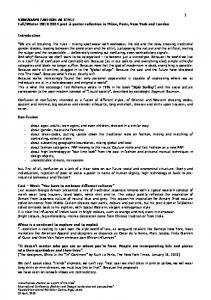
Energy Security is Again Front and Center Volatile oil prices and geopolitical instability in oil-producing regions are moving energy security back to the forefront of the political dialogue. BENCHMARK SPOT CRUDE OIL PRICES (BRENT) 150
125
$/bbl
100
› The U.S. is at a pivotal moment in energy policy. Oil prices are being rapidly driven up by market dynamics and geopolitical factors we do not control.
› Oil price volatility is 75
50
having a strong detrimental impact on the economy.
25
0 2000 2001 2002 2003 2004 2005 2006 2007 2008 2009 2010 2011 1
The Economic Recovery is off the Tracks High oil prices experienced throughout the first half of 2011 have derailed the recovery. Economic growth is paltry as consumer spending plummets. CRUDE OIL COSTS: SHARE OF U.S. GDP
› The oil intensity of the
2011 DOE Est.
10%
100
U.S. economy is about half of the 1974 level.
8%
80
6%
60
4%
40
WTI/bbl (Real)
Oil Spending, Share of GDP
› However, while we may be more resilient to high oil prices, spikes are occurring more frequently at high levels. The more important data point is oil spending as a share of GDP.
› At between 4 and 5 2%
20
0%
0 1970
1975
1980
1985
1990
1995
2000
2005
2010
percent of GDP, oil spending is again reaching levels typically associated with recession. 2
Source: BP, plc, Statistical Review of World Energy 2010; DOE, EIA; U.S. Bureau of Economic Analysis
Global Oil Market Dynamics—Demand The United States is the world’s largest oil consumer, accounting for onefifth of global oil demand. The majority—70 percent—is used in transport.
› At
TOP WORLD OIL CONSUMERS, 2010 U.S. China Japan India Russia Saudi Arabia Brazil Germany South Korea
› The U.S. transport
Canada Mexico Iran 0
5
Source: BP, plc., Statistical Review of World Energy 2011
19.1 million barrels per day, the U.S. was the world’s largest consumer of petroleum in 2010, using about three times as much as China. Between 2005 and 2009, U.S. oil demand averaged 20.1 million barrels per day.
10
15
20
sector alone consumes more oil than any national economy in the world—13.0 mbd.
Million Barrels per Day 3
Global Oil Market Dynamics—Demand Oil consumption within the world’s most developed economies has peaked. Emerging markets account for 100 percent of demand growth going forward.
› World oil demand is
WORLD OIL CONSUMPTION (HISTORICAL AND FORECAST)
set to grow by about 22 percent over the next 20 years.
100
› One hundred percent
Million Barrels per Day
80
of that growth is in China, India, and other emerging economies. And 97 percent of it is in transportation.
60
40
20
0 2009
2015 OECD
2020
China and india
Source: International Energy Agency, World Energy Outlook 2010
2025
2030
Other Non-OECD
2035 Other 4
Global Demand Drivers Emerging markets are expected to account for 100 percent of future oil demand growth. This is largely driven by the transportation sector .
› In 2009, China surpassed the United
› As vehicle sales increase
VEHICLE PRODUCTION, U.S. AND CHINA (HISTORICAL)
LIGHT-DUTY VEHICLE STOCK
States to become the largest auto market in the world.
exponentially, the number of cars on the road in China is soaring.
14
300
12
250 200
8 Millions
Million Units
10
6
150
4
100
2
50
0 1980
1984
1988 U.S.
1992
1996
2000
2004
2008
China
Source: Department of Energy, Office of Energy Efficiency and Renewable Energy
0 China 2007
United States 2015
2030
Source: International Energy Agency, World Energy Outlook 2009
5
Global Oil Market Dynamics—Supply The United States is the world’s third largest producer of oil. However, domestic production has fallen sharply since its peak in 1970.
› After decades of decline,
TOP WORLD OIL PRODUCERS, 2010 Russia Saudi Arabia
U.S. Iran China Canada
› Still, this level marks a
Mexico UAE Kuwait Venezuela Iraq Nigeria -
2
4
Source: BP, plc., Statistical Review of World Energy 2011
U.S. field production of crude oil and natural gas liquids was up from 6.7 mbd in 2008 to 7.2 mbd in 2009. Production increased again in 2010 to 7.5 mbd.
6
8
10 12 Million Barrels per Day
sharp decline from the 1970 level of 11.3 mbd. Well productivity is also down from 18.1 barrels per day per well in 1970 to 10.1 barrels per day in 2009. 6
Global Oil Market Dynamics—Supply Conventional oil production outside of OPEC is reaching a plateau. Increases in regions like North America are being offset elsewhere.
› Going forward, most
CRUDE OIL PRODUCTION (HISTORICAL AND FORECAST) 60%
100
50%
Million Barrels per Day
120
40%
80
30% 60 20% 40
10%
20
0%
0
-10% 1980
2009 OPEC
2015
2020 Non-OPEC
2025
2030
2035
OPEC Share
mainstream scenarios rely on increases in OPEC supplies to meet rising demand.
› Two key questions illustrate the downside risk to growth in future liquid supplies:
1. Who will have access to low-cost conventional reserves? 2. What will reserves replacement cost for IOCs?
Source: IEA
7
Global Resource Base Oil prices are set in an open market, but that does not mean there is a free market for oil supply. TOP OIL AND GAS FIRMS BY PROVED RESERVES (2007) NIOC Saudi Aramco Gazprom INOC QP Adnoc
› More than 90 percent of global proved oil reserves are held by national oil companies (NOCs) that are either partially or fully controlled by governments.
› While a handful of NOCs
PDVSA KPC NNPC Sonatrach LNOC CNPC Petronas ExxonMobil 0
50
100 150 200 Billion barrels oil equivalent
Source: International Energy Agency, World Energy Outlook 2008
250
300
operate like private firms, many function essentially as a branch of the central government, depositing oil revenues in the treasury from which they are diverted to social programs instead of being reinvested in new projects. 8
U.S. Oil Dependence Petroleum fuels account for approximately 40 percent of U.S. primary energy demand, more than any other fuel.
› Approximately 70 percent of U.S. oil consumption occurs in the transportation sector, with 40 percent in light-duty vehicles.
› Transportation is 94 percent reliant on oil-based fuel for energy, with no scaled substitutes. U.S. PRIMARY ENERGY DEMAND, 2009
PETROLEUM FUEL DEMAND BY SECTOR, 2009
39% Oil
20% Autos 24% Light-trucks
27% Natural Gas 28% Other Transport 23% Coal 9% Nuclear Energy 3% Hydro electric
22% Industrial
2% Commercial 4% Residential 1% Electric Power 9
Source: BP, plc., Statistical Review of World Energy 2010
U.S. Oil Dependence: Economic Costs On a month-to-month basis, petroleum imports have typically accounted for about half of the total U.S. trade deficit since the end of 2007.
› The portion of the
U.S. PETROLEUM TRADE DEFICIT (HISTORICAL AND FORECAST) 80
100%
Monthly Trade Deficit ($billions)
80% 60 70% 50
60%
40
50% 40%
30
30% 20 20% 10
10%
0
0%
2000
2002
2004
Deficit in Petroleum Petroleum Share of Total Trade Deficit
2006
2008
2010
Deficit in Goods and Services
Petroleum Share of Total Trade Deficit
90%
70
trade deficit driven by petroleum imports generally exceeds the imbalance we run in other goods and services with trade partners like China, NAFTA, and the EU.
› A high trade deficit exerts downward pressure on the dollar, which in turn may be helping to prop up oil prices, resulting in a vicious circle.
Source: U.S. Census Bureau, Office of Foreign Trade Statistics
10
U.S. Oil Dependence: Economic Costs The economic costs of U.S. oil dependence reached nearly $500 billion in 2008. Since 1970, total economic damage exceeds $5 trillion (real dollars).
› In addition to staggering wealth transfers, high and volatile oil prices generate significant uncertainty for households and businesses. The result is lost economic opportunity. ECONOMIC COSTS OF U.S. OIL DEPENDENCE 600 Wealth Transfer Transfer
Dislocation Losses Losses
Loss of Potential GDP
Billions ($2008)
500 400 300 200 100 0 1970
1975
Source: DOE, EERE; ORNL
1980
1985
1990
1995
2000
2005
2010 11
U.S. Oil Dependence: Household Impact As gasoline prices soared from 2001 to 2008, the increase in household fuel spending eclipsed the benefit of tax cuts over the same period. AVG. HOUSEHOLD SPENDING ON GASOLINE (2001-2008) 3.50
In 2001, the average household spent $1,517 on gasoline. By 2008, rising oil prices elevated average gasoline prices to $3.25/gal, and household fuel spending averaged $3,493—an increase of $1,977 from 2001.
›
The cumulative impact of changes to the tax code over the same period increased household income by $1,900. Thus, rising fuels prices acted as a tax increase that fully offset the benefit of tax cuts.
4,000 3,500
3.00
$1,977 $1,900
Increased gas spending
1.50 1.00
2,500 2,000 1,500
1,000
0.50
500
-
2001 2002 2003 2004 2005 2006 2007 2008 Avg. Household Spending on Gasoline
Avg. Annual Gasoline Price
$/household
2.00
Savings from tax cuts
3,000
2.50
$/gal
›
12 Source: DOE, EIA, Annual Energy Review 2009; ORNL, Transportation Energy Data Book; SAFE Analysis
Energy Policy Framework Energy reform will require long-term investment in alternative technology and infrastructure. In the meantime, existing systems can be more efficient.
Short Term (0–5 Years) Meaningful change infeasible; however, investment and policy choices made today establish a framework for the future Medium Term (5–20 Years) Meaningful risk mitigation possible if policy choices made in the short-term promote aggressive implementation of proven solutions, including strong fueleconomy standards, increased access to conventional domestic energy resources, and responsible deployment of alternatives; RD&D must be ongoing to establish a technological foundation for the future Long Term (20+ Years) The tipping point: sustained (short and medium term) investments in infrastructure, technology, and innovation pay off, creating a post-oil transportation sector through widespread electrification
Electrification Overview Electrification of transportation is the best solution for sharply reducing U.S. oil dependence.
› Electricity is generated from a diverse portfolio of domestic fuels. › Electricity prices are stable. › The power sector has substantial spare capacity. › The network of infrastructure already exists. U.S. ELECTRICITY GENERATION BY FUEL, 2010
U.S. ELECTRICITY DEMAND BY SECTOR, 2010
49% COAL
38% RESIDENTIAL
22% NUCLEAR
37% COMMERCIAL/OTHER
17% NATURAL GAS
24% INDUSTRIAL
11% RENEWABLES
1% TRANSPORTATION
1% PETROLEUM
Source: EIA, AEO 2010
14
Electrification Overview: Power Sector A 2007 DOE study found that existing unused electrical generating capacity could power 158 million vehicles for up to 33 miles of driving per day.
›
PJM Interconnect: The 61 gWh of excess available capacity in a typical summer week could charge 62 million Nissan Leafs each night.
PJM CAPACITY AND LOAD (7-1, 7-2, 2009) 140 Wholesale Real Time Price Installed Capacity Available Capacity Load
140
4.0 100
Gigawatts
80
80
60
60 40 40 20
0
0 6:00 AM
12:00 PM
6:00 PM
12:00 AM
6:00 AM
12:00 PM
6:00 PM
$ Per Megawatt Hour
100
20
5.0
120
120
12:00 AM
Petroleum prices have exhibited significant volatility for the past several years. In contrast, retail electricity prices been generally stable. CHANGE IN RETAIL ENERGY PRICES (2000-PRESENT)
180 160
›
Crude Oil - WTI
Gasoline
Diesel
Electricity
3.0
Index: Jan 2000 2.0
1.0
2000
2002
2004
2006
2008
2010 15
Electrification Overview: Challenges While electrification has promise as an energy strategy, it can only succeed if GEVs are attractive to the mass market and can integrate into the grid.
› Batteries and Vehicles With the advent of lithium-ion battery technology, the largest obstacle to widespread consumer adoption of these vehicles will be cost, though performance and raw material supply chains are also important to consider. Need innovative business models, manufacturing scale in gen-1/2, and R&D for Gen-3.
› Charging Infrastructure A profitable business model for public charging points has not been reliably demonstrated, and we do not yet know how much public charging will be needed.
› Electric Power Sector Interface While “smart” charging will make electric vehicles an asset to the grid, “dumb” charging will make them a liability.
› Consumer Acceptance GEVs represent a significant shift in technology. In order to change mainstream consumer attitudes, GEVs must offer a compelling alternative to conventional IC engines on either cost or performance grounds. 16
Key Policy: Deployment Communities To overcome these challenges, lawmakers should initiate an ambitious program to support mass deployment in a limited number of communities. FEATURES AND ADVANTAGES OF DEPLOYMENT COMMUNITY APPROACH
›
Focusing on targeted regional deployment accomplishes at least three objectives:
1. 2. 3.
Demonstrate Proof of Concept for Consumers Facilitate Learning by Doing Maximize Investment Payoff
›
Grid-enabled vehicles require a network built on public-private coordination in order to thrive. Technology promotion has to be about more than throwing money at a problem.
›
The deployment community approach recognizes that a widespread national rollout without careful planning will reduce the likelihood that GEVs can penetrate the mass market, instead being relegated to niche market status (as has happened with hybrid vehicles, 1.6 million of which have been sold over the past 11 years out of a light-duty fleet of 250 million vehicles).
17
1111 19TH STREET NW SUITE 406 WASHINGTON, DC 20036
TEL: 202-461-2360 FAX: 202-318-8934 SECUREENERGY.ORG
Securing America’s Future Energy (SAFE) is an action-oriented, nonpartisan organization founded to deliver an urgent call to action: our nation’s dependence on oil puts our economy and national security at risk. Since its founding in 2004, SAFE has enlisted the support of prominent business and retired senior military leaders and employed innovative strategies addressing business and technology, politics and advocacy, and public education and media to help reshape the debate on energy policy.