PROBING THE PHOTODISSOCIATION REGION TOWARD HD 200775. S. R.. AND D. C. .... First, the data from diâ erent telescopes yield consis-. TABLE 1.
THE ASTROPHYSICAL JOURNAL, 489 : 758È765, 1997 November 10 ( 1997. The American Astronomical Society. All rights reserved. Printed in U.S.A.
PROBING THE PHOTODISSOCIATION REGION TOWARD HD 200775 S. R. FEDERMAN1,2 AND D. C. KNAUTH Department of Physics and Astronomy, University of Toledo, Toledo, OH 43606
DAVID L. LAMBERT Department of Astronomy, University of Texas, RLM 15.308, Austin, TX 78712-1083
AND B-G ANDERSSON1,2 Jet Propulsion Laboratory, California Institute of Technology, 4800 Oak Grove Drive, Pasadena, CA 91109 Received 1997 January 24 ; accepted 1997 June 24
ABSTRACT The illuminating source of the photodissociation region associated with the reÑection nebula NGC 7023 is HD 200775. We probed the foreground atomic and molecular material through diagnostics observed in absorption against the background star. Ground-based measurements of Na I, K I, and Ca II and of the molecules CH, CH`, C , and CN were analyzed in order to extract the physical conditions 2 for this material. In particular, estimates for gas density, gas temperature, and the Ñux of ultraviolet radiation were derived and compared with information obtained from maps of radio emission. The foreground material has lower density than the other portions of the photodissociation region ; the observed excitation of C , the observed column of C , and the columns of neutral sodium and potassium are 2 the extinction curve derived 2 for this line of sight is adopted. Future models of the reproduced when NGC 7023 nebula should include the e†ects associated with this extinction curve. The observed CN column density is larger than our predicted amount ; an additional contribution from the background molecular cloud is inferred. Subject headings : ISM : abundances È ISM : individual (NGC 7023) È ISM : molecules È reÑection nebulae È stars : individual (HD 200775) 1.
INTRODUCTION
minating source. The CN measurements at visible wavelengths that are described below are particularly relevant to these Ðndings. At infrared wavelengths, Lemaire et al. (1996) studied H emission from v \ 1È0 S(1) and S(2) lines at high spatial2 resolution and detected high-density Ðlaments. The peak brightness of the 1È0 S(1) line is consistent with models invoking ultraviolet excitation followed by infrared decays. The main focus of the ultraviolet studies involved grain characteristics ; the results are important ingredients for the analyses presented here. Little attention, however, has been given to probing the line of sight to the illuminating star. Here we present results from high-resolution measurements of absorption from interstellar atoms and molecules toward HD 200775, the illuminating source of NGC 7023. The physical conditions for the gas are revealed through studies of the relative populations of rotational levels for C (e.g., van Dishoeck & 2 Black 1982 ; Lambert, She†er, & Federman 1995) and of the chemistry involving CH, C , and CN (e.g., Federman et al. 2 estimates for gas density and 1994). These studies provide temperature and for the Ñux of dissociating ultraviolet radiation. Moreover, CH` and atomic absorption probe somewhat less dense gas (Cardelli, Federman, & Smith 1991), thereby yielding information on cloud structure along the line of sight. Such information for an inÐnitesimal pencil beam toward the illuminating source provides additional constraints for the models used in interpreting the radio and infrared data.
The illuminating source of a reÑection nebula a†ects the surrounding gas in a number of ways. For instance, although few ionizing photons are available to create an H II region, photons with energies between the Lyman limit and about 1100 A produce a photodissociation region around the star, a zone in which H and CO are destroyed 2 through absorption of ultraviolet photons (e.g., Sternberg & Dalgarno 1989). The photodissociation region (PDR) associated with NGC 7023 has been studied extensively at radio (Fuente et al. 1990, 1992, 1993, 1996 ; Rogers, Heyer, & Dewdney 1995), infrared (Lemaire et al. 1996), and ultraviolet wavelengths (e.g., Witt et al. 1992, 1993 ; Murthy et al. 1993). Rogers et al. (1995) analyzed H I and 13CO emission in order to describe the transition from atomic to molecular hydrogen. They used the correspondence between 13CO emission and H for dark clouds (Dickman 1978) to esti2 mate the distribution of H , and they concluded that the 2 not reproduce the molecular available models of PDRs do distributions very well. Through observations of 13C16O and 12C18O emission, Fuente et al. (1993) found that selective photodissociation of CO is occurring in NGC 7023 ; the more abundant isotopic variant shields itself more e†ectively than the rarer form does because the lines leading to photodissociation have larger optical depths. Fuente et al. also analyzed the distributions of CN and HCN and determined that the ratio of CN/HCN increases toward the illu-
2.
1 Guest Observer, McDonald Observatory, University of Texas at Austin. 2 Visiting Astronomer, Kitt Peak National Observatory, National Optical Astronomy Observatories, which are operated by the Association of Universities for Research in Astronomy, Inc., under cooperative agreement with the National Science Foundation.
DATA ACQUISITION AND REDUCTION
We used two systems in our study of absorption from interstellar species at visible wavelengths : the coude spectrograph on the 2.7 m telescope at McDonald Observatory and the coude feed telescope at Kitt Peak National 758
PHOTODISSOCIATION REGION TOWARD HD 200775 Observatory (KPNO). Three separate setups were employed in our high-resolution observations. At McDonald Observatory, during the period 1990È1992, single orders were imaged onto a Texas Instruments CCD with 15 km pixels. Interference Ðlters were used to block light from adjacent orders. Spectra were taken at four wavelength settings : CH` j4232/Ca I j4226, CH j4300, Na I D, and K I j7699. The spectral resolution, deÐned by the FWHM of lines from a Th-Ar hollow cathode lamp, was set at 2 km s~1. The wavelength scale for the CH`, Ca I, and CH measurements was deÐned by the Th-Ar spectra, and the scale was set by telluric features for the D lines (H O) and the K I 2 line (O ). Multiple exposures of HD 200775 were obtained 2 in order to reach Ðnal signal-to-noise ratios of 50È100. Multiorder spectra at a resolution of D3 km s~1 were acquired in 1993 at both sites. At McDonald Observatory, the ““ 2dcoude ÏÏ spectrograph on the 2.7 m telescope (Tull et al. 1995) was used to acquire spectra on interstellar C at 8760 A . The Texas Instruments CCD also served as 2the detector for these measurements. Since the C lines are quite weak, multiple exposures were necessary,2yielding a Ðnal signal-to-noise ratio of 600. At KPNO, the setup at the coude feed telescope included Camera 5, an echelle grism, and the Texas Instruments No. 5 CCD. The nearly complete spectral coverage in the blue allowed us to search for absorption from CN near 3874 A , Ca II H and K, CH jj3886, 4300, CH` jj3957, 4232, and Ca I j4226. Summed spectra typically had signal-to-noise ratios of 50. For both runs, the spectral resolution and wavelength scale were determined by lines from a Th-Ar comparison lamp. The raw images were reduced in the usual manner with IRAF procedures. Dark and bias frames were subtracted from each stellar image and Ñat-Ðeld frame. Cosmic-ray hits and scattered light were removed from each stellar image and Ñat Ðeld. The Ñat Ðelds were divided into the stellar
759
images to account for di†erences in pixel-to-pixel sensitivity. For orders containing interstellar features, pixels perpendicular to the dispersion axis were summed. The wavelength scales were set by Th-Ar comparison spectra that were taken several times each night. After correcting for Doppler motion, individual spectra taken throughout a run were combined. The combined spectra were normalized to unity and were used to measure the amount of interstellar absorption. The Ðnal spectra showing interstellar absorption appear in Figures 1, 2, and 3. The equivalent width, W , for a line was determined by a j Gaussian Ðt ; single Gaussians were adequate for all but the Na I D and K I lines. These Ðts also yielded an estimate of the Doppler parameter from the lineÏs FWHM, corrected for instrumental width. Each W was converted into a j column density utilizing curves of growth. Doppler parameters (b-values) were set at 1 km s~1 for all lines except those of CH` and Ca II, where a b-value of 2.5 km s~1 was used, and those for the bluest component(s) of Na I D, where the doublet ratio method (Munch 1968) with a ratio of 1.5 was used. These values are consistent with results of ultrahighresolution measurements of similar sight lines (e.g., Crane, Lambert, & She†er 1995 ; Crawford 1995). The oscillator strengths needed for the conversion into atomic column densities were taken from Morton (1991) ; the molecular data noted in our earlier papers (e.g., Federman et al. 1994) were adopted here. Table 1 lists our results acquired at blue wavelengths, and Table 2 displays the results for C . In Table 1, the results on v , W , and the b-value for the2 data acquired at KPNO LSR McDonald j and Observatory are presented. In addition, the W of CH j4300 taken at moderate spectral resolution j (Federman et al. 1994) and the derived column densities are shown. There are several points to note about the table listings. First, the data from di†erent telescopes yield consis-
TABLE 1 COMPILATION OF RESULTS FOR HD 200775 KPNO
LINE Na I D . . . . . . . . . . 1 N (Na I) . . . . . . . . . KTI . . . . . . . . . . . . . . .
MCDONALD
v LSR (km s~1)
W j (mA )
b (km s~1)
v LSR (km s~1)
W j (mA )
b (km s~1)
FEDERMAN ET AL. 1994 W j (mA )
N (cm~2)
... ... ... ... ... ... ... ... [2.7 [0.5 ... ]1.5 ]1.9 ... [2.1 [0.6 ... ]1.0 ]1.3 ]0.8 ...
... ... ... ... ... ... ... ... 80.5 ^ 3.5 45.1 ^ 2.8 ¹7.2 18.5 ^ 1.4 5.5 ^ 1.2 ... 7.5 ^ 1.1 4.4 ^ 0.8 ... 22.2 ^ 1.7 10.5 ^ 1.6 5.2 ^ 1.5 ...
... ... ... ... ... ... ... ... 5.3a 4.9a ... 2.7 1.0 ... 2.3 2.6 ... 2.5 2.3 1.4 ...
[3.7 [0.9 ]2.2 ... [2.0 [0.2 ]1.7 ... ... ... ... ]1.0 ... ... [1.0 ... ... ... ... ... ...
92.4 ^ 1.8 51.8 ^ 1.1 64.8 ^ 1.1 ... 4.5 ^ 0.6 9.5 ^ 0.5 4.6 ^ 0.5 ... ... ... ¹3.9 17.1 ^ 2.0 ... ... 7.7 ^ 1.3 ... ... ... ... ... ...
3.3 1.7 1.8 ... 0.9 0.3 0.4 ... ... ... ... 2.0 ... ... 1.9 ... ... ... ... ... ...
... ... ... ... ... ... ... ... ... ... ... 23.4 ^ 2.5 ... ... ... ... ... ... ... ... ...
(1.2 ^ 0.2) ] 1012 (1.4 ^ 0.1) ] 1012 (3.3 ^ 0.3) ] 1012 (5.9 ^ 0.8) ] 1012 (2.6 ^ 0.4) ] 1010 (5.8 ^ 0.3) ] 1010 (2.7 ^ 0.3) ] 1010 (1.1 ^ 0.1) ] 1011 (2.2 ^ 0.3) ] 1012 (1.5 ^ 0.1) ] 1012 ¹1.7 ] 1010 (3.2 ^ 0.2) ] 1013b (2.7 ^ 0.7) ] 1013c (3.2 ^ 0.2) ] 1013 (9.1 ^ 1.0) ] 1012b (9.9 ^ 1.8) ] 1012 (9.3 ^ 0.9) ] 1012 (7.9 ^ 1.0) ] 1012 (4.2 ^ 0.8) ] 1012 (3.7 ^ 1.2) ] 1012 (1.2 ^ 0.1) ] 1013
N (K I) . . . . . . . . . . CaT II K . . . . . . . . . . Ca II H . . . . . . . . . . Ca I . . . . . . . . . . . . . . CH j4300 . . . . . . . CH j3886 . . . . . . . N (CH) . . . . . . . . . . T j4232 . . . . . . CH` CH` j3957 . . . . . . N (CH`) . . . . . . . . T R(0) . . . . . . . . . CN CN R(1) . . . . . . . . . CN P(1) . . . . . . . . . N (CN)d . . . . . . . . . T a The Ca II lines are especially broad, probably indicating blends. This could cause the di†erence in N from the H and K lines. b Column density from weighted mean of measurements. c The column density was multiplied by 2 because only one of 2 levels was analyzed, but equal populations were assumed. d Total column density based on weighted average for N \ 1. T lies between 2.6 and 3.7 K. ex
760
FEDERMAN ET AL.
Vol. 489
FIG. 1.ÈSpectra showing absorption from atomic species. The lowest panel displays K I j7699 as a solid line, Na I D as a long-dashed line, and 1 red sides of the D lines Na I D as a short-dashed line. Note that the 2 overlap, indicating a doublet ratio near 1, while the blue sides show more absorption from D . For the blue component(s), a ratio of 1.5 is more 2 appropriate.
FIG. 2.ÈSpectra showing absorption from CH and CH` and from neutral Na and K. For the molecular absorption, the solid lines are from data taken at McDonald Observatory, and the dotted lines are the data from KPNO. Since the McDonald observations were acquired at higher resolution, the CH and CH` lines are deeper for these measurements.
tent values of v , W , and b for CH j4300, CH` j4232, LSRThej column densities listed in the last and Ca I j4226. column are based on weighted averages of the available measurements. Second, the two lines for CH, CH`, and CN
(N \ 1) give comparable column densities ; the total column densities used in our analysis are a weighted average of these determinations. Third, the results for the H and K lines of Ca II should give the same Ca II column density, but this may not be the case here. Unfortunately, the spectral resolution of the KPNO data is not high enough to discern multiple components in either line. As for the C results given in Table 2, the di†erences in 2 velocity are probably caused by the weakness of the absorption. Although only one line was detected for each rotational level, the upper limits on R(4) and R(6) are consistent with the detected Q lines. The derivation of the total column density of C included contributions from the levels J \ 8 2 and 10, as shown in the table. These contributions were obtained from an excitation temperature T \ T of ex 4,6 150 K (see Fig. 4). The blue data reveal some interesting trends in radial velocity. (The C lines are too weak for precise information about velocity.) 2The CH and CN lines have v of 1È2 km s~1, and a component of Na I and K I is LSR found at this velocity. This velocity agrees with that for the molecular cloud associated with NGC 7023, as revealed by radio emission lines (Feunte et al. 1990, 1993 ; Rogers et al. 1995). The neutral atomic lines also have components at D[1 and D[3 km s~1. The CH` lines appear to be associated with
TABLE 2 C RESULTS 2 Line
v LSR (km s~1)
W j (mA )
b (km s~1)
R(0) . . . . . . . . [1.4 1.09 (0.27) N(0) . . . . . . . . ... ... R(2) . . . . . . . . ]2.2 0.95 (0.21) Q(2) . . . . . . . . ... ... N(2) . . . . . . . . ... ... R(4) . . . . . . . . ... ¹0.41 Q(4) . . . . . . . . [0.3 0.70 (0.22) N(4) . . . . . . . . ... ... R(6) . . . . . . . . ... ¹0.41 Q(6) . . . . . . . . [1.8 0.69 (0.19) N(6) . . . . . . . . ... ... Q(8) . . . . . . . . ... ¹0.42 N(8) . . . . . . . . ... ... N(10)a . . . . . . ... ... N b ....... ... ... tot a An estimate. b Based on estimates for N(8) and N(10).
3.0 ... 0.6 ... ... ... 2.1 ... ... 2.4 ... ... ... ... ...
N (cm~2) (1.61 ^ 0.40) ] 1012 (1.61 ^ 0.40) ] 1012 (3.53 ^ 0.79) ] 1012 ... (3.53 ^ 0.79) ] 1012 ¹1.80 ] 1012 (2.07 ^ 0.65) ] 1012 (2.07 ^ 0.65) ] 1012 ¹1.95 ] 1012 (2.03 ^ 0.56) ] 1012 (2.03 ^ 0.56) ] 1012 ¹1.23 ] 1012 ¹1.23 ] 1012 9.84 ] 1011 1.18 ] 1013
No. 2, 1997
PHOTODISSOCIATION REGION TOWARD HD 200775
761
FIG. 4.ÈExcitation analysis for C . The theoretical results (van Dis2 kinetic temperaturesÈ20 and 45 hoeck & Black 1982) are shown for two KÈalong with the data ( Ðlled circles with error bars). The labels for the theoretical curves indicate the value for n p/I . c ir FIG. 3.ÈSpectra taken at KPNO showing absorption from CH, CH`, and CN. For CH and CH` absorption, the solid lines are of the CH BÈX (0, 0) and CH` AÈX (1, 0) bands ; the dotted lines are of the AÈX (0, 0) band for both molecules. The results for each band yield similar column densities (see Table 1), and therefore the presence of di†ering strengths for the CH and CH` lines arises solely from di†erent oscillator strengths. In the upper panel, the sloping continuum for the CH BÈX transition is due to a stellar feature.
the component at [1 km s~1. Since the Ca II lines appear at negative velocities only, calcium is not associated with the neutral/molecular component ; instead, it is severely depleted onto dust grains, a Ðnding consistent with the conclusions of Crinklaw, Federman, & Joseph (1994). The differences in velocity for the H and K lines may be caused by unresolved structure : the stronger K line shows signiÐcant absorption from the bluest component. A comparison of Figures 1, 2, and 3 reveals the di†erences in velocity structure among probes. 3.
ANALYSIS AND RESULTS
3.1. Molecular Excitation and Abundances The physical conditions in the gas can be derived from analyses of molecular excitation and synthesis (e.g., van Dishoeck & Black 1986 ; Federman et al. 1994). The conditions of most interest to us are gas density and temperature and the Ñux of ultraviolet radiation permeating the PDR in front of the star. The main observables are the relative populations of rotational levels in C and the column den2 sities of C and CN. The goal is to model the excitation of 2 C (van Dishoeck & Black 1982) and to Ðt the C and CN 2 2
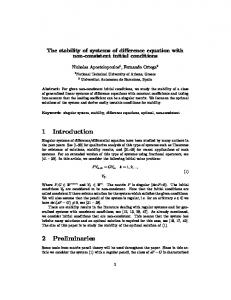
column densities by using a network of gas-phase reactions. [In principle, the excitation of CN may be used too (Black & van Dishoeck 1991). However, here the excitation temperature for CN is found to lie between 2.6 and 3.7 K, which, unfortunately, is indistinguishable from the temperature associated with the cosmic background radiation, and thus no information on physical conditions could be extracted from T (CN).] ex of C rotational levels is shown in The distribution 2 Figure 4, a plot of the population in level J relative to the amount in J \ 2 versus energy of the level in units of cm~1. The data are displayed with theoretical predictions for excitation (van Dishoeck & Black 1982) at two kinetic temperatures for the gas, namely, 20 and 45 K. The various curves represent the distributions expected for di†erent values of n p/I , where n is the density of colliding partc n(H ir ), p is the c cross section for collisional deners, n(H) ] 2 excitation, and I is the enhancement in the Ñux of infrared ir interstellar value. (The high-lying rotaradiation over the tional levels can be populated through collisions and photon pumping. The latter process involves absorption of infrared photons, leading to transitions between the ground vibrational level and the Ðrst excited electronic state, followed by radiative decays that return the molecules to various vibrational levels in the ground electronic state and Ðnally radiative cascades to the ground vibrational level.) The C data displayed in Figure 4 are most consistent with the 2theoretical predictions for kinetic temperatures between 20 and 45 K. The measurement of the R(0) line is not crossed by any of the theoretical predictions for T \ 45
762
FEDERMAN ET AL.
Vol. 489
K, thereby setting the upper bound. Our upper limit for absorption from the J \ 8 level places constraints on the value for n p/I ; in particular, the value must lie above c ir 6 ] 10~14. Appropriate maximum values are 2 ] 10~13 for 20 K and 1 ] 10~12 for 45 K. By using a value of 2 ] 10~16 cm2 for the de-excitation cross section (van Dishoeck & Black 1982) and setting I equal to 1.0, we Ðnd that n lies ir c between 300 and 550 cm~3 when we incorporate the factor of 1.8 reduction noted by van Dishoeck & Black (1982). For comparison with the chemical results, the density of hydrogen nuclei in all forms, n(H) ] 2n(H ), is needed. Since 2 n(H) B n(H ), this density is about 50% larger than n in 2 c di†use gas, and therefore we derive a value for the gas density, n, of 450È800 cm~3. In light of recent developments concerning C , these results may require some revision 2 (see ° 4). Another means of extracting density, temperature, and radiative Ñux involves analysis of molecular production. Here we follow the analysis of Federman et al. (1994) for C and CN chemistry ; the reaction rate coefficients and photo-2 dissociation rates are the same as those in our earlier work. The basic rate equations, in terms of column densities, are
manner. The situation is reminiscent of the case of HD 29647, whose sight line probes material in TMC-1 (e.g., Federman et al. 1994). Federman et al. surmised that a contribution to CN production from dark cloud chemical schemes was necessary ; this conclusion seems to apply to the gas toward HD 200775 also. Fuente et al. (1993), based on their radio observations, saw an increase in the ratio of CN/HCN toward the star. The radio emission lines come from the molecular cloud being dissociated by HD 200775. This point, as well as the di†erences in the derived parameters from the two analysesÈexcitation and chemistryÈ described here, is treated in more detail in ° 4.
k x(C`)anN(CH) 1 N(C ) \ , 2 G(C ) ] k x(O)n ] k x(N)n 2 2 3
In this expression, N (H) is the total proton column density, N(H I) ] 2N(Htot), A(X) is the elemental abundance 2 (Anders & Grevesse 1989), a(X) is the radiative recombination rate constant (Pequinot & Aldrovandi 1986), and n is electron density. The factor A(X) includes depletion ontoe grains, which, for alkalis, is about a factor of 0.25 (Phillips, Pettini, & Gondhalekar 1984). The photoionization rates for Na I and K I are based on the measured ionization cross sections of Hudson & Carter (1967a) and of Hudson & Carter (1965, 1967b), Marr & Creek (1968), and Sandner et al. (1981), on the radiation Ðeld of Draine (1978), and on the grain extinction derived by Walker et al. (1980) and Buss et al. (1994). Many of the uncertain parameters in equation (3) can be eliminated when the ratio for N(Na I) to N(K I) is considered. This ratio can be written as
(1)
N(CN) \
[k x(N)N(C ) ] k x(N)N(CH) ] k x(C`)aN(NH)]n 3 2 4 5 . G(CN) ] k x(O)n 6 (2)
In these equations, N(X) and x(X) are the column density and fractional abundance relative to the total number of protons for species X, k is the rate coefficient for reaction i, i and G(X) is the photodissociation rate that includes the e†ects of grain extinction. The parameter a provides a way to estimate the amount of C` converted into neutral atoms and CO (see Federman & Huntress 1989). As noted in Federman et al. (1994), a is a function of q , the grain uv sight line extinction at far-ultraviolet wavelengths. For the toward HD 200775, q was set at 4.05, a value that takes into account the rapiduvincrease in extinction at short wavelengths (Walker et al. 1980 ; Buss et al. 1994). As for the column density for NH, it was estimated by scaling the results of Meyer & Roth (1991) for the gas toward f Persei by the ratio of CH columns. The chemical analysis resulted in constraints on the acceptable values for n, T , and I , where I is the enhanceuv over the uv average interment in the local ultraviolet Ñux stellar Ñux (e.g., Draine 1978). We used the observed N(CH) (3.2 ] 1013 cm~2) and N(C ) (1.2 ] 1013 cm~2) in deriving the expected columns of C 2 and CN. Since variations in T 2 had little e†ect on the outcome, T was set at 30 K. For C , 2 we derived a column density of D1.3 ] 1013 cm~2 for densities between 150 and 500 cm~3 and values for I of 1 and uv N(C ) is 3, respectively. The fact that the predicted value for 2 is not dependent on n/I indicates that photodissociation uv the dominant destruction process. This is not surprising for gas associated with a PDR. These values for n and I lead uv to a value for N(CN) of D2.5 ] 1012 cm~2, which is signiÐcantly less than our measured value of 1.2 ] 1013 cm~2. We could not Ðnd any combination of parameters that reproduced both observed column densities in a satisfactory
3.2. Neutral Atoms The Na I and K I absorption arises from a minor ionization stage for the elements Na and K ; the most abundant ions are Na II and K II. This fact simpliÐes the analysis based on ionization balance. The column density of neutral species X is given by N (H)A(X)a(X)n e. N(X) \ tot G(X)
C DC
A(Na) N(Na I) \ A(K) N(K I)
DC
a(Na I) a(K I)
(3)
D
G(K I) , G(Na I)
(4)
where A(Na)/A(K) is 16 and a(Na I)/a(K I) is 0.95. Before analyzing the atomic absorption toward HD 200775, where the sight line has a nontypical extinction curve, we checked the validity of our expressions by examining the results for f Per. Curves of growth for the Na I doublet at 3302 A (data from Crutcher 1975) and for K I j7699 (Hobbs 1974) yield respective column densities of (1.1 ^ 0.1) ] 1014 cm~2 and (1.8 ^ 0.2) ] 1012 cm~2. (A b-value of 1 km s~1 was adopted here as well.) The value for q over the wavelength interval 912È2500 A is B1.7 when uv extinction curve of Code et al. (1976) and forward scatthe tering is considered. For this optical depth, the photoionization rates for Na I and K I are 4.5 ] 10~12 s~1 and 1.5 ] 10~11 s~1, respectively. The predicted ratio for N(Na I)/N(K I) is 51, which is similar to the observed ratio of 61 ^ 9. The extinction curve for the sight line to HD 200775 is lower than a typical one above 1200 A , but it is above the typical one at shorter wavelengths (Walker et al. 1980 ; Buss et al. 1994). The average di†erences in optical depth suggest that the photoionization rates above 1200 A need to be multiplied by 10, while at shorter wavelengths, the multiplicative factor is 0.25. These di†erences translate into Na I
No. 2, 1997
PHOTODISSOCIATION REGION TOWARD HD 200775
and K I photoionization rates of 3.4 ] 10~11 s~1 and 1.1 ] 10~10 s~1, respectively. We note that although there is more far-ultraviolet extinction, and hence smaller molecular photodestruction rates, toward HD 200775, the photoionization rates are larger than typical ones because the extinction is below the typical extinction curve over a larger wavelength interval. The larger amounts of photoionization lead to smaller columns of neutral atoms, as is observed to be the case (see following paragraph and Table 1). The predicted column density ratio becomes 49 and agrees nicely with the observed ratio of 54 ^ 9 toward HD 200775. The good correspondences between the predicted and observed ratios indicate that equation (4), with the adopted photoionization rates, is a fair representation for the line of sight. A more insightful comparison involves the predictions for the ratio in column densities for a speciÐc atom for the sight lines toward f Per and HD 200775. This comparison allows us to probe potential di†erences in depletion onto grains and electron density, n (see eq. [3]). The total proton e column densities are needed for this comparison. For the direction toward f Per, Savage et al. (1977) give N (H) \ 1.6 ] 1021 cm~2, and for the sight line toward HD tot 200775, we use N (H) \ (2.3 ^ 0.3) ] 1021 cm~2, which is based tot on the independent analyses of Witt & Cottrell (1980) and Buss et al. (1994). The values for n, T , and I toward f PerÈ700 cm~3, 30 K, and 1Èare from the uvanalyses of Federman et al. (1994). The chemical results presented above are used for the gas toward HD 200775. With this information, the predicted ratios (HD 200775/f Per) are the same for the two neutral species, 0.04 ^ 0.01. These predictions agree very nicely with the observed ratios of 0.05 ^ 0.1 and 0.06 ^ 0.01 for Na I and K I, respectively. 4.
DISCUSSION
Our analyses rely on a number of parameters, some of which are not well known. Here we consider the e†ects these have on our conclusions. In particular, we discuss the changes resulting from di†erent oscillator strengths for the AÈX transition in C , from di†erent collisional deexcitation cross sections2 for C , from the fact that I need 2 variations in the electron ir not be the same as I , and from uv density, n . e Until recently, two sets of band oscillator strengths for AÈX transitions in C were available. Experimental results for f yielded values2of B(1.0 ^ 0.1) ] 10~3 (Erman et al. 198220 ; Bauer et al. 1985), while a theoretical computation obtained f \ 1.44 ] 10~3 (Langho† et al. 1990). We used 20 the experimental f-value in deriving N(C ) and in the 2 analysis of C excitation. Additional astronomical and 2 laboratory data now clarify the situation somewhat. In their analysis of absorption from the DÈX (0, 0) band at 2313 A , Lambert et al. (1995) inferred a value of (1.23 ^ 0.16) ] 10~3 for f from a presumably accurate 20 the amount of absorption in f-value for the DÈX band and each band for the di†use clouds toward f Oph. After accounting for nonradiative transitions between excited states in C , Erman & Iwamae (1995) obtained f \ (1.36 2 20 ^ 0.15) ] 10~3. These recent determinations suggest a value of B1.3 ] 10~3 for the AÈX (2, 0) band. A 30% increase in the f-value would lower our column density by a comparable amount because the C lines are quite weak. However, a 2 larger f-value would increase n, the total gas density derived from excitation, by a corresponding amount, yet the lower
763
column density would suggest a decrease in the estimate for n from chemical considerations, thereby widening the gap between the two determinations. Since N(C ) is proportion2 al to n/I , an enhanced Ñux of ultraviolet radiation would uv produce the same chemical e†ect. A change in either parameter, in conjunction with the lower value for N(C ), would 2 lead to less CN production via di†use cloud chemistry and would indicate a greater CN contribution from the molecular core (i.e., dark cloud chemistry). The changes described here also bear on earlier analyses, such as Federman et al. (1994) ; use of the revised f-value for C would weaken the 2 nice correspondences found in this earlier study. A further complication involving C excitation has to do 2 with the appropriate set of collisional de-excitation cross sections. We adopted the cross section of van Dishoeck & Black (1982), yet Lavendy et al. (1991) and Robbe et al. (1992) obtained cross sections about a factor of 2 larger. Use of the larger cross sections would lower the estimate for n, in a sense compensating for the adoption of the larger oscillator strengths. As noted by Federman et al. (1994), consistent results involving C excitation and the chemical 2 scheme for C and CN production are still possible by 2 modifying several poorly known rate constants. However, the correspondences among density estimates from C , CN, 2 and CO excitation would be worse. The two estimates for gas density derived in ° 3 can be made consistent by allowing the enhancement factors I ir and I to have di†erent values. Since the extinction curve uv for the sight line to HD 200775 is lower than a typical curve at wavelengths beyond 1200 A and higher at shorter wavelengths, di†erent values are very likely. These di†erences were noted above in the discussion of photodissociation and photoionization rates. Less extinction than is typical at long wavelengths leads to a value for I that is larger than ir results (with the the value for I . In particular, consistent uv original f-values and cross sections) are possible with I of ir about 3 or 4. Then the n estimate becomes 100È200 cm~3, which compares with 150I cm~3 from the chemical analysis. If I were greater uv than 1, I would have to be uv ir increased accordingly. We can conclude from this discussion that the gas density is probably known to within a factor or 2. The values for I and I can be used to estimate the ir distance that the uvforeground material, probed by our observations, is from the star. Buss et al. (1994) measured a Ñux at 1050 A of 5 ] 10~13 ergs cm~2 s~1 A ~1 for HD 200775. With an interstellar Ñux of 2.65 ] 10~6 ergs cm~2 s~1 A ~1 (about 50% larger than the value from Draine 1978) and a distance to the star of 600 pc (Hillenbrand et al. 1992), we derive a range of 1È2 pc for the distance between gas and star. This range is based on an optical depth of 4 for grain extinction in the foreground material. Similarly, the use of I \ 6.35 and J \ 6.10 for HD 200775 (Hillenbrand et al. 1992), corrected for extinction, and the interstellar infrared Ñux (see van Dishoeck & Black 1982) yields a distance of D1 pc. These distance estimates are consistent with results from H infrared emission. In particular, Martini, Sellgren, & 2 (1997) suggested that the infrared emission arose from Hora absorption of ultraviolet photons with a Ñux 103È104 times the average interstellar value. The H emission comes from 2 Ðlaments approximately 0.1È0.2 pc from HD 200775. Our results indicate that the Ñux at 0.1È0.2 pc from the star is 300È1200 times the average interstellar Ñux.
764
FEDERMAN ET AL.
A worthwhile comparison involves our derived gas density for the material in front of HD 200775 with other determinations. Witt & Cottrell (1980) obtained a value of D245 cm~3 from their estimate for E(B[V ) of 0.44 mag, the ratio of N (H)/E(B[V ) (Bohlin, Savage, & Drake tot 1978), and an estimate for the extent of the material in front of the star. Witt et al. (1982) found an average density of 400 cm~3 from the amount of ultraviolet scattering by dust ; they suggested that the density varied from about 300 cm~3 near the edge of the nebula to 500 cm~3 near the star. The agreement between our results and those of A. N. Witt and colleagues is reassuring in light of the uncertainties noted above for our analysis and in the estimate of Witt et al. (1982) for the extent of the foreground material. Furthermore, Rogers et al. (1995) used H I 21 cm emission to derive an average density of 34 cm~3 ; this lower estimate is not unexpected because inclusion of the purely atomic gas (Na I, K I, and Ca II) seen at negative velocities would lower the estimate for density. Analysis of radio emission lines yields a density for the molecular cloud associated with NGC 7023. Elmegreen & Elmegreen (1978) derived a value of 600 cm~3 by using 13CO measurements with the conversion factor to H column density of Dickman (1978). Similarly, Watt et al.2 (1986) found a density of 860 cm~3 for interclump gas and 5.3 ] 104 cm~3 in a dense clump. The far-infrared lines of O I and C II arising from the PDR (Chokshi et al. 1988) indicate a density of 4.4 ] 103 cm~3. Rogers et al. (1995) found densities of D104 cm~3 in clumps within the molecular cavity (PDR). Their estimate was based on C18O observations and the conversion factor to N(H ) of Frerking, 2 Langer, & Wilson (1982). They also determined the peak density within the PDR from H I emission, obtaining a value of about 2.3 ] 103 cm~3 that is consistent with other probes of the PDR (e.g., Chokshi et al. 1988). Most recently, Fuente et al. (1996), who analyzed emission from HCO`, obtained densities of a few 105 cm~3 in the Ðlaments associated with H emission at infrared wavelengths (Lemaire et al. 1996). As2 expected, the radio emission lines probe the more dense, primarily molecular gas behind the star. Although the correspondence between the Na I and K I results for HD 200775 relative to those for f Per is quite good, it is somewhat surprising that no di†erences in depletion level or ionization fraction (x \ n /n) are needed to e is similar along explain the observed ratios. Since eN (H) tot the two sight lines, there may be little di†erential depletion to consider. The chemical results for the gas toward HD 200775 are based on a reduction in the abundance of C`, the main contributor to x in di†use gas. The abundance of e 15% of that toward f Per. A C` is predicted to be only possible cause for the apparent inconsistency in the C` abundance is based on the fact that the atomic gas is more widely distributed than the molecular material. The existence of additional velocity components seen in the atomic absorption lines is one manifestation of this suggestion. The value for x is expected to be larger in the more widely e dispersed ““ di†use ÏÏ atomic gas ; our conclusion that the CN abundance indicates a contribution from the molecular core of the cloud is consistent with this premise. The nebulaÏs near-infrared emission includes the features called unidentiÐed infrared bands (e.g., Cesarsky et al. 1996 ; Laureijs et al. 1996). The emission is attributed to very small grains and polycyclic aromatic hydrocarbons (PAHs). The PAH molecules may also be the source of the di†use inter-
Vol. 489
stellar bands seen at visible wavelengths (see Snow et al. 1995), and they could a†ect the ionization balance in di†use gas (Lepp et al. 1988). Snow et al. (1995) examined the suggestion that PAH` may be the carriers of the di†use interstellar bands. Their analysis yielded the best conditions for a large abundance of PAH` : a Ñux 10È100 times the average interstellar Ñux and a gas density of 100È1000 cm~3. Our modeling e†orts reveal that the radiation Ðeld permeating the foreground gas is much weaker than the necessary range, a conclusion consistent with the fact that the di†use bands are weak or absent toward HD 200775 (see Snow et al. 1995). Lepp et al. (1988) modeled the e†ects of PAHs on the ionization balance in di†use gas. Their results suggest that abundances are enhanced for neutral species with ionization potentials less than hydrogenÏs. Since we compared ratios in our analysis, the e†ects of including PAHs in the analysis should be minimal. We detected an appreciable amount of CH` toward HD 200775. Its lines appear at bluer wavelengths than those of CH and CN (see Table 1). Since there are atomic components with similar velocities, the CH` absorption arises from primarily atomic gas. In terms of total column densities, the ratios N(CH`)/N(CH) and N(CN)/N(CH) lie near the middle of the plot presented by Cardelli et al. (1990). A more meaningful comparison involves the CH associated with CH`. The spectra shown in Figure 2 do not reveal any CH absorption above the noise at the velocity of the CH` line. The 2 p limits for CH indicate that N(CH) is less than or equal to 4 ] 1012 cm~2, and the column of CH associated with CH` is ¹0.43N(CH`), a value that is similar to the results for several other sight lines (see Federman, Welty, & Cardelli 1997). In other words, the CH` results for HD 200775 are not very di†erent from those for other sight lines. We were not able to reproduce simultaneously the amounts of C and CN with our chemical schemes. It is likely that the2 ““ excess ÏÏ amount of CN arises from dark cloud chemistry occurring in the molecular core, as previously inferred by Nercessian, Benayoun, & Viala (1988), van Dishoeck & Black (1989), and Federman et al. (1994) when modeling the material in front of HD 29647. This suggestion for the CN in the foreground material of NGC 7023 is consistent with maps obtained in radio lines of CN and HCN. Fuente et al. (1993) found an increase in the ratio of N(CN) to N(HCN) as they mapped material closer to HD 200775. Since the photodissociation rate for HCN is greater than the one for CN (van Dishoeck 1987), this result is not unexpected. We believe that the ““ excess ÏÏ CN observed toward the star comes from the destruction of HCN, which is synthesized under the conditions found for the molecular cloud (see above). 5.
FINAL REMARKS
We have presented the Ðrst chemical results for foreground material associated with the PDR in NGC 7023. Our main conclusions are that the kinetic temperature for the gas is D30 K, that the gas density is B100È200 cm~3, and that the Ñux of visible/infrared radiation is enhanced over the interstellar value and to a larger extent than the ultraviolet Ñux is, the last point being a consequence of the extinction curve for the line of sight. Our density estimates are similar to ones obtained from grain absorption and scattering in front of the star (Witt & Cottrell 1980 ; Witt et al. 1982). Uncertainties in our results arise because several
No. 2, 1997
PHOTODISSOCIATION REGION TOWARD HD 200775
important parameters, including the C de-excitation cross 2 sections, are not well characterized. E†ects associated with the background molecular cloud were also noted ; these include severe depletion of Ca II in the velocity component associated with molecular gas and an enhanced abundance for CN from HCN photodissociation. The conditions associated with the molecular cloud (n D 104 cm~3) are conducive for production of HCN. Our study of the lower density portion of the PDR provides additional constraints for models based on the radio and infrared data ; these constraints include the acceptable range in density and temperature and the appropriate extinction law. Further improvements in our understanding of the lower density
765
material are possible by combining the present analyses with results from diagnostics measured at far-ultraviolet wavelengths, such as neutral carbon, CO, and H . We are 2 acquiring the necessary data through observations with the STIS on the Hubble Space Telescope. We will use the present results as a starting point in a reÐned, comprehensive modeling e†ort that incorporates the complete set of data. This research was performed in part at the Jet Propulsion Laboratories, California Institute of Technology, under contract to the National Aeronautics and Space Administration. We thank John Black for his helpful suggestions.
REFERENCES Anders, E., & Grevesse, N. 1989, Geochim. Cosmochim. Acta, 53, 197 Laureijs, R. J., et al. 1996, A&A, 315, L313 Bauer, W., Becker, K. H., Hubrich, C., Meuser, R., & Wildt, J. 1985, ApJ, Lavendy, H., Robbe, J. M., Chambaud, G., Levy, B., & Roue†, E. 1991, 296, 758 A&A, 251, 365 Black, J. H., & van Dishoeck, E. F. 1991, ApJ, 369, L9 Lemaire, J. L., Field, D., Gerin, M., Leach, S., Pineau des Foreüts, G., Bohlin, R. C., Savage, B. D., & Drake, J. F. 1978, ApJ, 224, 132 Rostas, F., & Rouan, D. 1996, A&A, 308, 895 Buss, R. H., Allen, M., McCandliss, S., Kruk, J., Liu, J.-C., & Brown, T. Lepp, S., Dalgarno, A., van Dishoeck, E. F., & Black, J. H. 1988, ApJ, 329, 1994, ApJ, 430, 630 418 Cardelli, J. A., Federman, S. R., & Smith, V. V. 1991, ApJ, 381, L17 Marr, G. V., & Creek, D. M. 1968, Proc. R. Soc. London, A304, 233 Cardelli, J. A., Suntze†, N. B., Edgar, R. J., & Savage, B. D. 1990, ApJ, 362, Martini, P., Sellgren, K., & Hora, J. L. 1997, ApJ, 484, 296 551 Meyer, D. M., & Roth, K. C. 1991, ApJ, 376, L49 Cesarsky, D., Lequeux, J., Abergel, A., Perault, M., Palazzi, E., Madden, S., Morton, D. C. 1991, ApJS, 77, 119 & Tran, D. 1996, A&A, 315, L305 Munch, G. 1968, in Nebulae & Interstellar Matter, ed. B. M. Middlehurst Chokshi, A., Tielens, A. G. G. M., Werner, M. W., & Castelaz, M. W. 1988, & L. H. Aller (Chicago : Univ. Chicago Press), 365 ApJ, 334, 803 Murthy, J., Dring, A., Henry, R. C., Kruk, J. W., Blair, W. P., Kimble, R. A., Code, A. D., Davis, J., Bless, R. C., & Hanbury Brown, R. 1976, ApJ, 203, & Durrance, S. T. 1993, ApJ, 408, L97 417 Nercessian, E., Benayoun, J. J., & Viala, Y. P. 1988, A&A, 195, 245 Crane, P., Lambert, D. L., & She†er, Y. 1995, ApJS, 99, 107 Pequignot, D., & Aldrovandi, S. M. V. 1986, A&A, 161, 169 Crawford, I. A. 1995, MNRAS, 277, 458 Phillips, A. P., Pettini, M., & Gondhalekar, P. M. 1984, MNRAS, 206, 337 Crinklaw, G., Federman, S. R., & Joseph, C. L. 1994, ApJ, 424, 784 Robbe, J. M., Lavendy, H., Lemoine, D., & Pouilly, B. 1992, A&A, 256, 679 Crutcher, R. M. 1975, ApJ, 202, 634 Rogers, C., Heyer, M. H., & Dewdney, P. E. 1995, ApJ, 442, 694 Dickman, R. L. 1978, ApJS, 37, 407 Sandner, W., Gallagher, T. F., SaÐnya, K. A., & Gounard, F. 1981, Phys. Draine, B. T. 1978, ApJS, 36, 595 Rev., A23, 2732 Elmegreen, D. M., & Elmegreen, B. G. 1978, ApJ, 220, 510 Savage, B. D., Bohlin, R. C., Drake, J. F., & Budich, W. 1977, ApJ, 216, 291 Erman, P., & Iwamae, A. 1995, ApJ, 450, L31 Snow, T. P., Bakes, E. L. O., Buss, R. H., & Seab, C. G. 1995, A&A, 296, Erman, P., Larsson, M., Mannfors, B., & Lambert, D. L. 1982, ApJ, 253, L37 983 Sternberg, A., & Dalgarno, A. 1989, ApJ, 338, 197 Federman, S. R., & Huntress, W. T. 1989, ApJ, 338, 140 Tull, R. G., MacQueen, P. J., Sneden, C., & Lambert, D. L. 1995, PASP, Federman, S. R., Strom, C. J., Lambert, D. L., Cardelli, J. A., Smith, V. V., 107, 251 & Joseph, C. L. 1994, ApJ, 424, 772 van Dishoeck, E. F. 1987, in IAU Symp. 120, Astrochemistry, ed. M. S. Federman, S. R., Welty, D. E., & Cardelli, J. A. 1997, ApJ, 481, 795 Vardya & S. P. Tarafdar (Dordrecht : Reidel), 51 Frerking, M. A., Langer, W. D., & Wilson, R. W. 1982, ApJ, 262, 590 van Dishoeck, E. F., & Black, J. H. 1982, ApJ, 258, 533 Fuente, A., Marti n-Pintado, J., Cernicharo, J., & Bachiller, R. 1990, A&A, ÈÈÈ. 1986, ApJS, 62, 109 237, 471 ÈÈÈ. 1989, ApJ, 340, 273 ÈÈÈ. 1993, A&A, 276, 473 Walker, G. A. H., Yang, S., Fahlmann, G. G., & Witt, A. N. 1980, PASP, Fuente, A., Marti n-Pintado, J., Cernicharo, J., Brouillet, N., & Duvert, G. 92, 411 1992, A&A, 260, 341 Watt, G. D., Burton, W. B., Choe, S.-U., & Liszt, H. S. 1986, A&A, 163, 194 Fuente, A., Marti n-Pintado, J., Neri, R., Rogers, C., & Moriarty-Schieven, Witt, A. N., & Cottrell, M. J. 1980, ApJ, 235, 899 G. 1996, A&A, 310, 286 Witt, A. N., Petersohn, J. K., Bohlin, R.C., OÏConnell, R. W., Roberts, Hillenbrand, L. A., Strom, S. E., Vrba, F. J., & Keene, J. 1992, ApJ, 397, 613 M. S., Smith, A. M., & Stecher, T. P. 1992, ApJ, 395, L5 Hobbs, L. M. 1974, ApJ, 191, 381 Witt, A. N., Petersohn, J. K., Holberg, J. B., Murthy, J., Dring, A., & Henry, Hudson, R. D., & Carter, V. L. 1965, Phys. Rev., 139, A1426 R. C. 1993, ApJ, 410, 714 ÈÈÈ. 1967a, J. Opt. Soc. Am., 57, 651 Witt, A. N., Walker, G. A. H., Bohlin, R. C., & Stecher, T. P. 1982, ApJ, ÈÈÈ. 1967b, J. Opt. Soc. Am., 57, 1471 261, 492 Lambert, D. L., She†er, Y., & Federman, S. R. 1995, ApJ, 438, 740 Langho†, S. R., Bauschlicher, C. W., Rendell, A. P., & Kormornicki, A. 1990, J. Chem. Phys., 92, 300