A survey of all 1000 spectroheliograms in the Skylab spectroheliograph plate ... 2. OBSERVATIONS. To test the above conjecture, we have surveyed all of the.
THE ASTROPHYSICAL JOURNAL, 494 : 450È452, 1998 February 10 ( 1998. The American Astronomical Society. All rights reserved. Printed in U.S.A.
THE NEON-TO-MAGNESIUM ABUNDANCE RATIO AS A TRACER OF THE SOURCE REGION OF PROMINENCE MATERIAL D. S. SPICER NASA Goddard Space Flight Center, Code 930, Greenbelt, MD 20771 ; spicer=gauss.gsfc.nasa.gov
U. FELDMAN E. O. Hulburt Center for Space Research, US Naval Research Laboratory, Code 7608, Washington, DC 20735
K. G. WIDING E. O. Hulburt Center for Space Research, US Naval Research Laboratory, Code 7674, Washington, DC 20735
AND M. RILEE NASA Goddard Space Flight Center, Code 930, Greenbelt, MD 20771 Received 1997 June 16 ; accepted 1997 September 18
ABSTRACT A survey of all 1000 spectroheliograms in the Skylab spectroheliograph plate collection was made to identify prominences above the limb and prominence-like features. The Ne/Mg abundance ratios obtained from the measurements have been determined from relative intensities of Ne VI and Mg VI lines at 400 Ó of seven prominences and prominence-like features observed above the solar limb. The derived abundance ratios have values intermediate between the photosphere and corona, while none are as low as the ratio of 0.7 expected in the corona, which implies that the material found in prominences is photospheric in origin. The signiÐcance of these results for the formation of prominences is brieÑy discussed. Subject headings : Sun : abundances È Sun : corona È Sun : magnetic Ðelds È Sun : prominences 1.
INTRODUCTION
Ó spectral range only a few strong lines are typically seen, such as He I j584 and He II j304. There are fewer cases hot enough to show Ne VII j465, and fewer still that show coronal lines such as Mg IX j368 formed at 1 ] 106 K. Requirements for selection in the present study were the following : (1) The event had to be above the limb to avoid the bright background of the solar disk. (2) The prominence images had to be bright enough to show useful intensities in the main diagnostic lines of Ne VI and Mg VI. From a list of about 10 examples, seven were traced with the PDS photometer, and the resulting photographic densities were converted to relative intensities using appropriate H and D calibration curves. The aim of the present investigation is to use the measured relative abundances in prominences as a tracer of the source region of the prominence material. To do this we use the Ne/Mg abundance ratio as the tracer, noting that when this ratio is 3.2È3.4, the material is photospheric, but when the ratio is D0.7, the material is coronal. In previous work we showed how the Ne/Mg abundance ratio could conveniently be estimated from line ratios of Ne VI compared with Mg VI in the overlapping multiplets at 400 Ó. The starting point of this method is the basic equation for the spectral line intensities written in the form N(element) N2 ds e \ Q \ 0.885 N(hydrogen) dT I(k ] 1)j(cm) 1 ] ; N /N i g . (1) ] 1022 () /u ) / G(T )dT A/; A ie i wl Here SN2 ds/dT T is the di†erential emission measure and is a generale function of temperature. The quantities on the right side of the equation involve atomic collisional and radiative rates and the ionization equilibria ; they are presented and explained in Widing, Feldman, & Bhatia (1986), where the observations and analysis of an eruptive prominence were given.
The magnetic Ðelds that make up solar prominences are known to support up to 1016 g of material at altitudes of order 105 km or more. The origin of this material has always been controversial. There are two prevalent explanations : one is that material condenses from the surrounding coronal plasma, while the other evokes a siphon e†ect that brings material up from the photosphere. Both conjectures su†er observationally (Tandberg-Hanssen 1996). In the case of the condensation model, 1016 g of material represents all or almost all of the material found in the corona. In addition, it is not clear how hot coronal material can be transported efficiently with the necessary mass Ñuxes from the outside of magnetic structure into the center of the structure on the timescales observed for prominence formation. In the case of the siphon model, no one has demonstrated that a siphon can actually work under conditions found in the solar atmosphere. In either case, condensing plasma must be trapped within the magnetic structure to prevent it from free-falling back to the photosphere, which implies that there needs to be either a dip in the magnetic Ðeld or a topologically closed or partially closed magnetic Ðeld preexisting in the magnetic conÐguration that allows the condensing or siphoning material to be stably stored in an exponential atmosphere. To eliminate one of these models, we believe it is reasonable to argue that a condensation model would predict that prominence material has coronal abundances, while a siphon model should have abundances closer to those found in the photosphere. 2.
T U
OBSERVATIONS
To test the above conjecture, we have surveyed all of the 1000 spectroheliograms in the Skylab plate collection for prominences above the limb and prominence-like features. From previous experience with Skylab data, it was known that prominences are relatively cool, so that in the 300È600 450
NEON-TO-MAGNESIUM ABUNDANCE RATIO
451
For the case when two ions are formed at the same temperature, e.g., Ne VI (T \ 4.3 ] 105 K) and Mg VI (T \ 4.35 ] 105 K), according to Arnaud & RothenÑug (1985), the emission measures will be the same and will cancel each other out if we use the above equation to form the ratio of a Ne VI line to one of Mg VI. This then gives an estimate of the element abundance ratio : Ne/Mg \ 1.27I(Ne VI j401.14)/I(Mg VI j400.68) . (2) This equation was derived for an assumed electron density of 1010 cm~3, but the abundance ratio is not strongly dependent on the exact value employed. Another line ratio that may be used is Ne/Mg \ 0.687/[I(bl j403.32)/I(Ne VI j401.94) [ 0.208] . (3) The lines j403.32 and Ne VI j401.94 are usually the two strongest in the line group, and most of the abundance ratios in the prominence sample have been derived from this pair. The line at 403.32 Ó is an almost perfect blend of Ne VI j403.26 and Mg VI j403.32, and the strength of the blend will depend on the Ne/Mg abundance ratio. The e†ect of changes in the Ne/Mg abundance ratio on the Ne VIÈMg VI line pattern at 400 Ó is apparent by visual inspection. Exposure 3A-045 in the top frame of Figure 1 shows the line pattern when the Ne/Mg ratio is approximately 3 and close to the abundance ratio in the photosphere. In this case the Ne VI 401.94 line is the strongest line in the group and more than twice as strong as the blended component at 403.32 A. In addition, Ne VI j401.14 is twice as strong as the neighboring line Mg VI j400.68. On the other hand, when the Ne/Mg abundance ratio is small as in the corona, the line pattern is distinctly di†erent. The blended component at 403.32 Ó now becomes the strongest line in the group, with Mg VI j400.68 as the second strongest line. This situation is illustrated by the observations of the coronal feature shown in the bottom frame of Figure 1. From these ideas, relative intensities of the Ne VI and Mg VI lines at 400 Ó have been measured in spectroheliograms of seven prominences observed by Skylab, and Ne/Mg abundance ratios have been determined by applying equations (2) and (3). The line ratio measurements are given in Table 1, together with the resulting Ne/Mg abundance ratios, which are also presented in Figure 2 (Plate 13). For comparison the Ne/Mg abundance ratios in the photosphere (3.4) and in the corona (0.7) are also indicated. Inspection of the Ne/Mg abundance ratios in Figure 2 shows that two prominences have near-photospheric ratios, while the remaining Ðve have values intermediate between
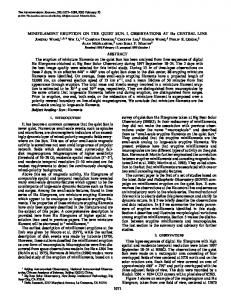
FIG. 1.ÈNe/Mg abundance ratios determined in seven prominences from the measured intensity ratios of the Ne VIÈMg VI blend at 403.32 Ó to Ne VI j401.94 and application of eq. (3). The corresponding values of the Ne/Mg abundance ratio observed in the corona and in the photosphere are shown for comparison.
the photosphere and corona. In none of the observations is the Ne/Mg abundance ratio as low as the value of D0.7 in the corona. This supports the conclusion that the source region of the prominence material is in the photosphere rather than in the corona. Observations of newly emerging Ñux loops (Sheeley 1995) show that they emerge with a photospheric Ne/Mg ratio \ 3.2, but after an indeterminate period, which seems to be of the order of a few days, the Ne/Mg ratio decreases gradually toward the coronal value B0.7. By analogy, we assume that this will happen in general whenever new photospheric material appears ; it will undergo a slow evolution toward coronal abundances. We therefore interpret the intermediate values of Ne/Mg represented in Table 1 as still representing photospheric material, but in the process of slow evolution toward coronal abundances. This is to be distinguished from the case when the source material is basically coronal to begin with, Ne/Mg ¹ 0.7. 3.
DISCUSSION
As is clear from our results, the siphon model is supported by the data. Nevertheless, as noted in the introduction, the siphon model has many warts. An alternative model (Rust & Kumar 1994 ; Priest, Van Ballegooijen, & MacKay 1996) is an emerging Ñux model. In this scenario,
TABLE 1 INTERMEDIATE VALUES OF Ne/Mg
EXPOSURE
I(j403.32)/I(Ne VI j401.94)
I(Ne VI j401.14)/ I(Mg VI j400.68)
3A-388 . . . . . . . . 3A-053 . . . . . . . . 3A-094-1 . . . . . . 3A-094-2 . . . . . . 3A-401 . . . . . . . . 3A-126 . . . . . . . . 3A-144 . . . . . . . .
0.42 0.65 0.59 0.43 0.53 0.70 0.58
2.1 ... 1.58 ... ... ... ...
Ne/Mg From Eq. (3)
From Eq. (2)
In Fig. 1
3.2 1.55 1.80 3.1 2.1 1.4 1.82
2.7 ... 2.0 ... ... ... ...
L ] * + ) ] K
452
SPICER ET AL.
Ñux emerging from the convection zone into the photosphere carries the coronal mass with it within a magnetic bottle formed beneath the photosphere by reconnection. This model is consistent with our results but is far less developed in comparison to the siphon model. While our results are based on Skylab data, data from SOHO could be used to verify our results, but more importantly to test between a siphon model and an emerging Ñux model by monitoring the rate at which the total mass and abundances change within a prominence. A siphon model requires a dip in the magnetic Ðeld into which the siphoned material can Ñow, thereby trapping it. Such a model requires material Ñow up both sides of the prominences
pooling in the trap, implying blueshifts within the legs of prominences. This further implies a temporal buildup of the mass trapped within a prominence. On the other hand, the mass trapped within a magnetic bottle due to emerging Ñux is all the mass available, and it will not increase but will rather slowly decrease since no magnetic bottle is a perfect trap. Hence, an emerging Ñux model would predict that weak redshifts would be measured at the legs of loop, while a siphon model would predict predominantly blueshifts. We thank Catherine Abbott for tracing the plates on the PDS and for preparing the Ðgures.
REFERENCES Arnaud, M., & RothenÑug, R. 1985, A&AS, 60, 425 Tandberg-Hanssen, E. 1995, The Nature of Solar Prominences (Boston : Priest, E. R., Van Ballegooijen, A., & Mackay, D. H. 1996, ApJ, 460, 530 Kluwer) Rust, D. M., & Kumar, A. 1994, Sol. Phys., 155, 69 Widing, K. G., Feldman, U., & Bhatia, A. K. 1986, ApJ, 308, 982 Sheeley, N. 1995, ApJ, 440, 884
PLATE 13
SPICER et al. (see 494, 451)
FIG. 2.ÈObserved variability of relative intensities in the Ne VI and Mg VI multiplets at 400 Ó. The top frame shows the line pattern when the Ne/Mg abundance ratio is approximately 3 (photospheric) compared in the bottom frame with the line pattern when the abundance ratio is 0.7, i.e., approximately coronal. The three middle frames show the observed spectra in three prominences of the present sample.