Mathematical Modeling Experime ntal Approach of the Friction on the Tool-Chip Interface of Multicoa ted Carbide Turning I nserts A. M. Alaskari, S. E. Oraby* and H. K. Al-Khalid Department of Mechanical Production Technol ogy, College of Technological Studies, PAAET, Kuwai t
(* corresponding a uthor:
[email protected]) ABSTRACT The importance of machining process in toda y’s industry requires the establishment of more practical approaches to clearly represent the intimate and severe contact on the tool-chip-workpiece interfaces. In the current work, empirical models are developed, based on the measured force signals to relate each of the tool-chip friction compo nents on the rake face to the operating cutting parameters in rough turning ope ration using multilayer coated carbide inserts. Nonlinear modeling proved to have high capability to detect the nonlinearity features and the functional variability embedded in the experimental data. While feedrate was found to ha ve the most influential effect on the friction coefficient and its related force components, both cutting speed and depth of cut are found to have slight influence. Greater deformed chip thickness is found to lower the value of friction coefficient as the sliding length on the tool-chip interface is reduced. Keywords: Mathematical modeling, Cutting forces, Friction forces, Friction coefficient and C hip ratio.
INTRODUCTION Machining processes stems its importance from being a major manufacturing method where some statistics (Astakhov, 2005) indicated that about 15% of all mechanical components manufactured wor ldwide are derived from machining operations. Nevertheless, it still one of the least understood manufacturing operations due to low predictive ability of the many proposed machining models (Astakhov, 2005). Productivity enha ncement at lower power requirements usually represents the ultimate objective of a machining process. While productivity is achieved through the use of higher 1
levels of operating cutting parameters (speed, feed and depth of cut), the consumed power in the process depends to great extents on the environment tribological conditions at the tool-chip-workpiece interfaces. A proper manipulation of the technical junction between productivity enhancement and power reduction is still required since, as stated by many investigators, for example (Zemzemi et al., 2007), there is still lack o f fundamental unde rstanding o f the phenomenon occurring at the too l-chip and
the tool-workpiece interfaces. Many approaches have emerged within the last century to deal with metal cutting and machining dilemma with little eventual technic al and practical benefits. Common research attempts regarding metal cutting and machining may be generally categorized into: analytical mode ling, semianalytical method, simulation and numerical techniques, empirical mathematical modeling and, inprocess monitoring s ystems. All these techniques aimed at the optimizing the cutting process through the proper selection of the cutting parameters using an ideally designed cutting too l. Most modeling approaches were more or less based on the Merchant orthogonal cutting mode l (Merchant, 1945), Fig. 1.a, through studying the formation of continuous chip by assuming that the chip is formed by shearing along a shear plane whose inclination is obtained from the minimum energy principle. Many subsequent models were proposed (Cumming et al., 1965; Zorev et al., 1963; Lee et al., 1951; Shaw et al., 1953; Palmer et al., 1959) to add more reality to the or thogonal model proposed by Mercha nt. Kilicaslan (2009) claimed that analytical method s had limited applications due to complexity of cutting processes and, he added, Finite Elements Analysis (FEA) simulation became main tool to predict cutting variables such as forces, stresses, temperature, etc. without carrying on any money and time consuming experiments. Surprisingly, it was further admitted by Kilicaslan (2009) that the use of a simplified or thogonal, rather than ob lique mode l was a necessity in FEA due its simplicity as a good approximations. On contrary, it is reported (Ozlu and Budak, 2007) that FEA could provide much more detailed information about process but could be a very time consuming. 2
The use of advanced coating on carbide tools not only allowed accelerating the cutting speed with prolonged tool life but also improved the friction and tribological features in the tool-chipworkpiece interfaces. The use of TiN coating has been found to reduce tool replacement cost and to improve surface quality. However, it is reported by many investigators (Astakhov, 2007; Watmon and Ijeh, 2010; Jacobson, 1988; Wallén, and Hogmark, 1989; Shaw, 2005) that the resulting improvement of coated tool was as a result of the wear resistance of the substrate and not the coating layer. According to (Watmon and Ijeh, 2010), while TiC and Al2 03 appear to provide the most chemically stable screening layer between chip and tool, TiN, as a top coating layer, appears to offer the lowest too l friction and thereby low cutting temperature. According to Iqbal, Mativenga and Sheikh (2008), the tende ncy of carbon content to diffuse from the TiC coating into the thin layer of steel that transfers to the tool surface, thus strengthening it, seems to be the reason behind the higher friction of TiC. No such strengthening mechanism is evide nt when TiN is the coating. As explained by Hedenqvist (1990), a smearing mechanism existed where TiN material was continuo usly transferred from coated to uncoated locations on the cutting edge (atomistic wear process) that led to the reduction of wear rate.
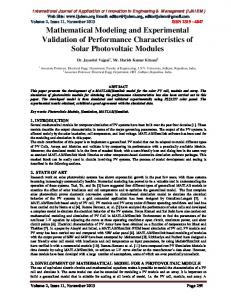
FRICTION ON TOOL-CHIP INTERFACE Studying friction is necessary to optimize cutting process since, as indicated by Astakhov (2006), that only 40-70% of the energy consumed b y the cutting s ystem is usually spent to separate chip from workpiece material while, due to unoptimized tribological processes, the rest (30-60%) ineffective energy is used merely in the transition of the useful energy into the too l-chip and tool-workpiece interfaces. A reduced cutting force is beneficial, primarily because it demands less motor power and ensures stability of the cutting machine (Watmon and Ijeh, 2010). Force system in metal cutting was first proposed by Merchant ( 1945), Fig. 1.a. The total force is represented by two equal, opposite forces (action and reaction) R and R' which hold the chip in equilibrium, Fig. 1.b. The force, R', which the 3
tool exerts on the chip is resolved into the tool face-chip friction force (F) and normal for ce (N). The force, R, which the workpiece exerts on the chip, is resolved along the shear plane into the shearing force, (Fs ) which is responsible for the work expended in shearing the metal, and into normal force (Fn ), which exerts a compressive stress on the shear plane. Force R is also resolved along the direction of too l motion into (Fc), termed by Merchant as the cutting force, and into Ft , the thrust force, Fig. 1.c.
Tool Chip
Chip
Work
Work
(b)
Tool
(c)
Figure 1 Merchant’s force model
4
According to Merchant force model, cutting (Fc) and thr ust (Ft ) force components can be transformed to normal (N) and friction (F) compo nents app ly on the too l face as follows: F = Fc sin (α ) + Ft cos (α )
(1)
N = Fc cos (α )-Ft sin (α )
(2)
in which (α) is the normal rake angle. According to Coulomb law, t he apparent coefficient of friction on tool-chip interface becomes:
[ N ] = F sin (α) + F cos (α) F cos (α) − F sin (α) = [τ σ ]
μ= F
c
t
c
(3)
t
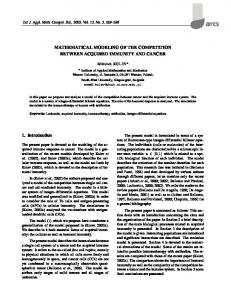
where (τ) and (σ) are the friction shear and nor mal stress on the tool-chip interface respectively. This implies that the Coulomb friction model can be used on the entire contact friction zone with a constant coefficient of friction (μ) or, that the frictional stress (τ) on the rake contact region is in a direct proportional to the normal stress (σ) (Ozel, 2006). However, Astakhov (2005) indicated that a constant friction coefficient according Coulomb model implies that any variation of temperature and pressure on the rake face was neglected. Additionally, Kilicaslan (2009) stated that the Coulomb mod el was valid only when nor mal force (N) was below a critical certain value. In machining, he added, the friction conditions were very different from a simple dry friction where normal force was very high. As the normal force increased, Coulomb law no longer held true as the real area of contact between chip and tool rake face increased. Results by Zorev et al., 1963; and Usui and Takeyama, 1960, Fig. 2, indicated that the shear friction stress (τ) remained constant over abo ut the half of too l-chip contact nearest the cutting edge but it gradually decreased reaching zero when the chip departed contact with the rake face. The nor mal stress (σ) was found to gradually decrease reaching zero at the chip departure point. Over the length AB, normal stress was sufficiently high and contact area approached the total apparent area and metal adheres to the rake face. The coefficient of friction in this sticking region was not constant and was lower than the value under sliding friction conditions. In the length from B to C, which 5
extended from the end of the sticking region to the point where chip loses contact with the tool rake face, the contact area to total area ratio was less than unity, so coefficient of friction was constant, and sliding friction occurred. According to Kilicaslan (2009), the value of the coefficient of friction varies as relative values of bot h sticking and sliding lengths changes can be considered as the average va lue based on both sticking and sliding regions. According to Zemzemi et al. (2007), the apparent coefficient of friction is mainly determined by the adhesive phenomena since; around 90% of the apparent friction was due to adhesion while only 10% was due to plastic deformation. On contrast, Madhavan et al. (2002) introduced a different view that sliding occurs over much of the interface near the cutting edge and sticking occurred close to the boundary of tool-chip contact. A third different approach was proposed by Ackroyd et al. (2003) where the tool-chip contact was composed of four distinct regions: a region of stagnation at the cutting edge, a region of retardation, a region of sliding followed by one of sticking near the boun da ry of the too l-chip contact. According to Ozlu and Budak (2007), while a maximum apparent friction coefficient value was 0.6 when carbide inserts were
employed, a minimum friction coefficient value was measured to be around 0.3 for CBN with dry cutting conditions and uncoated carbide insert with coolant. Due to the existence of the sticking region, the y explained, the sliding coefficient of friction was found slightly greater than those for the appa rent coefficient of friction. However, they indicated that when friction coefficient was high, thrust force, chip thickness, contact length, and shear angle were accurately predicted but inaccurate overestimated values of cutting forces and temperature were observed. Due to computational errors emerged with the analysis (Kilicaslan, 2009), the friction coefficients obtained from analytical relationships was not appropriate to be used in finite element simulation of metal cutting. The use of constant friction coefficient in most FEA analysis was criticized by Astakhov (2007) as this contradicted mos t of the available theoretical and experimental data. According to the findings by Dieter (1976), the most usual case was sticking friction, where there was no relative motion between the chip and the tool at their 6
interface. A limiting value for coefficient of friction as 0.577 where, above this value, there was no relative motion at the interface. This is criticized by Astakhov (2005) explaining that this contradicted the facts evolved in the practice of metal cutting where in many experimental investigations, most values of friction coefficient are well above 0.577 and might reach 2.0. Results by Iqbal et al. (2008) indicated that the measured coefficient of friction varied between 0.75 and 0.6 for the wide range of cutting speeds reported. As stated by Astakhov (2005), the values of coefficient of friction used in FEM modeling are always below the assumed limiting value just to suit the sliding condition at the interface.
Figure 2 Normal and friction stress distribution on the tool-chip interface Many different experimental techniques were used to measure the contact length on the rake face. Friedman and Lenz (1970) determined the contact length by the microscopic examination of the traces left by the sliding chip on the rake face. Another technique was proposed by Iqbal et al. (2007) using the underside tracks of the chip. According to FEA numerical study by Kilicaslan (2009), the contact length was calculated as 0.35 mm and the sticking region length is calculated as 0.06 mm. However, in a study by Shatla et al. (2001), the length of the sticking region was assumed to be two times of the uncut chip thickness. Ozel and Budak ( 2007) disagreed with the above the overestimated value suggesting that the length of the sticking zone was equal to only the uncut chip thickness. As concluded by Iqbal et al. (2008), the tool chip contact length increased with increasing chip compression ratio explaining that, at a reduced chip compression ratios (thinner chips) promoted chip curl and hence reduced contact length and hence the friction coefficient. 7
From the above seemingly discussion, there is still no consolidating evidence to introduce to those invo lved in practical metal cutting and machining. Unfortunately, from shopfloor applications viewpoint, none of these achieved a decisive and convincing victory. The problem resides in the way the two terminologies: “Machining” and “Metal Cutting” is long handled and practically interpreted. Although both terms are long considered identical, it is thought that they have a quite disparity technical interpretation. Machining generally defines alteration in workpiece configuration (visible responses) before and after processing such as surface roughness, dimensional accuracy, system stability, etc. Metal cutting, on the other hand, is the term to deal with the principles of most relevant invisible process parameters such as shear stress, strain rate, friction, wear rate, etc. Although all metal cutting parameters are considered as controlling elements of the machining responses, the most practical interests are extensively directed toward the understanding of the machining aspects rather tha n to the metal cutting principles. Technical confusion may emerge, for instance in turning operations, when cutting speed is apparently assessed without the consideration of work diameter. A high revolution rate (RPM) may give a deceiving impression about the velocity (distance rate) when it is associated with smaller workpiece diameter. From a machinist viewpoint, high RPM has a significant influence on machine and workpiece stability but, for a metal cutting theory researcher, its effect is not assessed without knowing the workpiece diameter. Analytical predictive modeling approach considering too many parameters doesn’t necessary benefit the ultimate practical objectives. This is due the well known problem of cutting variability which may far exceeds any pos sible contribution offered by a complex analytical mode l (Oraby and Alaskari, 2008).
In brief, all what a machining engineer or, a technician needs is some helpful
machinability data to optimize the process through the selection of the appropriate cutting conditions. Moreover, mos t studies in metal cutting are concentrated on the improvement of cutting tool performance that adds little to productivity. According to latest enormous advancement in tool and 8
workpiece technology, machining cost now depends to great extent on the optimal utilization of machine capacity to increase productivity. This may be the reason behind the wide acceptance ground of the inprocess approach where the process is continuously monitored online and, whenever needed, a manual or an automatic action is taken to retain a prope r stable condition. Adaptive control (AC) of machine tools has recently gained expa ndable ground. Mathematical mode ling and empirical appr oaches rather than complex analytical models can play an important role in AC implementation, for instance Oraby et al. (2003). The current study is an empirical app roach to evaluate the friction phenomenon on the too-chip interface using the measured cutting forces compo nents. Friction coefficient, friction and normal friction force compo nents are related to the dependent operating parameters as well as to the chip ratio.
EXPERIMENTAL PROCEDURES AND SETUP Experiments are carried out to conform reasonably to practical rough operations. To insure modeling statistical adequacy and significance, cutting parameters; cutting speed (V), feedrate (f) and depth of cut (d) are specified according to central composite design CCD to constitute a total of 24expe riment in four blocks, Table 1. Two machining combinations were carried out in the study. The first combination was the use of multicoated carbide inserts (Sandvik 435) to cut 709M40 (EN19) high tensile stress chromium alloy steel while the second was the use of multicoated carbide inserts (Sandvik GC415) to cut 817M40 (EN24) alloy steel. Both insert types consist of three coating layers: 1 μm TiN followed by 3 μm Al2 O3 and finally a layer of 5 μm TiC over the sintered carbide substrate. As recommended by manufacturer, GC435 inserts are most appropriate for steel cutting (ISO P35 range) with decreasing rates of plastic deformation and growth of thermal and mechanical fatigue cracks while GC415 inserts are intended for turning steel and cast iron (P05-30, K05-20, C6-8). Both inserts types were of SPUN 12 03 12 9
configuration (thickness = 3.18 mm & r=1.2 mm & l=12.7 mm). Inserts were clamped to a Sandvik CSTPRT-MAX tool holder with seat configuration 6°, 5°, 0°, 60°, 90° normal rake, clearance, inclination, approach and side approach angles respectively. Three cutting force compo nents: main (Fc), feeding (Ff) and radial (Fr), Fig. 3, were measured using a three-component dynamometer [Oraby and Hayhurst, 1990) that replaced the tool post of a Colchester Mascot 1600 turning lathe. Force components are measured at sampling period of 0.036 s just few seconds after signal stabilization and early enough before any wear or deformation mode(s) to develop. Samples of measured force signals are shown in Fig. 4.
MATHEMATICAL MODELING OF FRICTION ON THE RAKE FACE The friction parameters at the rake face of three dimensions cutting, Fig. 3, can be considered as indicated by Eqs. (1,3). Thrust force (Ft ) is determined as the resultant of the feeding (Ff) and the radial (Fr) components, Fig. 3 so that: Ft = F f + Fr 2
2
(4)
For (Ρ) independent variables, any measured friction response (RF) can be represented by the general nonlinear multiplicative form is:
[
]
RF = c ∏ pj=1 ξ Jβj ε ^ ,
(5)
in which ξ J are the natural machining parameters (speed, feed and depth of cut), c and βJ are the model parameters to be estimated using the experimental data, and ε ^ is the multiplicative random error. This nonlinear regression mode l in its natural form: RF = ao V a 1 f a 2 d a 3 ,
(6)
where a’s are the model coefficients to be determined by the nonlinear regression procedures using t he experimental data. 10
For sake of comparison with nonlinear regression model (6), a first order linear model is proposed with the parameters in their natural values to take the form: p
RF = b0 + ∑ b j ξ j + ε n j =1
(7)
where ε n is the error absolute value using linear non-transformed mode l. In terms of cutting parameters, the mode l takes the final first order linear regression mode l: RF = b0 + b1 (V ) + b2 ( f ) + b3 (d )
Table 1 CCD Expe rimental Results for (GC435-709M40) combination Test Seq. T1 T2 T3 T4 T5 T6 T7 T8 T9 T10 T11 T12 T13 T14 T15 T16 T17 T18 T19 T20 T21 T22 T23 T24
11
Cutting Conditions Speed DOC Feed (f) (V) (d) (mm/rev) (m/min) (mm) 72 0.12 2.00 145 0.30 2.00 145 0.12 2.50 72 0.30 2.50 104 0.20 2.25 104 0.20 2.25 145 0.12 2.00 72 0.30 2.00 72 0.12 2.50 145 0.30 2.50 104 0.20 2.25 104 0.20 2.25 206 0.20 2.25 50 0.20 2.25 104 0.60 2.25 104 0.06 2.25 104 0.20 3.00 104 0.20 1.50 206 0.20 2.25 50 0.20 2.25 104 0.60 2.25 104 0.06 2.25 104 0.20 3.00 104 0.20 1.50
Measured Forces [N] Cutting (Fc)
Feeding (Ff)
821 1490 919 1853 1244 1203 745 1520 1015 1862 1184 1201 1217 1310 2880 546 1472 792 1217 1306 3055 551 1589 793
353 483 445 621 467 480 396 477 480 618 443 464 492 520 645 299 532 277 512 547 686 319 610 301
Friction Parameters Friction Normal Friction Radial Force Force Coeff. (Fr) (F) (N) (μ) 372 596 763 0.78102 487 838 1410 0.59419 386 682 852 0.80001 545 1015 1756 0.57809 503 813 1165 0.69728 455 784 1127 0.69504 330 591 687 0.85953 490 839 1440 0.58254 437 752 942 0.79830 563 1026 1764 0.58153 434 741 1113 0.66553 443 764 1127 0.67728 511 833 1136 0.73287 457 825 1230 0.67082 649 1211 2769 0.43742 265 454 501 0.90657 503 882 1387 0.63572 296 486 745 0.65205 549 874 1132 0.77000 507 878 1221 0.71936 750 1330 2932 0.45367 288 485 503 0.96413 557 988 1494 0.66108 333 529 742 0.71361
(8)
Figure 3 Three dimensions cutting force sys tem
(a)
(b)
Figure 4 Samples of the measured three force components
RESULTS AND ANALYSIS Nonlinear and linear models, Eqs. (6,8), are postulated for each of the measured F, N and μ friction compo nents using the “Regression” module available in the SPSS commercial statistical computer software. All possible mod el structures are processed in order to evaluate the individual and the interaction influence of the operating independent cutting parameters. The significance and adequacy of the estimated coefficients are assessed using the associated statistical criteria. 12
Coefficient of Friction Regarding friction coefficient (μ), modeling results, Table 2, indicate that the feedrate (f) is of a predominant influence with a negative effect. This was confirmed through using the “STEPWISE” statistically selective routine in the linear regression procedures as judging criteria, mode l 2- linear, Table 2, where the feed parameter was the only significant variable for inclusion in the final mode l. Among all possible model structures, the nonlinear model 2, Table 2, is found to be the best one to adequacy represent the whole set of the experimental data: µ = 0.336 V ( 0.059 ) f ( −0.300 ) d ( −0.069 ) ,
R 2 = 92.6.
(9)
Generally, modeling parameters, nonlinear models 5-7, Table 2 indicated that the feed alone is responsible for about 91% of the inherent variability in the experimental data while the counterpart for each of speed and depth of cut are only 1.5% and 0.3% respectively. As indicated by Fig. 5, a noticeable decrease in μ is observed as feed increases. A very slight positive effect of the cutting speed is detected by nonlinear mode ling, Fig. 5.a. However, both linear and nonlinear techniques indicate a slight negative effect of the depth of cut, Fig. 5.b. This agrees with Ozlu and Budak (2007) results that a slight decrease in friction coefficient with the speed and the feedrate for each insert is observed. Nonlinear technique seems to have muc h better statistical criteria that are repr esented by the model correlation factor R2 along with the coefficient individual standard error of estimates (SE) (compare nonlinear model no. 6 with the counterpart linear model no. 2, Table 2). Figure 6 shows surface response and contour graphs of the relationship between coefficient of friction and both the cutting speed and feed, nonlinear model 2, Table 2. Friction coefficient nonlinearly increases as feed decreases while the trend is reversed, with different impact, for the cutting speed. At lower feeds, friction coefficient is almost constant while it nonlinearly increases at feed-speed interaction do main.
13
Table 2 Nonlinear and linear estimation of the friction parameters for GC435 -709M40 combination A) Nonlinear Model : Coefficient of Frict ion (μ)
No.
Coefficients (SE)
1 2 3 4 5 6 7
ao 0.336 (0.053) 0.319 (0.047) 0.542 (0.295) 0.442 (0.030) 0.518 (0.258) 0.419 (0.016) 0.725 (0.141)
a1 0.059 (0.031) 0.059 (0.031) 0.063 (0.109)
a2 -0.300 (0.019) -0.300 (0.019)
-0.301 (0.020)
a3 -0.069 (0.069)
0.063 (0.107)
92.6
1.8 91.3 1.5
-0.300 (0.020)
91 -0.057 (0.240)
1 2 3 4 5
14
b1 000 (000)
b2 -0.842 (0.088) -0.846 (0.088)
b3 -0.024 (0.034)
000 0.001 -0.024 (0.077)
d a3
0.3
R2 82.4 (EN) 80.6 (SW) 2.2 (EN) 0.4 (EN)
Normal Friction Force (N)
Coefficients (SE) ao 852.4 (167.08) 817.68 (66.66) 464.39 (343.35) 1615.53 (655.63) 866.4 (651.19) 1563.44 (123.6) 425.37 (123.990
a1 -0.009 (0.038)
-0.019 (0.147) -0.007 (0.087) -0.017 (0.162)
bo -180.62 (102.06) -160.04 (92.83) 798.26 (135.63) 489.36 (48.965) 151.19 (273.52)
a2 0.424 (0.024) 0.424 (0.024)
a3 0.800 (0.093) 0.800 (0.09) 0.783 (0.352)
0.425 (0.054)
Stat Crit. R2 95 94.9 21.2 73.7 000
0.425 (0.053)
73.7 0.783 (0.344)
B) Linear Model: bo 0.897 (0.087) 0.883 (0.023) 0.642 (0.077) 0.747 (0.176)
a2
Friction Force (F) Stat Crit. R2
92.3 -0.058 (0.243) -0.068 (0.073)
R = ao V a1 f
21.2
Coefficients (SE) ao 2590.03 (363.3) 2065.08 (125.190 858.73 (1205.63) 5346.65 (2222.7) 1605.09 (2177.61) 4272.42 (270.89) 646.75 (360.7)
a1 -0.049 (0.028)
bo -737.31 (86.91) -786.74 (82.81) 1353.13 (371.67) 276.41 (71.78) 184.38 (812.03)
b1 -0.444 (0.3)
-.061 (0.219) -0.048 (0.089) -0.061 (0.285)
a2 0.811 (0.016) 0.811 (0.017)
a3 0.896 (0.068) 0.896 (0.071) 0.814 (0.672)
0.812 (0.05)
Stat Crit. R2 99.2 99.1 7.8 91.6 0.2
0.813 (0.049)
91.5 0.813 (0.657)
7.5
R = b0 + b1 (V ) + b2 ( f ) + b3 (d )
b1 0.185 (0.35)
b2 1385.28 (104.25) 1383.22 (102.38)
b3 288.56 (40.2) 288.62 (39.5)
0.021 (1.165) 1383.22 (188.19) 288.62 (120.2)
R2 91.9 (EN) 91.8 (SW) 000 (EN) 71.7 (EN) 20.8 (EN)
b2 4311.2 (88.78) 4316.1 (91.33)
b3 472.66 (34.25) 472.51 (35.26)
-0.964 (3.194)
R2 99.2 99.1 0.4
4316.1 (275.8)
91.8 472.5 (356.9)
7.4
Friction Force Both nonlinear and linear mode ling parameters for the friction force models, Table 2, indicate a strong dependence on both the feed (higher R2 ) and the depth of cut (bigger coefficient value). This is logical since cutting force is usually affected by cut area. Within the employed range, cutting speed seems to have insignificant negative effect on the friction force. This agrees with the well established obs ervations in a pioneer study by Arnold (1946). The best general model to adequacy represent the experimental data is found to be the nonlinear model 1, Table 2: F = 852.4 V ( −0.009 ) f ( 0.424 ) d ( 0.800 ) ,
R 2 = 95.
(10)
Three dimensional and contour graph of the effect of bo th feed and depth are shown in Fig. 7. On one hand, depth of cut produces almost twice as much impact on the friction force as feed does. Nonlinear superiority over linear is evident in both 3D and contour graphs where nonlinearity characteristics of the surface are well grasped.
(a) Feed vs Cutting S peed
(b) Feed vs depth of cut
Figure 5 Nonlinear and linear models of the effect of operating parameters on the coefficient of friction (GC435 coated inserts cuts 709M40 steel)
15
(a) Three dimensional graph
(b) Contour graph
Figure 6 Friction coefficient response surface as affected by feed and speed
Normal Force The final general nonlinear mode l to represent the experimental data for the normal force is found to take the form, Table 2: N = 2590.03 V ( −0.049 ) f ( 0.811) d ( 0.896 ) ,
R 2 = 99.2
(11)
As indicated in Table 2, feed and depth of cut are found to be the main parameters affecting normal force (N) with almost equal impact. Feed, however, is found to have higher impact (bigger coefficient value of 0.81 ) and more statistical significance (better R2 of 91.5%) for normal than those for friction 16
forces with counterpart values of 0.425 and 74% respectively. This may explain why the coefficient of friction (μ) is negatively affected by feed, Eq. (9).
Linear Model
Nonlinear Model
(a) 3D surface Linear Model
Nonlinear Model 3
3
2.5
2.5
2
2
1.5
1.5
1
1 0.1
0.2
0.3
0.4
0.5
0.6
0.1
0.2
0.3
0.4
0.5
0.6
Feed (f) mm/rev
Feed (f) mm/rev
(b) Contour graphs Figure 7 Friction force linear and nonlinear response surface as affected by feed and depth
17
Depth of cut has almost equal positive influence on both friction and normal forces explaining why the co efficient of friction (μ), as the ratio of the two comp on ents can be related only to feed without affecting the model adequacy. Figure 8 indicates the effect of cutting speed on F, N and μ. Within the employed range, 50-200 m/min, coefficient of friction is found to increase from 0.665 to 0.725. However, a slight mixed effect is observed on both friction and normal forces (Bakkal at el., 2004).
Figure 8 Effect of cutting s peed on the friction components
As indicated by Fig. 9, further evidence exists that nonlinear mode ling o ffers better and more accurate detection of the functional variability invo lved in the experimental results. Linear estimation tends to overestimate response value especially at four poles of the surface (operational domain).
GENERAL EVALUATION AND DISCUSSIONS Modeling Cre dibility To examine the credibility of the proposed approach and its findings, it was necessary to repeat analysis considering an additional different cutting combination. Multilayer coated Sandvik GC415 is used to turn machine 817M40 (En24) high tensile alloy steel using the same setup as for GC435709M40 combination. The resulting general significant nonlinear mode ls are found to take the forms:
18
µ = 0.207 V ( 0.19 ) f ( −0.261) d ( −0.037 ) ,
R 2 = 95.
(12)
F = 492.01 V ( 0.079 ) f ( 0.340 ) d ( 0.859 ) ,
R 2 = 92.
(13)
N = 2356.5 V ( −0.108 ) f ( 0.596 ) d ( 0.877 ) ,
R 2 = 98.
(14)
Linear Model 3
2.5
2
1.5
1 0.2
0.4
0.6
0.4
0.6
Nonlinear Model 3
2.5
2
1.5
1 0.2
Figure 9 Normal force linear and nonlinear surfaces as affected by feed and depth of cut The de veloped models indicate a similar trend to those for (709M40 - GC435) for all friction compo nents. Feedrate (f) is found to have the predominant influence on the friction coefficient and its two components. The observation is confirmed by not only its high coefficient va lues but also by the associated enhanced statistical criteria of these coefficients. As feed increases, coefficient of friction tends to decrease gradually and nonlinearly. However, comparing to the first cutting set, feed usually is 19
of lower impact on the friction force, Eq. (13), while the case is reversed, Eq. (14), whe n the nor mal force is considered. However, for (GC415 - 817M40) cutting combination, cutting speed reveals higher consistent technological contribution with more enhanced statistical correlation factor. Nevertheless, speed coefficients indicate a pos itive effect on the friction force especially when cutting ratio is included into the final model. Correlation factor R2 is found relatively higher than those for the first cutting combination revealing a better dependence within the experimental data of the second cutting combination. The influe nce of depth of cut on the friction parameters for (GC415 - 817M40) shows almost similar behavior to that for (GC435 - 709M40). However, the models constant coefficients (bo’s) are of higher values for the latter. This is expected since this is directly proportional to specific cutting energy of the machined workpiece and the functional variability extracted from the experimental data.
Role of Chip Ratio (rc) Since it is concluded that the feed is the most influential factor on the friction parameter, it is thought that the chip thickness on the rake face may play an important tribological role (Kilicaslan, 2009). Therefore, chip ratio (rc), deformed chip thickness / undeformed chip thickness, depends mainly on the cutting feed and the deformed chip thickness in the form: t t Chip _ Ratio( rc ) = c = [t c f sin(κ ] = 1.1547 c t f
(15)
where ĸ is the approach angle = 60°. Nonlinear estimation procedures using the experimental data for (GC415 - 817M40) combination has indicated a strong correlation between the friction compo nents; F, N, μ and the chip thickness (chip ratio) along with cutting speed and depth of cut. This has led to the following best estimated mod els:
20
µ = 0.221( t c ) ( −0.329 ) V ( 0.179 ) ,
R 2 = 95.5
= 0.115( rc ) (1.013 ) V ( 0.271) ,
R 2 = 86.8
F = 391.38 ( t c ) ( 0.420 ) V ( 0.117 ) d ( 0.828 ) ,
R 2 = 91.5
= 1266.77 ( rc ) ( −1.452 ) V ( −0.06 ) d ( 0.919 ) ,
R 2 = 84.0
N = 1439.73 ( t c ) ( 0.730 ) V ( −0.025 ) d ( 0.823 ) ,
R 2 = 98.0
= 17976.7 ( rc ) ( −2..643 ) V ( −0.418 ) d ( 0.999 ) ,
R 2 = 85.5
(16)
(17)
(18)
Chip thickness (tc) shows pos itive impact that is twice as much on the nor mal than on the friction force, Eqs. (17, 18) thereby, it has a resultant negative effect on the coefficient of friction, Eq. (16). This is due to the relative change in sticking and sliding lengt hs on the rake face in such a way that thicker chip seems to increase sticking length permitting a smaller sliding action or, lower friction coefficient. This agrees with analysis by Iqba l et al. (2008) that sticking-sliding distribution schemes on the rake face do influence the chip curl and hence the contact length and chip back flow angle. However, they indicated that most contact length models are based on undeformed and deformed chip thickness, rake and shear angle while a great majority of the contact length models are independent of cutting speed.
CONCLUSIONS Nonlinear regression as a mathematical mode ling tool is found economical and feasible to well detect the functional nonlinearity and interaction features involved in the expe rimental da ta of the friction on the rake face. A strong cor relation is found be tween the friction coe fficient and the cutting feedrate in such a way that any increase in the employed feed lowers friction coefficient. Both cutting speed and depth of cut are found to have a slight effect on the friction coefficient. Within the whole set of experimental data, feed is found to carry about 74% of the inherent variability to represent the friction force modeling while only 21% is carried by the depth of cut. Regarding the normal force, those are found to be 91.5% and 7.5% for the feed and the depth respectively. Feed impact is found higher on the 21
normal force than on the friction force while depth of cut indicates almost equal influence on both friction force compo nents. Deformed chip thickness is found to decrease the friction coefficient in such a way that thicker chip seems to increase sticking area (tool seizure effect) on the tool-chip. This may restrict sliding thereby lowers the friction coefficient. As cutting goes on, it is expected that the process become more complex as wear scars are gradually developed on tool- face and flank. It is expected that this will lead to an entirely different friction mechanism as the coating-substrate topography is randomly da maged. This is currently intended in a further inve stigation by authors.
REFERENCES Ackroyd, B., Chandrasekar, S. and Compton, W.D., 2003, “A model for the contact conditions at the chip-tool interface in machining”, Trans ASME, Journal of Tribology, Vol. 125, pp. 649–660. Arnold, R. N., 1946, “The Mechanism of Tool Vibration in Cutting of Steel”. Proc. Inst. Mech. Engrs., Vol. 27, pp. 261-276. Astakhov, V.P., 2005, “On the inadequacy of the single-shear plane model of chip formation”, Int. J of Mechanical Sciences, Vol. 47 pp. 1649–1672. Astakhov, V.P., 2006, “Tribology of Metal Cutting”, London, Elsevier. Astakhov, V.P., 2007, “Tribo logy at the forefront of study and research on metal cutting”, Int. J. Machining and Machinability of Materials, Vol. 2, No. 3, pp. 309-313. Bakkal, M. at al., 2004, “Chip formation, cutting forces, and tool wear in turning of Zr-based bulk metallic glass”, Int. J of Machine Tools & Manufacture, Vol. 44, pp. 915–925. Cumming, J.D., Kobayashi, S., and Thomsen, E.G., 1965, "A New Analysis of the Forces in Orthogonal Metal Cutting," ASME J. Eng. Ind., vol. 87, pp. 480–486. Dieter G., 1976, “Mechanical metallurgy”, New York, McGraw-Hill.
22
Friedman, M.Y. and Lenz, E., 1970, “Investigation of the too l–chip contact length in metal cutting’, Int. J of Machine Tools Design, Vol. 10, pp. 401–416. Hedenqvist, P. et al, (1990), “How TiN coatings improve the performance of high speed steel cutting too ls”, Journal of Surface and Coatings Technology, Vol., No. 41/2, pp. 243-256. Iqbal, S.A., Mativenga, P.T. and Sheikh, M.A. 2007, “Characterization of the Machining of AISI 1045 steel over a wide range of cutting speeds-Part 1: Investigation of contact phenomena”, Proc. of IMechE, Part B, J of Engineering Manufacture, Vol. 221, No. 5, pp.909–916. Iqbal, S.A., Mativenga, P.T. and Sheikh, M.A., 2008, “Contact length prediction: mathematical models and effect of friction schemes on FEM simulation for conventional to HSM of AISI 1045 steel”, Int. J. Machining and Machinability of Materials, Vol. 3, Nos. 1/2, pp. 18-33. Jacobson, S., Wallén, P., and Hogmark, S., 1988, “Intermittent metal cutting at small cutting depths Cutting forces, Int. J of Machine Tools and Manufacture, Volume 28, No. 4, pp. p551-567. Kilicaslan, C., 2009, “Mode lling and simulation of metal cutting by finite element method ”, M.Sc. Thesis, Graduate School of Engineering and Sciences, Izmir Institute of Technology, Izmir, Turkey. Lee E.H., and Shaffer,B.W., 1951, “The Theory of plasticity applied to a problem of machining”, Trans. ASME, J. Appl. Mech., Vol. 18, pp. 405–413. Madhavan, V., Chandrasekar, S. and Farris, T.N., 2002, “Direct obs ervation of the chip-tool interface in the low speed cutting of pure metals”, Trans ASME, J. of Tribology, Vol. 124, pp.617–626. Merchant, E., 1945, “Mechanics of the Metal Cutting Process I. Orthogonal Cutting and a Type 2 Chip”, Journal of Applied Physics, Vol. 16, No. 5, pp. 267-275. Oraby, S. E. and Hayhurst, D. R., 1990 " High-Capacity Compact Three-Component Cutting Force Dynamometer", International Journal of Machine Tools & Manufacturing, Vol. 30, No. 4, pp.549-559.
23
Oraby, S.E., Almeshaiei, E.A. and ALASKARI, A.M., 2003, "Adaptive control simulation approach based on mathematical model optimization algorithm for rough turning", Kuwait Journal of Science & Engineering (KJSE), An International Journal of Kuwait University, Vol. 30, No. 2, pp. 213-234. Oraby, S.E. and Alaskari, A.M., 2008, "On the Variability of Tool Wear and Life at Disparate Operating Parameters", Kuwait Journal of Science & Engineering (KJSE), An International Journal of Kuwait University, Vol. 35, No. 1B, pp. 123-150. Ozlu, E. and Budak, E., 2007, “ Experimental Analysis and Modeling of Orthogonal Cutting Using Material and Friction Mod els”, 4th International Conference and Exhibition on Design and Production of MACHINES and DIES/MOLDS, Cesme, TURKEY, pp. 21-23. Palmer, W.B., Oxley, P.L.B., 1959, “Mechanics of Orthogonal Machining”, Proc. Instn. Mech. Engrs., Vol. 173, No. 24, pp. 623-638. Shatla, M., Kerk, C. and Altan, T. 2001, “Process Modelling in Machining. Part II: Validation and Applications of the Determined Flow Stress Data”, Int. J of Machine Tools and Manufacturing, Vol. 41, pp. 1659-1680. Shaw, M.C. Cook, N.H. and Finnie, I., 1953, “The Shear-Angle Relationship in Metal Cutting", Transaction ASME, Vol. 75, pp. 273-283. Shaw, M.C, 2005, “Metal cutting Principles, Oxford University Press, 2nd Ed. Ozel, T., 2006, “The influence of friction mode ls on finite element simulations of machining”, International Journal of Machine Too ls & Manufacture, Vol. 46, pp. 518–530. Usui, E. and Takeyama, H., 1960, “A Photoelastic Analysis of Machining Stress”, Trans ASME, J. Eng. Industry, pp. 303-308. Wallén, P. and Hogmark, S., 1989, “Influence of TiN coating on wear of high speed steel at elevated temperature, Journal of Wear, Vol. 130, Issue 1, pp. 123-135.
24
Watmon, T.B. and Anthony, C.I., 2010, “ Coating Cutting Tools with Hard Substance Lowers Friction Coefficient and Improves Tool Life - A Review”, Proceedings of the International MultiConference of Engineers and Computer Scientists, Vol. III, IMECS 2010, Hong Kong. Zemzemi, F. et al., 2007, “Development of a friction mode l for the tool-chip-workpiece interfaces during dry machining of AISI4142 steel with TiN coated carbide cutting tools”, Int. J. Machining and Machinability of Materials, Vol. 2, No. 3, pp. 361-377. Zorev, N.N., 1963, “Inter-relationship between shear processes occurring along tool face and shear plane in metal cutting”, Int. Research in Production Engineering, ASME, New York, pp. 42-49.
25