regression model and can interpret Stata output. Consider ..... None of the
remaining effects x2,x3,...,xk can be an interaction (product) effect with x1. I will
say ...
11
11
LOGISTIC REGRESSION - INTERPRETING PARAMETERS
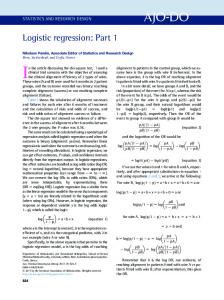
Logistic Regression - Interpreting Parameters
Let us expand on the material in the last section, trying to make sure we understand the logistic regression model and can interpret Stata output. Consider first the case of a single binary predictor, where ( ( 1 if exposed to factor 1 if develops disease x= , and y = . 0 if not 0 does not
Results can be summarized in a simple 2 X 2 contingency table as
Disease 1 (+) 0 (– )
Exposure 1 0 a b c d
d = ad (why?) and we interpret OR d > 1 as indicating a risk factor, and OR d < 1 as where OR bc indicating a protective factor. Recall the logistic model: p(x) is the probability of disease for a given value of x, and µ
logit(p(x)) = log Then for
x = 0 (unexposed), x = 1 (exposed),
p(x) 1 − p(x)
= α + βx.
logit(p(x)) = logit(p(0)) = α + β(0) = α logit(p(x)) = logit(p(1)) = α + β(1) = α + β
Also, odds of disease among unexposed: p(0)/(1 − p(0)) exposed: p(1)/(1 − p(1)) Now p(1)/(1 − p(1)) odds of disease among exposed = OR = odds of disease among unexposed p(0)/(1 − p(0)) and
β = logit(p(1)) −´logit(p(0)) ³ ³ ´ p(1) p(0) = log (1−p(1)) − log (1−p(0)) ³
= log p(1)/(1−p(1)) p(0)/(1−p(0)) = log(OR)
´
The regression coefficient in the population model is the log(OR), hence the OR is obtained by exponentiating β, eβ = elog(OR) = OR Remark: If we fit this simple logistic model to a 2 X 2 table, the estimated unadjusted OR (above) and the regression coefficient for x have the same relationship. Example: Leukemia Survival Data (Section 10 p. 108). We can find the counts in the following table from the tabulate live iag command: Surv ≥ 1 yr? Yes No
Ag+ (x=1) 9 8
Ag- (x=0) 2 14
d = and (unadjusted) OR
9(14) 2(8)
= 7.875 .
Before proceeding with the Stata output, let me comment about coding of the outcome variable. Some packages are less rigid, but Stata enforces the (reasonable) convention that 0 indicates a negative outcome and all other values indicate a positive outcome. If you try to code something like 2 for survive a year or more and 1 for not survive a year or more, Stata coaches you with the error message 112
11
LOGISTIC REGRESSION - INTERPRETING PARAMETERS
outcome does not vary; remember:
0 = negative outcome, all other nonmissing values = positive outcome
This data set uses 0 and 1 codes for the live variable; 0 and -100 would work, but not 1 and 2. Let’s look at both regression estimates and direct estimates of unadjusted odds ratios from Stata. . logit live iag Logit estimates
Number of obs = 33 LR chi2(1) = 6.45 Prob > chi2 = 0.0111 Log likelihood = -17.782396 Pseudo R2 = 0.1534 -----------------------------------------------------------------------------live | Coef. Std. Err. z P>|z| [95% Conf. Interval] -------------+---------------------------------------------------------------iag | 2.063693 .8986321 2.30 0.022 .3024066 3.82498 _cons | -1.94591 .7559289 -2.57 0.010 -3.427504 -.4643167 -----------------------------------------------------------------------------. logistic live iag Logistic regression Number of obs = 33 LR chi2(1) = 6.45 Prob > chi2 = 0.0111 Log likelihood = -17.782396 Pseudo R2 = 0.1534 -----------------------------------------------------------------------------live | Odds Ratio Std. Err. z P>|z| [95% Conf. Interval] -------------+---------------------------------------------------------------iag | 7.875 7.076728 2.30 0.022 1.353111 45.83187 -----------------------------------------------------------------------------³
Stata has fit logit(ˆ p(x)) = log
pˆ(x) 1−ˆ p(x)
´
ˆ = −1.946 + 2.064 IAG, with =α ˆ + βx
d = e2.064 = 7.875. This is identical to the “hand calculation” above. A 95% Confidence Interval OR for β (IAG coefficient) is .3024066 ≤ β ≤ 3.82498. This logit scale is where the real work and theory is done. To get a Confidence Interval for the odds ratio, just exponentiate everything
e.3024066 ≤
eβ ≤
e3.82498
1.353111 ≤ OR ≤ 45.83187 What do you conclude?
A More Complex Model ³
´
p log 1−p = α + β1 x1 + β2 x2 , where x1 is binary (as before) and x2 is a continuous predictor. The regression coefficients are adjusted log-odds ratios.
To interpret β1 , fix the value of x2 : For x1 = 0 log odds of disease = α + β1 (0) + β2 x2 = α + β2 x2 odds of disease = eα+β2 x2 For x1 = 1
log odds of disease = α + β1 (1) + β2 x2 = α + β1 + β2 x2 odds of disease = eα+β1 +β2 x2
Thus the odds ratio (going from x1 = 0 to x1 = 1 is OR =
eα+β1 +β2 x2 odds when x1 = 1 = = eβ1 odds when x1 = 0 eα+β2 x2
a+b
(remember ea+b = ea eb , so e ea = eb ), i.e. β1 = log(OR). Hence eβ1 is the relative increase in the odds of disease, going from x1 = 0 to x1 = 1 holding x2 fixed (or adjusting for x2 ). 113
11
LOGISTIC REGRESSION - INTERPRETING PARAMETERS
To interpret β2 , fix the value of x1 : For x2 = k (any given value k) log odds of disease = α + β1 x1 + β2 k odds of disease = eα+β1 x1 +β2 k For x2 = k + 1
log odds of disease = α + β1 x1 + β2 (k + 1) = α + β1 x1 + β2 k + β2 odds of disease = eα+β1 x1 +β2 k+β2
Thus the odds ratio (going from x2 = k to x2 = k + 1 is OR =
odds when x2 = k + 1 eα+β1 x1 +β2 k+β2 = eβ2 = odds when x2 = k eα+β1 x1 +β2 k
i.e. β2 = log(OR). Hence eβ2 is the relative increase in the odds of disease, going from x2 = k to x2 = k + 1 holding x1 fixed (or adjusting for x1 ). Put another way, for every increase of 1 in x2 the odds of disease increases by a factor of eβ2 . More generally, if you increase x2 from k to k + ∆ then ³ ´∆ odds when x2 = k + ∆ OR = = eβ2 ∆ = eβ2 odds when x2 = k
The Leukemia Data µ
p log 1−p
= α + β1 IAG + β2 LWBC
where IAG is a binary variable and LWBC is a continuous predictor. Stata output seen earlier -----------------------------------------------------------------------------live | Coef. Std. Err. z P>|z| [95% Conf. Interval] -------------+---------------------------------------------------------------iag | 2.519562 1.090681 2.31 0.021 .3818672 4.657257 lwbc | -1.108759 .4609479 -2.41 0.016 -2.0122 -.2053178 _cons | 5.543349 3.022416 1.83 0.067 -.380477 11.46718 -----------------------------------------------------------------------------shows a fitted model of µ
pˆ log = 5.54 + 2.52 IAG − 1.11 LWBC 1 − pˆ The estimated (adjusted) OR for IAG is e2.52 = 12.42, which of course we saw earlier in the Stata output -----------------------------------------------------------------------------live | Odds Ratio Std. Err. z P>|z| [95% Conf. Interval] -------------+---------------------------------------------------------------iag | 12.42316 13.5497 2.31 0.021 1.465017 105.3468 lwbc | .3299682 .1520981 -2.41 0.016 .1336942 .8143885 -----------------------------------------------------------------------------The estimated odds that an Ag+ individual (IAG=1) survives at least one year is 12.42 greater than the corresponding odds for an Ag- individual (IAG=0), regardless of the LWBC (although the LWBC must be the same for both individuals). The estimated OR for LWBC is e−1.11 = .33 (≈ 13 ). For each increase in 1 unit of LWBC, the estimated odds of surviving at least a year decreases by roughly a factor of 3, regardless of ones 114
11
LOGISTIC REGRESSION - INTERPRETING PARAMETERS
IAG. Stated differently, if two individuals have the same Ag factor (either + or -) but differ on their values of LWBC by one unit, then the individual with the higher value of LWBC has about 1/3 the estimated odds of survival for a year as the individual with the lower LWBC value. Confidence intervals for coefficients and ORs are related as before. For IAG the 95% CI for β1 yields the 95% CI for the adjusted IAG OR as follows: .382 ≤ .382
e
≤
β1 ≤ eβ1
4.657
≤ e4.657
1.465 ≤ OR ≤ 105.35 We estimate that the odds of an Ag+ individual (IAG=1) surviving at least a year to be 12.42 times the odds of an Ag- individual surviving at least one year. We are 95% confident the odds ratio is between 1.465 and 105.35. How does this compare with the unadjusted odds ratio? Similarly for LWBC, the 95% CI for β2 yields the 95% CI for the adjusted LWBC OR as follows: −2.012 ≤ e
−2.012
≤
β2 ≤ eβ2
−.205
≤ e−.205
.134 ≤ OR ≤ .814 We estimate the odds of surviving at least a year is reduced by a factor of 3 (i.e. 1/3) for each increase of 1 LWBC unit. We are 95% confindent the reduction in odds is between .134 and .814. Note that while this is the usual way of defining the OR for a continuous predictor variable, software may try to trick you. JMP IN for instance would report d = e−1.11(max(LW BC)−min(LW BC)) = .33max(LW BC)−min(LW BC) , OR
the change from the smallest to the largest LWBC. That is a lot smaller number. You just have to be careful and check what is being done by knowing these relationships.
General Model We can have a lot more than complicated models than we have been analyzing, but the principles remain the same. Suppose we have k predictor variables where k can be considerably more than 2 and the variables are a mix of binary and continuous. then we write µ
log
p 1−p
= log odds of disease = α + β1 x1 + β2 x2 + . . . + βk xk
which is a logistic multiple regression model. Now fix values of x2 , x3 , . . . , xk , and we get odds of disease for x1 = c : eα+β1 c+β2 x2 +...+βk xk x1 = c + 1 : eα+β1 (c+1)+β2 x2 +...+βk xk The odds ratio, increasing x1 by 1 and holding x2 , x3 , . . . , xk fixed at any values is OR =
eα+β1 (c+1)+β2 x2 +...+βk xk = eβ1 eα+β1 c+β2 x2 +...+βk xk
That is, eβ1 is the increase in odds of disease obtained by increasing x1 by 1 unit, holding x2 , x3 , . . . , xk fixed (i.e. adjusting for levels of x2 , x3 , . . . , xk ). For this to make sense • x1 needs to be binary or continuous • None of the remaining effects x2 , x3 , . . . , xk can be an interaction (product) effect with x1 . I will say more about this later! The essential problem is that if one or more of x2 , x3 , . . . , xk depends upon x1 then you cannot mathematically increase x1 and simultaneously hold x2 , x3 , . . . , xk fixed. 115
11
LOGISTIC REGRESSION - INTERPRETING PARAMETERS
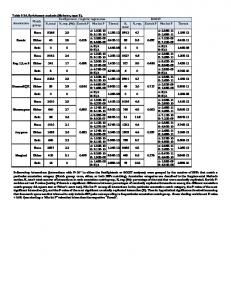
Example: The UNM Trauma Data The data to be analyzed here were collected on 3132 patients admitted to The University of New Mexico Trauma Center between the years 1991 and 1994. For each patient, the attending physician recorded their age, their revised trauma score (RTS), their injury severity score (ISS), whether their injuries were blunt (i.e. the result of a car crash: BP=0) or penetrating (i.e. gunshot wounds: BP=1), and whether they eventually survived their injuries (DEATH = 1 if died, DEATH = 0 if survived). Approximately 9% of patients admitted to the UNM Trauma Center eventually die from their injuries. The ISS is an overall index of a patient’s injuries, based on the approximately 1300 injuries cataloged in the Abbreviated Injury Scale. The ISS can take on values from 0 for a patient with no injuries to 75 for a patient with 3 or more life threatening injuries. The ISS is the standard injury index used by trauma centers throughout the U.S. The RTS is an index of physiologic injury, and is constructed as a weighted average of an incoming patient’s systolic blood pressure, respiratory rate, and Glasgow Coma Scale. The RTS can take on values from 0 for a patient with no vital signs to 7.84 for a patient with normal vital signs. Champion et al. (1981) proposed a logistic regression model to estimate the probability of a patient’s survival as a function of RTS, the injury severity score ISS, and the patient’s age, which is used as a surrogate for physiologic reserve. Subsequent survival models included the binary effect BP as a means to differentiate between blunt and penetrating injuries. We will develop a logistic model for predicting death from ISS, AGE, BP, and RTS. Figure 1 shows side-by-side boxplots of the distributions of ISS, AGE, and RTS for the survivors and non-survivors, and a bar chart showing proportion penetrating injuries for survivors and nonsurvivors. Survivors tend to have lower ISS scores, tend to be slightly younger, and tend to have higher RTS scores, than non-survivors. The importance of the effects individually towards predicting survival is directly related to the separation between the survivors and non-survivors scores. There are no dramatic differences in injury type (BP) between survivors and non-survivors. Figure 1 was generated with the following Stata code. Earlier in the semester I was avoiding using the relabel option; it is much better to do things this way, but note the 1 and 2 refer to alphabetic order of values, not to the actual values. Bar graphs in Stata are a little tricky – this one worked, but had there been several values of BP or had they been coded other than 0 and 1 this would not have worked. In the latter case one needs to create separate indicator variables of categories (as an option to tabulate): See http://www.stata.com/support/faqs/graphics/piechart.html for a discussion. graph box iss, over(death, relabel(1 "Survived" 2 "Died" ) descending) /// ytitle(ISS) title(ISS by Death) name(iss) graph box rts, over(death, relabel(1 "Survived" 2 "Died" ) descending) /// ytitle(RTS) title(RTS by Death) name(rts) graph box age, over(death, relabel(1 "Survived" 2 "Died" ) descending) /// ytitle(Age) title(Age by Death) name(age) graph bar bp,over(death,relabel(1 "Survived" 2 "Died") descending) /// ytitle("Proportion Penetrating") title("Penetrating by Death") name(bp) graph combine iss rts age bp
116
11
LOGISTIC REGRESSION - INTERPRETING PARAMETERS
RTS by Death
0
0
2
20
ISS 40
RTS 4
6
60
8
80
ISS by Death
Died
Survived
Died
Penetrating by Death
0
0
20
Age 40 60
Proportion Penetrating .1 .2 .3
80 100
Age by Death
Survived
Died
Survived
Died
Survived
Figure 1: Relationship of predictor variables to death
Stata Analysis of Trauma Data . logistic death iss bp rts age,coef Logistic regression
Number of obs = 3132 LR chi2(4) = 933.34 Prob > chi2 = 0.0000 Log likelihood = -446.01414 Pseudo R2 = 0.5113 -----------------------------------------------------------------------------death | Coef. Std. Err. z P>|z| [95% Conf. Interval] -------------+---------------------------------------------------------------iss | .0651794 .0071603 9.10 0.000 .0511455 .0792134 bp | 1.001637 .227546 4.40 0.000 .5556555 1.447619 rts | -.8126968 .0537066 -15.13 0.000 -.9179597 -.7074339 age | .048616 .0052318 9.29 0.000 .0383619 .05887 _cons | -.5956074 .4344001 -1.37 0.170 -1.447016 .2558011 -----------------------------------------------------------------------------. logistic death iss bp rts age Logistic regression Number of obs = 3132 LR chi2(4) = 933.34 Prob > chi2 = 0.0000 Log likelihood = -446.01414 Pseudo R2 = 0.5113 -----------------------------------------------------------------------------death | Odds Ratio Std. Err. z P>|z| [95% Conf. Interval] -------------+---------------------------------------------------------------iss | 1.067351 .0076426 9.10 0.000 1.052476 1.082435 bp | 2.722737 .6195478 4.40 0.000 1.743083 4.252978 rts | .44366 .0238275 -15.13 0.000 .399333 .4929074 age | 1.049817 .0054924 9.29 0.000 1.039107 1.060637 -----------------------------------------------------------------------------. estat gof Logistic model for death, goodness-of-fit test number of observations = 3132 number of covariate patterns = 2096 117
11
LOGISTIC REGRESSION - INTERPRETING PARAMETERS
Pearson chi2(2091) = 2039.73 Prob > chi2 = 0.7849 . estat gof,group(10) Logistic model for death, goodness-of-fit test (Table collapsed on quantiles of estimated probabilities) number of observations = 3132 number of groups = 10 Hosmer-Lemeshow chi2(8) = 10.90 Prob > chi2 = 0.2072 There are four effects in our model: ISS, BP (a binary variable), RTS, and AGE. Looking at the goodness of fit tests, there is no evidence of gross deficiencies with the model. The small p-value (< .0001) for the LR chi-squared statistic implies that one or more of the 4 effects in the model is important for predicting the probability of death. The tests for parameters suggest that each of the effects in the model is significant at the .001 level (p-values < .001). The fitted logistic model is µ
pˆ log = −.596 + .065ISS + 1.002BP − .813RTS + .049AGE, 1 − pˆ where pˆ is the estimated probability of death. The table below is in a form similar to Fisher et al’s AJPH article (with this lecture). The estimated odds ratio was obtained by exponentiating the regression estimate. The CI endpoints for the ORs were obtained by exponentiating the CI endpoints for the corresponding regression parameter. JMP-IN (and some authors) would report different ORs for the continuous variables, for instance 124.37 for ISS (instead of the 1.067 we are reporting). (Why?). Everybody will agree on the coefficient, but you need to be very careful what OR is being reported and how you interpret it. The p-value for each regression effect is smaller than .05, so the 95% CI for each OR excludes 1 (i.e. each regression coefficient is significantly different from zero so each OR is significantly different from 1). Thus, for example, the odds of dying from a penetrating injury (BP=1) is 2.72 times greater than the odds of dying from a blunt trauma (BP=0). We are 95% confident that the population odds ratio is between 1.74 and 4.25. Do the signs of the estimated regression coefficients make sense? That is, which coefficients would you expect to be positive (leading to an OR greater than 1). Effect ISS BP RTS AGE
Estimate .065 1.002 -.813 .049
Std Error .007 .228 .054 .005
P-value < .001 < .001 < .001 < .001
Odds Ratio 1.067 2.723 0.444 1.050
95% CI (1.052 , 1.082) (1.743 , 4.253) (0.399 , 0.493) (1.039 , 1.061)
Logistic Models with Interactions Consider the hypothetical problem with two binary predictors x1 and x2
Disease + –
x2 = 0 x1 1 0 1 9 45 45 118
x2 = 1 x1 1 0 9 1 45 45
11
LOGISTIC REGRESSION - INTERPRETING PARAMETERS
d = The OR for x1 = 1 versus x1 = 0 when x2 = 0: OR
1(45) 9(45) 9(45) 1(45)
=
1 9
d = The OR for x1 = 1 versus x1 = 0 when x2 = 1: OR =9 A simple logistic model for these data is logit(p) = α + β1 x1 + β2 x2 . For this model, OR for x1 = 1 versus x1 = 0 for fixed x2 is eβ1 . That is, the adjusted OR for x1 is independent of the value of x2 . This model would appear to be inappropriate for the data set above where the OR of x1 is very different for x2 = 0 than it is for x2 = 1. A simple way to allow for the odds ratio to depend on the level of x2 is through the interaction model logit(p) = α + β1 x1 + β2 x2 + β3 x1 ∗ x2
where the interaction term x1 ∗ x2 is the product (in this case) of x1 and x2 . In some statistical packages the interaction variable must be created in the spreadsheet (that always works), and in others it can (much more conveniently) be added to the model directly. Stata is in the former category, although the xi structure allows interaction terms to be generated automatically. That becomes much more important with multi-level (3 or more) factors. To interpret the model, let us consider the 4 possible combinations of the binary variables: Group A B C D Group A B C D
x1 0 0 1 1
x2 0 1 0 1
x1 ∗ x2 0 0 0 1
Log Odds of Disease α + β1 (0) + β2 (0) + β3 (0) = α α + β1 (0) + β2 (1) + β3 (0) = α + β2 α + β1 (1) + β2 (0) + β3 (0) = α + β1 α + β1 (1) + β2 (1) + β3 (1) = α + β1 + β2 + β3
Odds of Disease eα α+β 2 e α+β 1 e α+β +β 1 2 +β3 e
Group A is the baseline or reference group. The parameters α, β1 , and β2 are easily interpreted. The odds of disease for the baseline group (x1 = x2 = 0) is eα – the same interpretation applies α+β when interaction is absent. To interpret β1 note OR for Group C vs. Group A is e eα 1 = eβ1 . This α+β is OR for x1 = 1 vs. x1 = 0 when x2 = 0. Similarly OR for Group B vs. Group A is e eα 2 = eβ2 . This is OR for x2 = 1 vs. x2 = 0 when x1 = 0. In an interaction model, the OR for x1 = 1 vs. x1 = 0 depends on the level of x2 . Similarly the OR for x2 = 1 vs. x2 = 0 depends on the level of x1 . For example, OR for group D vs. B =
eα+β1 +β2 +β3 = eβ1 +β3 eα+β2
This is OR for x1 = 1 vs. x1 = 0 when x2 = 1. Recalling that eβ1 is OR for x1 = 1 vs. x1 = 0 when x2 = 0, we have OR(x1 = 1 vs. x1 = 0 when x2 = 1) = OR(x1 = 1 vs. x1 = 0 when x2 = 0) ∗ eβ3 eβ1 +β3 = eβ1 ∗ eβ3 Thus eβ3 is the factor that relates the OR for x1 = 1 vs. x1 = 0 when x2 = 0 to the OR when x2 = 1. If β3 = 0 the two OR are identical, i.e. x1 and x2 do not interact. Similarly, OR(x2 = 1 vs. x2 = 0 when x1 = 1) = OR(x2 = 1 vs. x2 = 0 when x1 = 0) ∗ eβ3 eβ2 +β3 = eβ2 ∗ eβ3 119
11
LOGISTIC REGRESSION - INTERPRETING PARAMETERS
so eβ3 is also the factor that relates the OR for x2 = 1 vs. x2 = 0 at the two levels of x1 . An important and no doubt fairly obvious point to take away from this is that the regression coefficients are harder to interpret in models with interactions! Stata Analysis: Let’s fit this interaction example (data from page 118) using Stata. We could actually do this particular example easily without using xi, but we won’t be so lucky in the future. . list,clean x2 x1 Disease Count 1. 0 1 1 1 2. 0 1 0 45 3. 0 0 1 9 4. 0 0 0 45 5. 1 1 1 9 6. 1 1 0 45 7. 1 0 1 1 8. 1 0 0 45 . xi: logistic Disease i.x1 i.x2 i.x1*i.x2 [fw=Count],coef i.x1 _Ix1_0-1 (naturally coded; _Ix1_0 omitted) i.x2 _Ix2_0-1 (naturally coded; _Ix2_0 omitted) i.x1*i.x2 _Ix1Xx2_#_# (coded as above) note: _Ix1_1 dropped due to collinearity note: _Ix2_1 dropped due to collinearity Logistic regression Number of obs = 200 LR chi2(3) = 13.44 Prob > chi2 = 0.0038 Log likelihood = -58.295995 Pseudo R2 = 0.1034 -----------------------------------------------------------------------------Disease | Coef. Std. Err. z P>|z| [95% Conf. Interval] -------------+---------------------------------------------------------------_Ix1_1 | -2.197225 1.074892 -2.04 0.041 -4.303975 -.090474 _Ix2_1 | -2.197225 1.074892 -2.04 0.041 -4.303975 -.090474 _Ix1Xx2_1_1 | 4.394449 1.520128 2.89 0.004 1.415054 7.373844 _cons | -1.609438 .3651484 -4.41 0.000 -2.325116 -.8937603 -----------------------------------------------------------------------------. xi: logistic Disease i.x1 i.x2 i.x1*i.x2 [fw=Count] i.x1 _Ix1_0-1 (naturally coded; _Ix1_0 omitted) i.x2 _Ix2_0-1 (naturally coded; _Ix2_0 omitted) i.x1*i.x2 _Ix1Xx2_#_# (coded as above) note: _Ix1_1 dropped due to collinearity note: _Ix2_1 dropped due to collinearity Logistic regression Number of obs = 200 LR chi2(3) = 13.44 Prob > chi2 = 0.0038 Log likelihood = -58.295995 Pseudo R2 = 0.1034 -----------------------------------------------------------------------------Disease | Odds Ratio Std. Err. z P>|z| [95% Conf. Interval] -------------+---------------------------------------------------------------_Ix1_1 | .1111111 .1194325 -2.04 0.041 .0135147 .913498 _Ix2_1 | .1111111 .1194325 -2.04 0.041 .0135147 .913498 _Ix1Xx2_1_1 | 81 123.1303 2.89 0.004 4.116709 1593.749 -----------------------------------------------------------------------------The fitted model is logit(p) = α + β1 x1 + β2 x2 + β3 x1 ∗ x2 = −1.61 − 2.20x1 − 2.20x2 + 4.39x1 ∗ x2 ˆ
Note that eβ1 = e−2.20 = ˆ
1 9
= estimated OR for x1 = 1 vs. x1 = 0 when x2 = 0. Also,
ˆ
eβ1 +β3 = e−2.20+4.39 = e2.19 = 9 = estimated OR for x1 = 1 vs. x1 = 0 when x2 = 1 Note that ˆ
eβ3 = e4.39 = 81 = mult. factor that relates OR for x1 = 1 vs. x1 = 0 at the 2 levels of x2 Make sure you see how Stata agrees with these calculations.
120
11
LOGISTIC REGRESSION - INTERPRETING PARAMETERS
A More Complex Interaction Model The treatment regime to be adopted for patients who have been diagnosed as having prostate cancer is crucially dependent on whether the cancer has spread to the surrounding lymph nodes. A laparatomy (a surgical incision into the abdominal cavity) may be performed to ascertain the extent of this nodal involvement. There are a number of variables that are indicative of nodal involvement which can be measured without surgery. The aim of the study for which the data were collected was to determine if a combination of 5 variables could be used to predict whether cancer has spread to the lymph nodes. The 5 variables are: age of patient at diagnosis (years), level of serum acid phosphatase (in King-Armstrong units), result of X-ray examination (0=negative, 1=positive), size of tumor by rectal examination (0=small, 1=large), and a summary of pathological grade of tumor from biopsy (0=less serious, 1=serious). The response variable is involvement of lymph node (0=no, 1=yes). Fifty-three patients were enrolled in the study. A published analysis suggested the following model for the probability p of nodal involvement ³
log
p 1−p
´
= α + β1 Xray + β2 size + β3 grade + β4 log(acid) + β5 size*grade + β6 log(acid)*grade
The model contains 3 binary variables (Xray, size, and grade), 1 continuous variable (log(acid)), and 2 interactions, or product effects (size*grade) and log(acid)*grade). the size*grade interaction involves two binary variables, as considered in the previous example, whereas the log(acid)*grade interaction term involves a binary and a continuous variable. for each case in the data set (
log(acid)*grade =
0 if grade = 0 log(acid) if grade = 1
Note that the model excludes age.
Interpreting the Regression Coefficients For any regression variable that is not included in an interaction, the regression coefficient is an adjusted log OR, and is independent of levels of the other factors in the model. For example, for fixed size, grade, and acid levels (OR for Xray = 1 vs. Xray = 0) =
eα+β1 (1)+β2 size + ··· = eβ1 eα+β1 (0)+β2 size + ···
The size*grade interaction means that the adjusted OR for size = 1 vs. size = 0 depends on grade. The log(acid)*grade interaction means that the adjusted OR for log(acid) depends on grade. To see this, let LA = log(acid). Then odds of nodal involvement = eα+β1 Xray+β2 size+β3 grade+β4 LA+β5 size∗grade+β6 LA∗g so for fixed Xray, size, and grade odds of nodal involvment at LA + 1 odds of nodal involvment at LA
1 Xray+β2 size+β3 grade+β4 (LA+1)+β5 size∗grade+β6 (LA+1)∗grade) = exp(α+β exp(α+β1 Xray+β2 size+β3 grade+β4 LA+β5 size∗grade+β6 LA∗grade) = e(β4 +β6 grade eβ4 grade = 0 = β e 4 +β6 grade = 1
This adjusted OR depends on grade (because LA and grade interact), but not on size or Xray (because LA does not interact with either). We can interpret β6 , the LA*grade coefficient, as a measure of how the adjusted OR for LA changes with grade.
121
11
LOGISTIC REGRESSION - INTERPRETING PARAMETERS
Given that the model contains a size*grade and a log(acid)*grade interaction, the adjusted OR for grade depends on the size and log(acid) levels. I’ll note, but you can easily show, odds for nodal involvement for grade = 1 = eβ3 +β5 size+β6 log(acid) odds for nodal involvement for grade = 0 where β5 is the grade*size coefficient and β6 is the log(acid)*grade coefficient. In summary, interactions among variables make interpretations of effects of individual variables on OR harder (OK, lots harder!) The ideal world has no interactions — but we don’t live in such a world.
Stata Analysis Raw data are available on the web page. Output from fitting the model in Stata follows: . gen logacid=log(acid) . xi: logistic nodal i.xray i.size i.grade logacid i.size*i.grade i.grade*logacid i.xray _Ixray_0-1 (naturally coded; _Ixray_0 omitted) i.size _Isize_0-1 (naturally coded; _Isize_0 omitted) i.grade _Igrade_0-1 (naturally coded; _Igrade_0 omitted) i.size*i.grade _IsizXgra_#_# (coded as above) i.grade*logacid _IgraXlogac_# (coded as above) note: _Isize_1 dropped due to collinearity note: _Igrade_1 dropped due to collinearity note: _Igrade_1 dropped due to collinearity note: logacid dropped due to collinearity Logistic regression Number of obs = 53 LR chi2(6) = 33.97 Prob > chi2 = 0.0000 Log likelihood = -18.143573 Pseudo R2 = 0.4835 -----------------------------------------------------------------------------nodal | Odds Ratio Std. Err. z P>|z| [95% Conf. Interval] -------------+---------------------------------------------------------------_Ixray_1 | 10.38589 11.26382 2.16 0.031 1.239622 87.01579 _Isize_1 | 23.05661 26.99148 2.68 0.007 2.324485 228.6989 _Igrade_1 | 21187.36 98875.09 2.13 0.033 2.258257 1.99e+08 logacid | 5.520827 7.841721 1.20 0.229 .3411671 89.33903 _IsizXgra_~1 | .0035255 .0085831 -2.32 0.020 .0000298 .4164339 _IgraXloga~1 | 33724.72 223942.7 1.57 0.116 .0751111 1.51e+10 -----------------------------------------------------------------------------. xi: logistic nodal i.xray i.size i.grade logacid i.size*i.grade i.grade*logacid,coef i.xray _Ixray_0-1 (naturally coded; _Ixray_0 omitted) i.size _Isize_0-1 (naturally coded; _Isize_0 omitted) i.grade _Igrade_0-1 (naturally coded; _Igrade_0 omitted) i.size*i.grade _IsizXgra_#_# (coded as above) i.grade*logacid _IgraXlogac_# (coded as above) note: _Isize_1 dropped due to collinearity note: _Igrade_1 dropped due to collinearity note: _Igrade_1 dropped due to collinearity note: logacid dropped due to collinearity Logistic regression Number of obs = 53 LR chi2(6) = 33.97 Prob > chi2 = 0.0000 Log likelihood = -18.143573 Pseudo R2 = 0.4835 -----------------------------------------------------------------------------nodal | Coef. Std. Err. z P>|z| [95% Conf. Interval] -------------+---------------------------------------------------------------_Ixray_1 | 2.340448 1.084531 2.16 0.031 .2148063 4.46609 _Isize_1 | 3.137952 1.170661 2.68 0.007 .8434986 5.432406 _Igrade_1 | 9.96116 4.666701 2.13 0.033 .8145935 19.10773 logacid | 1.708528 1.420389 1.20 0.229 -1.075383 4.492438 _IsizXgra_~1 | -5.647741 2.434592 -2.32 0.020 -10.41945 -.8760275 _IgraXloga~1 | 10.42599 6.640313 1.57 0.116 -2.588787 23.44076 _cons | -2.552712 1.039703 -2.46 0.014 -4.590494 -.5149311 ------------------------------------------------------------------------------
122
11
LOGISTIC REGRESSION - INTERPRETING PARAMETERS
***************** Make sure you understand what variables are being fit! -----------------------------------variable name variable label -----------------------------------_Ixray_1 xray==1 _Isize_1 size==1 _Igrade_1 grade==1 _IsizXgra_1_1 size==1 & grade==1 _IgraXlogac_1 (grade==1)*logacid -------------------------------------
Note that I did not actually need to use xi here since the variables were already binary and coded as 0 and 1, but this is the safe way to do things. The fitted model is µ
pˆ log 1 − pˆ
= −2.55 + 2.34 Xray + 3.14 size + 9.96 grade + 1.71 log(acid) −5.65 size ∗ grade + 10.43 log(acid) ∗ grade
If a primary question was the impact of a positive Xray, we can conclude that for fixed levels of size, grade, and log(acid) d for Xray = 1 vs. Xray = 0 is e2.34 = 10.39 OR
i.e. the odds of nodal involvement are 10.39 times higher for patients with positive X-rays than for patients with a negative X-rays (adjusting for size, grade, and log(acid)). The lack of interaction makes this a clean interpretation. If a primary question was the impact of log(acid) (LA) level, then for fixed size tumor and X-ray result, recalling 1.709 is the LA coefficient and 10.43 is the grade coefficient, d for LA + 1 vs. LA is e1.709+10.43∗grade OR ( e1.709 = 5.52 if grade = 0 = 1.709+10.43 e = 186, 838 if grade = 1
For less serious tumors (grade = 0) the odds of nodal involvement increase by 5.52 for each increase in 1 LA unit. For more serious tumors (grade=1) the odds increase by 186,838. Remark: The log(acid)*grade interaction is not significant at the 10% level (p-value = .116). An implication is that the estimated adjusted OR for log(acid) when grade = 1 (i.e. 186,838) is not statistically different from the adjusted OR for log(acid) when grade = 0 (i.e. 5.52) — why? Because in a model without the log(acid)*grade interaction, those estimated ORs would be equal. A sensible strategy would be to refit the model without this interaction. We will discuss such strategies later.
123