5.3 IMPLEMENTATION OF A DIRECT SENSITIVITY METHOD INTO CMAQ Daniel S. Cohan, Yongtao Hu, Amir Hakami, M. Talat Odman, Armistead G. Russell Georgia Institute of Technology, Atlanta, GA e-mail:
[email protected] Voice (404) 894-3089 We have implemented the Direct Decoupled Method (DDM) of sensitivity analysis in the Community Multiscale Air Quality (CMAQ) model. DDM calculates the local, first-order sensitivities of gas-phase pollutant concentrations to perturbations in emissions, initial conditions, and boundary conditions. This method yields results that are in good agreement with traditional “brute force” calculations of sensitivity, without necessitating multiple runs of the air quality model. We apply CMAQ with DDM to an ozone episode in the southeastern United States.
1. INTRODUCTION For many policy and scientific applications in air quality modeling, it is desirable to know not only the ambient pollutant concentrations that would result from a certain situation, but also the extent to which those concentrations would change under various perturbations. Policymakers might ask how much a city’s ozone concentrations would change if cars were required to emit less nitrogen oxides, or if a new power plant was built. Air pollution modelers might ask the extent to which their results depend on assumptions of initial conditions, boundary conditions, or chemical reaction rate constants. Traditionally, these questions of atmospheric sensitivity have been addressed with a “brute force” method. An air quality model is run once under “base case” conditions, and the resulting predictions of ambient pollutant concentrations are compared with successive model runs in which perturbations are made to model inputs. This brute force method is simple, but becomes inefficient when a large number of sensitivities are desired. A variety of formal sensitivity analysis methods have been developed as alternatives to brute force, but many of them suffer from numerical instability or computational inefficiency. The direct decoupled method (DDM), however, has been demonstrated to be accurate and efficient in box
and 3-dimensional Eulerian air quality models (Dunker 1981, Yang et al. 1997, Dunker et al. 2002). In this abstract we present the implementation of first-order, gas-phase DDM into the Community Multiscale Air Quality Model (EPA 1999). We discuss the derivation of DDM and show how it can be incorporated into CMAQ. We then apply DDM to an ozone episode in the Southeast United States and evaluate its accuracy and utility.
2. METHODOLOGY CMAQ, like other Eulerian models of the atmosphere, computes the evolution of species concentrations by a numerical approximation of the mass balance equation governing reactive transport: ∆C i = [advection] + [diffusion ] + [deposition] + ∆t [chemistry ] + [emissions ] + [clouds ] where [process] is the numerical representation of an atmospheric process and Ci is the concentration of species i. DDM assesses the sensitivity of C to perturbations in model inputs of emissions, by defining: I j ( x, t ) = I j , 0 ( x, t ) + ε j ⋅ p j ( x, t ) S i , j ( x, t ) =
∂C i ( x, t ) ∂ε j
Here, εjpj is a perturbation to a base case model input Ij,0 (an emission rate, initial condition, or boundary condition); and S is the sensitivity of C to the perturbation of the model input. Since S is a local, first-order measure of sensitivity, its accuracy in characterizing the impact of input perturbations on concentrations will diminish with the size of the perturbation and the nonlinearity of the response. Our implementation provides broad flexibility in the form of the perturbation to model inputs: a static or time-variant change, for an individual species or group of species, and from a single gridcell, a region, or the entire domain.
To compute the time variance of S, we differentiate Equation 1 with respect to ε: ∆S i , j ∂ ∂ [advection] + [diffusion] + = ∆t ∂ε ∂ε ∂ ∂ [deposition + [chemistry ] + ∂ε ∂ε ∂ ∂ [emissions ] + [clouds] ∂ε ∂ε DDM calculates S in the above equation by applying the same numerical algorithms used to calculate C, as described in detail by Yang et al. (1997). This simplifies the implementation of DDM and provides consistency between calculations of sensitivities and concentrations. The sensitivity of domainwide concentrations to a single emitter may be computed by applying DDM to a perturbation in emissions from a single emitting gridcell. To assess the inverse “area of influence” relationship ― how concentrations at a single receptor would be affected by a unit emission from each other gridcell — we first generate sensitivity coefficients for the domainwide response to emissions from a number of individual gridcells. The sensitivity of an individual receptor to emissions from each other gridcell can then be estimated by computing the distance-weighted average of the single-emitter sensitivity coefficients. To demonstrate DDM, we apply CMAQ to an ozone episode on August 11-13, 2000, in the southeastern United States. The 57x60 gridcell domain has a horizontal resolution of 12 kilometers, with 13 layers in the vertical (7 layers in the lowest kilometer). Emissions are obtained from the Southern Appalachian Mountains Initiative inventory for 1995 (Pechan 2002), projected to the year 2000. Default initial and boundary conditions from CMAQ are used as a base case. We focus on the sensitivity of ozone concentrations to changes in emissions, initial conditions and boundary conditions.
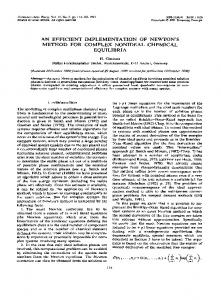
3. RESULTS Figure 1 shows a snapshot of the sensitivity of ozone to the western boundary condition of NOx, 24 hours into the episode. The quantities in Figure 1, ranging from 0 to 0.002 ppm, represent the local rates of change in ozone as the nitrogen oxides (NOx=NO+NO2) boundary conditions change from the default values (0.25ppb at surface, decreasing with altitude), scaled to a 100% increase in the boundary conditions. Note that sensitivities are largest in the southwest quadrant, because inflow
is occurring in the southwest but not the northwest of the domain. The impact of NOx boundary conditions extends into eastern Georgia.
Fig. 1 Sensitivity of ozone to the western boundary condition of NOx, 24 hours after the episode began, as calculated by DDM. The sensitivity of ozone concentrations to initial conditions of ozone was estimated with both DDM and the “brute force” method. For “brute force”, ozone concentrations were computed for: (1) default initial conditions (ozone = 0.035 ppm at surface, increasing with altitude), (2) ozone initial conditions increased by 25%, and (3) ozone initial conditions decreased by 25%. The DDM estimates of ozone sensitivity, scaled to a 50% change in ozone initial conditions, closely match the “brute force” results (ozonecase2 – ozonecase3) throughout the 3-day episode. Figures 2a and 2b show the spatial and quantitative consistency of the two methods after 24 hours. Similar consistency was found in DDM and brute force estimates of the sensitivity of ozone to a ±20% change in domainwide NOx emissions (not shown).
emission point, due to titration of ozone by NO, but become positive downwind of the site due to ozone formation.
Figure 3 Sensitivity of surface ozone concentrations to a unit emission of NO from a point in Atlanta in model layer 6, at noon on the third day of the episode.
Figure 2 Sensitivity of ozone to a 50% change in initial conditions, 24 hours after the episode began, as calculated by (a) brute force method and (b) DDM. We computed the DDM sensitivity of ozone to a continuous 1 mole/s perturbation in emissions of NO from each of nine points centered on Atlanta, for both surface emissions and emissions from model layer 6 (approximately 300-600 m, representative of an elevated industrial source). Daytime sensitivity of ozone to each emission point exhibited a plumelike pattern as shown in Figure 3. The sensitivity coefficients are typically large and negative in the immediate vicinity of the
We then performed distance-weighted interpolation on the sensitivity coefficients from the Layer 6 emission points to assess the sensitivity of surface ozone in a single receptor in Atlanta to perturbations in elevated emissions from various locations. Whereas the original sensitivity coefficients indicate the impact of single emission points on the entire domain, the interpolated results estimate how a single receptor would be affected by a unit perturbation in emissions from each point in the domain. We refer to this as the area of influence (AOI). As shown in Figure 4, an Atlanta receptor is most sensitive to emissions from the upwind (at this time, northeast) direction. As with forward sensitivities, the inverse sensitivity coefficients closest to the receptor are actually negative, but coefficients are positive or zero elsewhere. Note that the magnitudes of sensitivity coefficients in Figure 4 are comparable to those in Figure 3, but the direction of the “plume” is inverted (upwind vs. downwind).
Figure 4 Sensitivity of surface ozone at an Atlanta receptor (12 EST on Day 3) to a continuous 1 mole/s emission into model layer 6.
4. CONCLUSIONS We have shown DDM to be a powerful and accurate method of assessing the sensitivity of pollutant concentrations to inputs in the CMAQ model. This method offers wide functionality for policy and scientific applications in which the sensitivity of results to perturbations is often as important as the results themselves. The strong agreement between DDM and brute force results, even for perturbations as large as 40 or 50% centered on a base case, suggests DDM sensitivity results could remain reliable over substantial ranges. Ozone provides a rather rigorous test of DDM, because it is governed by relatively nonlinear and complex chemical reactions. Despite the nonlinearities of ozone chemistry, the consistency between DDM and “brute force” indicates overall sensitivity of ozone to ozone initial conditions and to NOx emissions may be somewhat linear over the perturbation ranges and episode conditions modeled here. We must caution that DDM is, at best, only as accurate as the underlying model because it operates using the same algorithms and assumptions. The consistency with “brute force” indicates DDM is well representing relationships within the model. Experimental validation is unavailable because it is typically impossible to observationally isolate the response of concentrations to emission perturbations, given the dynamic nature of the atmosphere.
Our work with the DDM method in CMAQ is ongoing. Future work will extend CMAQ-DDM to compute aerosol sensitivities and incorporate plume-in-grid functionality. DDM can also be extended to compute higher order coefficients that capture the non-linearity of pollutant response (Hakami and Russell, 2002). The use of sensitivity coefficients in an inverse mode to deduce receptor-based AOI response to emissions (Figure 4) had not been extensively explored prior to this work. Ongoing work will examine the number and placement of the emission “test points” needed to optimize the accuracy of interpolations for one or more receptors. The inverse sensitivity method could provide a powerful tool for targeting emission control programs to best impact a non-attaining receptor, to situate new facilities where they will be less likely to enhance ambient pollution, or to assess the geographic origin of atmospheric pollutants.
5. REFERENCES Dunker, A., 1981: Calculation of sensitivity coefficients for complex atmospheric models. Atmos. Environ., 15, 1155-1161. Dunker, A., G. Yarwood, J. Ortmann, and G. Wilson, 2002: The decoupled direct method for sensitivity analysis in a three-dimensional air quality model—Implementation, accuracy, and efficiency. Environ. Sci. Technol., 36, 2965-2976. EPA, 1999: Science algorithms of the EPA Models-3 Community Multiscale Air Quality (CMAQ) Modeling System, Ed. D.W. Byun and J.K.S. Ching, EPA/600/R-99/030. Hakami, A. and A. Russell, 2002: Full, direct sensitivity analysis of multidimensional air quality models. Submitted to Environ. Sci. Technol. E.H. Pechan and Associates, 2002: Southern Appalachian Mountains Initiative (SAMI) emission projections to 2010 and 2040: Growth and control data and emission estimation methodologies. Available at www.saminet.org. Yang, Y-J, J. Wilkinson, and A. Russell, 1997: Fast, direct sensitivity analysis of multidimensional photochemical models. Environ. Sci. Technol, 31, 2859-2868.