Journal of Fish Biology (1997) 51, 526–545
A comparison of univariate and multivariate numerical and graphical techniques for determining inter- and intraspecific feeding relationships in estuarine fish S. M* M. E† *Department of Biological Sciences, University of Hull, Cottingham Road, Hull, HU6 7RX, U.K. (Received 17 May 1996, Accepted 25 March 1997) The advantages and disadvantages of various numerical and graphical techniques for the analysis of inter- and intraspecific feeding relationships of fishes were examined. All methods have been cited in the literature since 1988. The index of preponderance, the resultant index and graphical methods proposed by Costello and Tokeshi were used to illustrate the relative importance of prey species to an individual fish species with no differentiation between size classes. Inter- and intraspecific competition and niche overlap were determined from multivariate analysis [the ordination technique, detrended correspondence analysis, cluster analysis by the Bray–Curtis equation, per cent overlap and two-way indicator species analysis (TWINSPAN)]. The identity of the prey organisms are not lost in the comparisons, and the value of this is determined through comparison with techniques such as Shannon–Wiener which obscure these data. The Shannon–Wiener diversity index was combined with an analysis of ‘ evenness ’ to refine the technique further to assess niche breadth, as was the Levins index. The study shows that to give an estimate of competition within the community, it is important to assess the data with respect to seasonal and temporal patterns using multivariate analysis. ? 1997 The Fisheries Society of the British Isles
Key words: multivariate; univariate; feeding; analysis.
INTRODUCTION The essence of using any statistical technique for biological data analysis is to determine robust trends and patterns and prevent spurious conclusions being reached (Elliott, 1994). Studies of the feeding biology of fish produce extensive data which are suitable for being analysed in many ways. While univariate techniques may provide a simple quantitative description of stomach contents, multivariate and correlative techniques are available for determining affinities in the feeding biology within and between species and populations. Individual papers may specify one or two methods for the analysis (e.g. Evans, 1983; Hansson, 1984; Carter et al., 1991), but not all give the reasons for selecting the technique. In addition there are few papers giving a comparison of different methods, with the exceptions contrasting only a few techniques (e.g. Smith & Zaret, 1982; Krebs, 1989; Tokeshi, 1991). Thus, there is the need for an objective comparison of the most suitable techniques available to illustrate a particular aspect of data. For example, there are several statistical methods cited *Present address: West Sutherland Fisheries Trust, Gardeners Cottage, Scouriebeag, Scourie, by Lairg, Sutherland, IV27 4SX, U.K. †To whom correspondence should be addressed. Tel.: +44 (0)1482 465503; fax: +44 (0)1482 465458; email:
[email protected] 526 0022–1112/97/090526+20 $25.00/0/jb970457
? 1997 The Fisheries Society of the British Isles
527
T I. A summary of the aims of the dietary analysis and the stastistical techniques available Aim of analysis
Statistical methods available
Determine the dominant prey items Assess feeding behaviour Assess the complexity of the diet Describe similarities in diet between species Assess the diet in relation to environmental factors
Index of preponderance; Costello graphical method; weighted resultant index Costello graphical method; Tokeshi graphical method Shannon-Wiener index; evenness index; Levins index; cluster analysis Cluster analysis; Renkonen index; TWINSPAN; DECORANA; PCA DECORANA; PCA; CANOCO; PRIMER
within the literature which can be used to quantify the feeding habits and diets of fish, e.g. detrended correspondence analysis, DECORANA (Hill, 1987) and the Spearman rank correlation (Zar, 1984), which are of value in determining robust trends and patterns within the data. Each statistical technique provides only a part of the required information and thus it is likely that several different methods will be required to determine patterns within the data. Similarly, different methods will be required to assess particular features of the data (Table I). Therefore, while simple data summary and presentation will provide the first assessment of stomach contents according to the nature and quantity of prey taken (Bagenal, 1978), multivariate analyses will allow patterns to be determined within a large and complex quantitative data matrix of attributes (e.g. prey items) against samples (e.g. sizes or species of fish) (Jongman et al., 1987). A study of the feeding dynamics of fish in the Humber estuary, on the east coast of England, has enabled a comparison of statistical techniques used in the assessment of diets within fish populations. Ten techniques were selected, covering a range of univariate and multivariate analyses cited within the literature. While not representing all of the techniques available, they cover a range of available options and represent techniques used within the literature in recent years. MATERIALS AND METHODS The data for prey abundance and biomass were collected through stomach content analysis of fish caught within the Humber estuary, using a 2-m beam trawl, between April 1992 and November 1994. The eight dominant species were divided into size classes, small, medium and large, based on the use of cluster analysis to determine the length at which dietary change occurred (data available in Marshall, 1995), and a comparison of different species and sizes of fish was undertaken using univariate and multivariate techniques. An analysis of the feeding of the sole Solea solea (L.), has been undertaken using the univariate methods of the index of preponderance and the weighted resultant index (Mohan & Sankaran, 1988) and the graphical method proposed by Costello (1990). Further univariate analyses performed on all species were the Shannon–Wiener diversity index, together with a measure of ‘ evenness ’ (Zar, 1984), Levins measures of niche
528
. .
breadth and standardized niche breadth (Krebs, 1989), and the graphical method proposed by Tokeshi (1991). The multivariate techiques were cluster (classification) analysis, using the Bray–Curtis similarity coefficient followed by dendrogram production using group-average sorting (Ludwig & Reynolds, 1988), the Renkonen index (Krebs, 1989), Two-way indicator species analysis, TWINSPAN (Hill, 1987), and the ordination technique detrended correspondence analysis, DECORANA (Hill, 1987). The index of preponderance (IP) produces a single value for each attribute based on % occurrence and weight and using the equation:
where Vi and Oi are % weight and occurrence respectively. The relative importance of the % occurrence and weight terms within the index are not determined, and no graph is produced. A comparison of the values obtained enables a ranking of the prey in order of importance within the diet. The weighted resultant index (R) is used to assess the diet of an individual species. The importance of each attribute within the diet is determined as a function of the % occurrence and weight. A single value is calculated for each attribute using the equation:
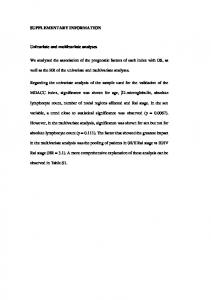
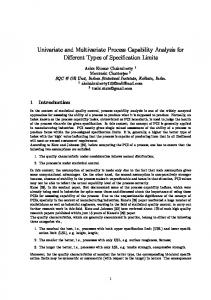
where Q=(45"Pè"45P)/45; è=tan "1 (oi/vi); oi =% occurrence; vi =% weight. This is plotted against è to indicate prey importance within the diet. By using the angle è, the relative importance of the percent weight and occurrence terms is determined, with the more representative, and thus important, items grouped around è=45). The Q value also enables a grading of the items in order of importance. The graphical method of Costello (1990) also utilizes the % occurrence and weight of each attribute. In this instance % occurrence is plotted against % weight and then interpreted with respect to the position within the graph (Fig. 1). Tokeshi (1991) uses the mean individual feeding diversity (DI) plotted against the population feeding diversity (DP) to indicate the feeding strategy of the species. DI and DP are determined using the following equations:
DP =ÓPi ln Pi where N=the total number of fish; Pij =the proportion of prey-type i in the jth fish; Pi =the proportion of prey-type i in the entire fish population, and the data points for each species are graphed and analysed (Fig. 2). The Shannon–Wiener information statistic (H*) and evenness index (J), the standardized value of H*, are: H*= "ÓPi ln Pi J=H*/H*max respectively, where Pi =proportion of the observations found in category i and H*max =ln(k), the maximum possible diversity for a set of data consisting of k categories.
529
100 Dominant
y
g te ra St
Pr ey
% Weight
g in ed
Im
Fe
po r
ta nc e
Specialization
Rare
Generalized
0
100 % Occurrence
F. 1. Guide to the interpretation of the Costello graphical method, showing the positioning of the axes and the important diagonals (after Costello, 1990).
Generalist Homogeneous feeding
DI
Specialist
Generalist Heterogeneous feeding
DP F. 2. Guide to the interpretation of the Tokeshi graphical method (after Tokeshi, 1991).
A single value is produced for each sample which can then be compared, enabling interand intraspecific analyses. The Shannon–Wiener Index, as a summary of the diversity of prey organisms encountered, gives an indication of niche breadth.
530
. .
The Levin measure of niche breadth (B) and standardized measure (BA) are: B=1/Óp2j
respectively, where pj =proportion of the diet comprising prey species j; and n=the total number of prey species. A single value is produced which represents the niche breadth for the species. The Bray–Curtis cluster analysis also produces a grouping of the samples with similar attributes based on the group average sorting of the similarity coefficient. This is a cumulative rather than a divisive technique, i.e. it starts with separate samples and builds them into groups rather than starting with a large group and dividing down. The similarity coefficient (Cz) equation computed for each pair of species/sizes:
has been used, where w=sum of lower % occurrence value of each prey species common to the two fish species (including tied values); a=sum of the % occurrence of prey in the first species; b=sum of the % occurrence of prey in the second species, and the subsequent results have been plotted as a dendrogram. In describing the similarity of diets between any pair or grouping of species, it is considered here that the multivariate techniques indicate niche overlap between and within species. A further measure of niche overlap is the Renkonen index, or % overlap (Krebs, 1989): Pjk =[Ó(minimum pij, pik)]100, where Pjk =the percentage overlap between the two species and pij, pik =proportions of prey i in the diet of each of the two species. TWINSPAN and DECORANA are ordination techniques, which order the samples, i.e. fish species and/or size according to their food attributes, i.e. prey abundance. While TWINSPAN produces an ordered two-way array of both samples and attributes (Hill, 1987), DECORANA orders the samples in a low-dimensional space (ter Braak, 1987). Within both techniques the samples with the greatest affinity are grouped together. TWINSPAN orders the samples based on reciprocal averaging, giving the main divisions of the groups together with an indication of the main attributes responsible for each division. DECORANA, however, orders the samples with regard to the attributes but produces a continuous rather than discrete grouping. The subsequent results can then be assessed with respect to different environmental or biological parameters.
RESULTS The % occurrence and % weight of each prey item within the diet of the different species and size classes used for these analyses provide a simple description of the diet and enable comparisons with other studies. These data are available elsewhere (Marshall, 1995). Most of the species compared are benthic, with one pelagic, sprat Sprattus sprattus L., and two demersal species, cod Gadus morhua L., and whiting Merlangius merlangus L. SINGLE-SPECIES ANALYSES
In order to provide a description of the diet of a single species, only univariate analyses are required. Each technique selected shows the most important prey
531
12 Arenicolidae
10
% Weight
8 Nereis
6
4 Corophium Crangonidae Polychaeta
2
Carcinus Nephtydae Amphipoda Mysidae Gammarus Aphroditidae Gammaridae
0
2
4
6
8
10 12 % Occurrence
14
16
18
F. 3. The importance of prey items in the diet of sole, and feeding behaviour of the species, as determined by the Costello analysis.
items within the diet, either in terms of occurrence or weight. The two graphical methods, Costello (Fig. 3) and weighted resultant index (Fig. 4), indicate the importance of prey in the diet by their position on the graph, with the more important prey items by either % occurrence or % weight being separated from the minor prey species. Due to the dominance of debris within the diet it was not possible to plot it in either of these graphs without losing considerable resolution. The index of preponderance produces a ranking of the prey items (Table II). Although using the same basic data, % occurrence and % weight, the results obtained from the three methods vary to some extent. ‘ Debris ’, the soft, semi-digested material, is found to be the dominant item in each case, followed by Arenicolidae, Nereis, Crangonidae and Corophium. Carcinus is not highlighted within the weighted resultant index, although found by the other two methods to have some importance in the diet. Corophium, with its position close to è=45) within the R analysis, would appear to be the main prey item of sole within this area, a finding not shown as clearly by the other methods used. Feeding behaviour is determined through the use of either the Tokeshi or Costello graphical methods. The Costello method relies on the distribution of prey items within the graph, while the Tokeshi method determines a single point for the species, and bases the feeding method on the position of this point within the graph (Fig. 5). While all species are shown in the graph, indicating its
. .
532 30
Debris
25
R
20
15
10
Arenicolidae
5
Nereis Crangonidae
Corophium
0 40
50
60
70 θ
Polychaeta
80
90
100
F. 4. The importance of prey items in the diet of sole, as determined by the weighted resultant index (R).
suitability for determining inter- and intraspecific comparisons, only the data for sole are discussed here. The results obtained from the two methods are different, with the spread of points on or below the diagonals of prey importance and feeding strategy (Fig. 1) within the Costello graph, indicating that most of the prey items are rare and that feeding is homogeneous, while the positioning within the Tokeshi graph indicates a generalist with a more heterogeneous feeding strategy. MULTISPECIES ANALYSES
A comparison of niche breadth was achieved through the use of the Shannon– Wiener index and associated ‘ evenness ’ index (Fig. 6) and Levins measure (Fig. 7). The results obtained from the two methods are similar, such that small pogge Argonus cataphractus (L.) and sprat appear to have the most specialized diet in terms of the number of prey items taken, although the goby Pomatoschistus spp. has the most highly skewed diet, i.e. greatest dependence on a limited prey group. The indices were highly significantly and positively correlated (H**B, r2 =0·881, n=14; J*BA, r2 =0·824, n=14) with each other. Similarly, sole and cod appear to have the most diverse diets, although the order is different between the two techniques. The most striking difference in results can be seen in a comparison between the standardized Levins index, BA, and the evenness index, J, for sole. Here, the standardized Levin measure is low,
533
T II. Ranking and values of each prey item in the diet of sole, as determined by the index of preponderance Prey
IP
Debris 93·3188 Arenicolidae 41·2937 Nereis 26·3602 Crangonidae 7·6478 Polychaeta 7·1116 Carcinus 4·1535 Nephtyidae 3·2971 Corophium 3·0537 Amphipoda 1·2781 Gammarus 1·0075 Mysidae 0·9459 Aphroditidae 0·8493 Gammaridae 0·8014 Ampharetidae 0·4455 Polydora 0·2814 Fish 0·1905 Brachyura crustacean 0·1827 Crangon crangon 0·1768 Terebellidae 0·1672 Lanice conchilega 0·1191 Phyllodocidae 0·0904 Phaxus pellucidus 0·0721 Opheliidae 0·0625 Nereis virens 0·0590 Metridium 0·0562 Stone/shell debris 0·0495 Ampharete grubei 0·0453 Sagartia 0·0407 Abra abra 0·0333
Prey
IP
Nephtys hombergii Gammarus zaddachi Gastrosaccus sanctus Orbiniidae Oedicerotidae Spionidae Unident. A. Abra tenuis Plant material Copepoda Sprattus sprattus Egg sac Carcinus maenas Ampeliscidae Abra Homarus Arenicola marina Macoma balthica Pandalus montagui Liocarcinus marmoreus Unident. B. Caprellidae Mysella bidenta Tellinacea Mollusc siphon Ensis Neomysis integer Erycinacea Bathyporeia
0·0287 0·0278 0·0155 0·0126 0·0057 0·0055 0·0046 0·0038 0·0031 0·0030 0·0024 0·0023 0·0022 0·0020 0·0016 0·0013 0·0012 0·0010 0·0009 0·0005 0·0004 0·0004 0·0003 0·0003 0·0003 0·0003 0·0002 0·0001 0·0000
indicating a reliance on a limited group of prey species, in comparison to the evenness index, which appears to indicate a diverse use of resources. Niche overlap was measured using the Bray–Curtis similarity coefficient (Fig. 8) and the Renkonen index (Fig. 9). Neither method appears to separate the species into groups with similar diets, indicating that the same prey items were consumed similarly by all of the fish species. The ordering of species, i.e. the degree of overlap between species, differs with each method despite the similarity in the results. The similarities in the diet, as measured by the Bray–Curtis coefficient and the Renkonen index, can also be used to produce interspecific dietary comparisons, such that species with similar diets are grouped together. A comparison of this method with the results of the ordination techniques TWINSPAN and DECORANA could therefore be expected to give similar results. From TWINSPAN (Fig. 10), there appear to be five groups of species present within the estuary, defined by the presence or absence of a restricted number of prey
. .
534 1.0
0.8 Large flounder
Large whiting Cod Medium whiting Large pogge Medium flounder Small flounder
Large plaice
0.6 DI
Small whiting
Sole
0.4
Small pogge Small plaice
0.2 Goby Sprat
0
0.5
1.0
1.5 DP
2.0
2.5
3.0
F. 5. The feeding behaviour of each species, including sole, as determined by the Tokeshi analysis.
taxa within the diet. By superimposing these groupings on the DECORANA ordination diagram (Fig. 11), a comparison of the two is possible. There are a few differences in the groupings achieved by the two ordination techniques, although the results are broadly similar. Medium-sized flounder Pleuronectes flesus L., appears to be marginal within the DECORANA plot, lying within the range of several groups. Similarly, the differences observed between goby and small whiting, and medium whiting and small pogge, within the TWINSPAN analysis are not apparent from DECORANA. However neither set of results has a grouping similar to that obtained from the Bray– Curtis classification. DISCUSSION SINGLE-SPECIES ANALYSES
The advantage of graphical analyses over the simpler, tabular techniques is mainly one of interpretation, with graphs permitting a rapid, visual comparison of data prior to further statistical analysis (Costello, 1990). From this, it appears therefore that the index of preponderance, with the production of a single value for each prey item, is the least suitable analyses for dietary comparisons (Mohan & Sankaran, 1988). However, each analysis has a series of advantages and disadvantages depending on the information required.
535 1.0
4
0.9 0.8 3 0.7
0.5
2
J
H'
0.6
0.4 0.3 1 0.2
Large whiting
Medium whiting
Small whiting
Sprat
Sole
Large pogge
Small pogge
Goby
Large plaice
Small plaice
Large flounder
Medium flounder
Small flounder
0
Cod
0.1 0.0
F. 6. Indicating the niche breadth of each species and size class as determined by the Shannon–Wiener H* (.), and evenness, J (-), indices.
In an assessment of the dietary composition of a single species or size class, the index of preponderance causes the prey to be ranked in order of mathematical dominance within the diet, while the graphical methods give a more subjective analysis. Thus, the interpretation appears more objective, indicating that the index of preponderance is the most suitable measure of prey dominance within the diet. However, this technique does not distinguish between the importance of prey items by weight or occurrence, a factor which may be of importance in an assessment of diets and the identification of small items which appear in many fish from large items which occur in only a few individuals (Mohan & Sankaran, 1988). Both graphical techniques differentiate the diets in this way, giving a more detailed analysis of the diet and enabling a better comparison of the results. The graphical techniques also are based on the % occurrence and weight, although using different equations and interpretations. Costello (1990) plots the two against each other, giving a basic assessment of the dietary diversity, while the weighted resultant index requires a more complex equation but provides a more detailed analysis. In both cases, however, the importance of the prey is determined from the position of the item within the graph, either from its
. .
536
0.5
8
7 0.4 6
0.3 BA
B
5
4 0.2
3
2 0.1
Large whiting
Medium whiting
Small whiting
Sprat
Sole
Large pogge
Small pogge
Goby
Large plaice
Small plaice
Large flounder
Medium flounder
Small flounder
0
Cod
1
0.0
F. 7. Indicating the niche breadth of each species and size class as determined by the Levins B (.), and standardized Levins BA (-), indices.
position along the diagonals, in the case of the Costello method, or the co-ordinate along the ordinate and position relative to the 45) line, for the weighted resultant index. An analysis of the sole data in both cases indicates one of the main disadvantages in the interpretation of these data. The data points are grouped along the x-axis, with few separated along the diagonals (Costello method) or the 45) line (weighted resultant index). In addition, the graph for the weighted resultant index is not symmetrical, with most prey groups having a è value >45). While this indicates that most prey items are scattered throughout the area, the interpretation of the data is dissimilar to that originally described for these methods and therefore inherently subjective. This creates a further disadvantage of the Costello method over the weighted resultant index, where the latter gives a less subjective interpretation as the important prey are separated along the ordinate, as opposed to a general separation along both axes. However, the combination of the different measures, % occurrence and weight, within the weighted resultant index can obscure the short-comings of each method rather than combine the advantages (Hall et al., 1990), thereby indicating that the simpler Costello technique may be more suitable for data interpretation in this
537
% Similarity
0
50
100 Cod
Small Small Medium Large Medium Sole pogge whiting whiting whiting flounder
Large Large Goby pogge flounder
Small plaice
Sprat
Large Small plaice flounder
F. 8. A dendrogram showing the dietary similarities between and within the species as determined by the Bray–Curtis classification analysis.
case. In addition, the similarity in results within both the index of preponderance and Costello graph indicate that the conclusions are robust and can be verified. A further analysis which can be obtained from the Costello graph is that of feeding behaviour (Costello, 1990). This is a subjective method, with feeding behaviour described by the position of the points within the graph, such that the grouping of points along the ‘ feeding strategy ’ axis (Fig. 1) is used to describe the diet. An analysis of the diet of the sole indicates the shortcomings of this method, with most points being arranged along the x-axis, in the bottom left corner. Notice also that ‘ debris ’, the highest percentage item, could not be placed in Fig. 3, being an extreme point, which is another limitation of this method. In addition, the occurrence of a ‘ generalized ’ diet, one with a wide niche breadth, as highlighted by a cluster of points within the bottom right corner, can be seen to be an unlikely occurrence. This latter point was highlighted by Tokeshi (1991), who indicated that a generalized diet is more likely to be illustrated by the occurrence of many prey items occurring within the diet with a low % weight. Similarly, the occurrence of prey items of a high % weight but low % occurrence, top left corner, is more likely to symbolize the occurrence of a large organism as a rarity within the diet rather than a generalized diet for the species. This can be contrasted with the more objective analysis proposed by Tokeshi (1991), in which feeding strategy is defined according to individual and population niche breadth. Based on the Shannon–Wiener index H*, this gives a more objective analysis of the data. Analysis of the results obtained within
. .
538
Renkonen index (% similarity)
0
50
100 Goby
Small Small Medium pogge whiting whiting
Cod
Large Sprat whiting
Large Medium Large Large pogge flounder plaice flounder
Sole
Small Small plaice flounder
F. 9. A dendrogram showing the dietary similarities between and within the species as determined by the Renkonen index.
Polydora; Macoma; Caprellidae Mysidae Amphipoda
Crangonidae Polychaeta
Small flounder Large flounder
A
Medium flounder Cod Small plaice Goby Large plaice Medium whiting Sole Large whiting B
C
Large pogge
Small pogge Sprat Small whiting
D
E
F. 10. A dendrogram showing the multispecies dietary comparisons using the TWINSPAN analysis, with indicator prey species given for each group.
this study with those from the literature (Kislalioglu & Gibson, 1977; Kühl & Kuipers, 1979; Costa & Elliott, 1991) would suggest that the feeding strategy is defined accurately within the limits of the Humber estuary fish assemblage. Thus, in an assessment of feeding strategy, it appears that the method proposed by Tokeshi (1991) is more appropriate than that of Costello (1990).
539
200 Small plaice
180 160
B Sole
140
Large plaice
Axis 2
120 100
D Large pogge Large flounder
Cod
C
80 Medium flounder
60 40
Sprat
E
Large whiting
Goby Small whiting
A
Medium whiting Small pogge
20 Small flounder
0
20
40
60
80
100 120 140 160 180 200 220 Axis 1
F. 11. Diagram showing the multispecies dietary comparisons using the DECORANA analysis, groupings from the TWINSPAN analysis are encircled for comparison.
MULTISPECIES ANALYSES
The analysis of niche breadth can be regarded as a single-species analysis, although for the purposes of this paper the comparison of niche breadth between species is being treated as a multispecies analysis. The two methods compared here represent a small proportion of those available (Washington, 1984; Krebs, 1989), but are commonly used within the literature (Southwood, 1966; Hall et al., 1990; Hamerlynck & Hostens, 1993; Hamerlynck & Cattrijsse, 1994; Mol, 1995). It has been suggested (Krebs, 1989) that the Levins index may be a more suitable measure of niche breadth as it gives more weight to the abundant resources, while the Shannon–Wiener Index is more sensitive to the rarer resources. However, any ecological interpretation of the results are dependent on the form of the original resource matrix (Hall et al., 1990), as can be seen from the analysis of the Humber estuary fish assemblage, which indicates that there is little difference in the comparison of either niche breadth measure, H* or B. Differences arise, however, when comparing the standardized niche breadths, BA and J. Not only is the range of values obtained greater for the ‘ evenness ’ than the standardized Levins index, but there is a greater interspecific variability found within the Levins index. Thus it is within these calculations that the importance of the rarer species, as described in Krebs (1989), becomes apparent, with the ‘ evenness ’ index reflecting the diversity of the diet more than the Levins index, which appears to have a stronger relationship to the number of dominant
540
. .
resource groups. The use of the standardized equations, either J or BA, would therefore appear to be more suitable indices than either the Levins or Shannon– Wiener indices, when describing the niche breadth. Therefore it appears that the Shannon–Wiener index, with its greater sensitivity towards the rarer species, gives the most appropriate indication of the overall niche breadth. However when making interspecific comparisons, the Levins index may be more appropriate, as it down-weights the rarer prey resources which form only a minor component by weight of the diet. Similarly, the analysis of niche overlap can be performed using a number of cluster analyses (Krebs, 1989). Of the two indices selected for the purpose of this comparison, the Renkonen index is a commonly used method within the literature (Krebs, 1989; Hamerlynck & Hostens, 1993; Hamerlynck & Cattrijsse, 1994) and is relatively simple to perform, giving the exact degree of overlap rather than an index, or assumed value. In addition, there is a low variability in results due to changes in sample size or prey diversity (Krebs, 1989). This compares to the Bray–Curtis analysis which is strongly affected by sample size, being particularly poor in diverse communities with large sample sizes (Krebs, 1989). Although a review of overlap indices (Smith & Zaret, 1982) found that the Renkonen index showed the greatest increase in bias with increasing numbers of resources compared to other measures, the lack of variability due to changing sample size makes this the preferred method when compared to the Bray–Curtis measure of similarity. When assessing inter- and intraspecific dietary similarities, the most commonly used techniques are classification techniques, e.g. Bray–Curtis (Rice, 1988) and DECORANA (Sheldon & Meffe, 1993). Within the same (Cornell Ecology) package as DECORANA, TWINSPAN can also be used to group the fish species (Hill, 1987) according to specific, ‘ indicator ’, prey items. Although the two methods, classification and ordination, are used for this purpose, the differences between the methods are such that the results obtained highlight different aspects of the diet, and group the species accordingly. Thus, the Bray–Curtis classification technique gives a grouping based on the lower per cent occurrence value of each prey item within the diet of the two species, while TWINSPAN groups are based on the presence or absence of a particular prey species irrespective of its dominance within the diets. In addition, whereas cluster analysis and TWINSPAN give a grouping of the samples according to attributes, ordination techniques such as DECORANA arrange the samples along continua without, possibly artificial, grouping. A disadvantage of the Bray–Curtis method over TWINSPAN is the subjectivity of interpretation. During construction of the dendrogram, there is no limit beyond which the diets are statistically shown to be similar, or dissimilar. Thus during interpretation, an arbitrary value is selected in order to produce discrete groupings of the species (Ludwig & Reynolds, 1988). Similarly, DECORANA ranks the fish species according to parameters set within the programme but does not provide a statistical test with which to group the species. In contrast, TWINSPAN is objective, identifying groups by the parameters determined within the programme, although again there is no statistical test within the results (Jongman et al., 1987). Tests of statistical significance, if required, must then be performed on the parameters of the groups produced.
541
The advantage of the Bray–Curtis, however, is that any group of species indicated within the results is based on the full breadth of the diet, whereas TWINSPAN groups prey by the occurrence of indicator species only, and may classify the species by anomalies, i.e. a prey item which occurs in one individual only may separate that species into a ‘ group ’ containing one member. In each case, the indicator species may not necessarily be the dominant species responsible for the separation of species (Gauch, 1982). Similarly with DECORANA, where all prey items are used to determine the ranking of the species along the ordinal axes, thus removing the impact of rarities within the diet, i.e. prey items which occur in one individual, from the classification. Therefore, it would appear that TWINSPAN is less suitable for performing inter- and intraspecific dietary comparisons than the Bray–Curtis analysis despite the subjectivity of interpretation in the latter. Within the analyses of the Humber estuary fish assemblage the species groupings determined by TWINSPAN and DECORANA were similar, indicating that these analyses are compatible and should be used in conjunction with each other (Gauch, 1982). This is a function of the treatment of the data, with both techniques being based on the use of eigenvalues, and therefore treating the sample/attribute matrix in the same way. Thus it appears to be a more suitable method of using the techniques, as it combines the objectivity of the TWINSPAN analysis with the ordinal ranking of DECORANA. In addition, where required, statistical testing can be used to define the significance between the groups. That these results have no similarity to those obtained by the Bray–Curtis classification or Renkonen index, is a further indication of the differences within the techniques and their aims, indicating the non-robust nature of the techniques. TWINSPAN and DECORANA were designed for the analysis of ecological data (Gauch, 1982), and therefore reflect better the variability within the data, giving weight to the rare elements of the diet, although ‘ rarities ’ can be down-weighted as a function of the programme. In contrast, the Bray–Curtis analysis assesses the similarities between two data sets based on the difference in occurrence of each item within the two diets, and is dominated therefore by the abundant elements (Krebs, 1989). Thus, the lack of dietary similarity within the Humber estuary assemblage, as defined by the Bray–Curtis technique, may be a reflection of differences in the degree of dominance of each prey item within the diets rather than a lack of similarity in the prey items (Marshall, 1995). Analysis by TWINSPAN indicates that there are five main feeding groups within the assemblage, a factor supported by the DECORANA analysis. In addition, TWINSPAN provides information on the common elements within the diets, and the paths used to achieve the groupings. SUMMARY An assessment of dietary diversity and the inter- and intraspecific interactions within a region, in particular to assess the different features and determine the robustness of trends and patterns observed, requires the use of a variety of statistical techniques. In order to do this, it is important to determine the questions being addressed, and the level of analysis required. Thus, the
Determine the dominant prey items
Determine the dominant prey items, and illustrate the feeding strategy Determine the feeding strategy
Determine the niche breadth
Determine the niche breadth
Determine the niche overlap
Determine the niche overlap and similarity of species Determine the similarities in diet
Determine the similarities in diet
Weighted resultant index
Costello graphical
Shannon–Wiener
Levins index
Renkonen index
Cluster analysis
DECORANA
TWINSPAN
Tokeshi graphical
Determine the dominant prey items
Aims
Index of preponderance
Method
Objective, uses all prey items but gives greater weight to the dominant items, single value simple to compare Simple, produces actual values of overlap Based on all data, produces a graphical image linking all species Objective, all prey items are used to produce clusters of species, can be linked to other techniques Objective, can be linked to other techniques
Objective, uses all prey items, single value simple to compare
Objective, based on individual and population niche breadths
Graphical method, less subjective than Costello Graphical, simple to perform
Objective, gives a simple ranking of prey
Advantages
Results are the result of ordination not actual values
Bias increases with changing sample size Subjective, gives inordinate weight to the dominant species Gives inordinate weight to the rare species
Does not differentiate between the importance in relation to occurrence or weight, no graphical presentation possible Complex, combines all matrices so may obscure any short-comings Subjective, diet unlikely to follow the prescribed patterns Data will not always occur neatly within the graph, diversity index used gives weight to the rare prey items More sensitive to rare prey items, single value may obscure differences in the diet Single value may obscure any differences in the diets
Disadvantages
T III. Aims, advantages and disadvantages of each statistical technique to the analysis of dietary diet as determined by these analyses
To describe the diet of a single species or group
To determine the inter- and intraspecific differences
Aim of analysis
Yes
Have you measured weight or abundance?
543
Do you want to determine feeding strategies?
Yes Do you want a ranking of prey items by dominance?
No
Yes
Tokeshi graphics
Index of preponderance Yes
Do you want to determine the relative composition of the diet?
No
Do you want to determine feeding trends?
Yes
Weighted resultant index
Levins standardized or evenness indices
Do you want to determine feeding strategy?
No
Do you want to determine respective niche breadth?
No
Yes Yes
No
No
Costello graphics
Yes
Tokeshi graphics
Bray–Curtis classification or Renkonens index
Do you want to determine niche overlap?
No
Do you want to determine diet similarities?
Do you want to determine the niche breadth? TWINSPAN + DECORANA ShannonWiener index or Levins index F. 12. Flow chart indicating the protocol used to describe the diet of a single species or size class, or to determine inter- and intraspecific dietary comparisons, based on the requirements of the study.
544
. .
provision of the data in simple form, i.e. a list of prey taxa, % occurrence, weight, volume, fullness and total number of prey taxa, will summarize the data and may enable some comparisons, while graphs can be useful for comparing results. Statistical techniques can then be used to determine the significance of any differences observed, while ordinations and clustering techniques are more suitable for large data sets. Table III summarizes the advantages and disadvantages of each technique and shows that a variety of techniques are required to assess fully the inter- and intraspecific relationships. The comparison of those techniques has enabled a protocol to be devised in order to describe and interpret the feeding relationships fully (Fig. 12). We thank Humberside County Council and the National Rivers Authority for funding this project; J. Allen for assistance with the use and interpretation of the multivariate statistical methods; L. Smoljanovic for constructive comments; M. Costello for his valuable suggestions and discussion; and three anonymous referees for their comments on an earlier version of the manuscript.
References Bagenal, T. B. (1978). Methods for Assessment of Fish Production in Fresh Waters, 3rd edn. IBP Handbook No. 3. Oxford: Blackwell Scientific Publications. Carter, C. G., Grove, D. J. & Carter, D. M. (1991). Trophic resource partitioning between two coexisting flatfish species off the north coast of Anglesey, North Wales. Netherlands Journal of Sea Research 27, 325–335. Costa, M. J. & Elliott, M. (1991). Fish usage and feeding in two industrialised estuaries—the Tagus, Portugal, and the Forth, Scotland. In Estuaries and Coasts: Spatial and Temporal Intercomparisons (Elliott, M. & Ducrotoy, J.-P., eds), pp. 289–297. Copenhagen: Olsen & Olsen. Costello, M. J. (1990). Predator feeding strategy and prey importance: a new graphical analysis. Journal of Fish Biology 36, 261–263. Elliott, M. (1994). The analysis of macrobenthic community data. Marine Pollution Bulletin 28, 62–64. Evans, S. (1983). Production, predation and food niche segregation in a marine shallow soft-bottom community. Marine Ecological Progress Series 10, 147–157. Gauch, H. G. (1982). Multivariate Analysis in Community Ecology. Cambridge: Cambridge University Press. Hall, S. J., Raffaelli, D., Basford, D. J., Robertson, M. R. & Fryer, R. (1990). The feeding relationships of the larger fish species in a Scottish sea loch. Journal of Fish Biology 37, 775–791. Hamerlynck, O. & Cattrijsse, A. (1994). The food of Pomatoschistus minutus (Pisces, Gobiidae) in Belgian coastal waters, and a comparison with the food of its potential predator P. lozanoi. Journal of Fish Biology 44, 753–772. Hamerlynck, O. & Hostens, K. (1993). Growth, feeding, production and consumption in O-group bib Trisopterus luscus L. and whiting Merlangius merlangus L. in a shallow coastal area of the SW Netherlands. ICES Journal of Marine Science 50, 81–91. Hansson, S. (1984). Competition as a factor regulating the geographical distribution of fish species in a Baltic archipelago: a neutral model analysis. Journal of Biogeography 11, 367–381. Hill, M. O. (1987). TWINSPAN—a FORTRAN Program for Two Way Indicator Species Analysis. Ithaca, NY, U.S.A.: Microcomputer Power. Jongman, R. H. G., ter Braak, C. J. F. & van Tongeren, O. F. R. (Eds) (1987). Data Analysis in Community and Landscape Ecology. Wageningen: Pudoc.
545
Kislalioglu, M. & Gibson, R. N. (1977). The feeding relationship of shallow water fishes in a Scottish sea loch. Journal of Fish Biology 11, 257–266. Krebs, C. J. (1989). Ecological Methodology. New York: Harper Collins. Kühl, H. & Kuipers, B. R. (1979). Qualitative food relationships of Wadden Sea fishes. In Fish and Fisheries of the Wadden Sea (Dankers, N., Wolff, W. J. & Zijlstra, J. J., eds), pp. 112–123. Rotterdam: A. A. Balkema. Ludwig, J. A. & Reynolds, J. F. (1988). Statistical Ecology. A Primer on Methods and Computing. New York: John Wiley. Marshall, S. (1995). The structure and functioning of the fish assemblage of the Humber Estuary, U.K. Unpublished Ph.D. thesis, University of Hull. Mohan, M. V. & Sankaran, T. M. (1988). Two new indices for stomach content analysis of fishes. Journal of Fish Biology 33, 289–292. Mol, J. H. (1995). Ontogenetic diet shifts and diet overlap among 3 closely related neotropical armoured catfishes. Journal of Fish Biology 47, 788–807. Rice, J. C. (1988). Repeated cluster analysis of stomach contents data: method and application to diet of cod in NAFO division 3L. Environmental Biology of Fishes 21, 263–277. Sheldon, A. L. & Meffe, G. K. (1993). Multivariate analysis of feeding relationships of fishes in blackwater streams. Environmental Biology of Fishes 37, 161–171. Smith, E. P. & Zaret, T. M. (1982). Bias in estimating niche overlap. Ecology 63, 1248–1253. Southwood, T. R. E. (1966). Ecological Methods: with Particular Reference to the Study of Insect Populations. London: Chapman & Hall. ter Braak, C. J. F. (1987). Chapter 5, Ordination. In Data Analysis in Community and Landscape Ecology (Jongman, R. H. G., ter Braak, C. J. F. & van Tongeren, O. F. R., eds), pp. 91–173. Wageningen, Pudoc. Tokeshi, M. (1991). Graphical analysis of predator feeding strategy and prey importance. Freshwater Forum 1, 179–183. Washington, H. G. (1984). Diversity, Biotic and Similarity Indices: A review with special relevance to aquatic ecosystems. Water Research 18, 653–694. Zar, J. H. (1984). Biostatistical Analysis, 2nd edn. New Jersey: Prentice Hall.