LATEST TRENDS on COMPUTERS (Volume I)
A Concurrent Neural Module Classifier for Automated Target Recognition in SAR Imagery VICTOR-EMIL NEAGOE, DANIEL-CRIS CARAUSU, AND GABRIEL-EDUARD STRUGARU Depart. Electronics, Telecommunications & Information Technology Polytechnic University of Bucharest Splaiul Independentei No. 313, Sector 6, Bucharest ROMANIA E-mail:
[email protected] Abstract: - The paper presents an original approach for automated target recognition (ATR) in the synthetic aperture radar (SAR) imagery using the neural network classifier called Concurrent Self-Organizing Maps (CSOM), previously introduced by first author of the present paper. The ATR algorithm has the following stages: (a) image preprocessing (median filtering, histogram equalization, binarization); (b) feature selection using Gabor Filtering (GF); (c) neural classification with CSOM, representing a winner-takes-all collection of neural network modules. The algorithm has been applied for the recognition of three classes of military ground vehicles represented by the set of 2759 images of the MSTAR public release database. The experimental results obtained using CSOM has led to the best total success rate of 95.31%. Key-Words: - automated target recognition (ATR), SAR Imagery, Concurrent Self-Organizing Maps (CSOM), Gabor Filters, MSTAR database according to its ability to generalize. The investigation of sample size problem for neural network classifiers leads the conclusion that the generalization error decreases as the training sample size increases. However, in contrast to statistical pattern recognition, neural networks have a good behavior regarding small size problem and they also are faster than statistical classifiers. An approach to the application of the Multi Layer Perceptron (MLP) for ATR of military vehicles of the MSTAR database is reported by Sandirasegaram [9]. A similar ATR approach based on Radial Basis function (RBF) neural network has been performed by Sun et al [10]. Self-Organizing Map (SOM) (also called Kohonen network) [3] is an artificial unsupervised neural network characterized by the fact that the neurons become specifically tuned to various classes of patterns through a competitive, unsupervised or self-organizing learning. The spatial location of a neuron in the network (given by its co-ordinates) corresponds to a particular input vector pattern. Similar input vectors correspond to the same neuron or to neighbor neurons. Starting from the idea to consider the SOM as a cell characterizing a specific class only, Neagoe et al proposed [5] and evaluated for satellite imagery [6], [7] a new neural recognition supervised model called Concurrent Self-Organizing Maps (CSOM), representing a collection of small SOM modules, which use a global winner-takes-all strategy. Each SOM is trained to correctly classify the patterns of one class only and the number of neural network modules equals the number of classes. For feature selection, we have considered the
1 Introduction Defence forces rely upon a variety of sensor information to locate and track oppositional forces; the surveillance problem becomes particularly difficult over large land areas with sparse population centres and over the great expanse of the seas. The modern war fighter is dependent upon several types of image data to aid in the surveillance task including optical data, infrared data, and radar data. Radar imagery enjoys the advantage of independence from a passive illumination source, such as sunlight or starlight, thus offers imaging capability at night and through clouds. Modern day radar imaging systems are capable of comparatively high resolution by utilising synthetic aperture radar (SAR) imagery. The area of Automatic Target Recognition (ATR) for SAR imagery is an ongoing research in many branches of the military and large research institutions. The U.S.A. Defence Advanced Research Agency (DARPA) has made part of the Moving and Stationary Target Acquisition and Recognition (MSTAR) data set available to the public. We shall further present an ATR algorithm with applications for the recognition of three categories of military ground vehicles of the former Soviet Union with 0 to 360 degrees azimuthal angle and depression angle of 15 to 17 degrees. There has been increasing interest in using artificial neural networks (ANN) for pattern recognition [1]. Neural networks have been successfully applied to classification problems in the areas of industry, business, science and defense. A classifier is considered to be good or not
ISSN: 1792-4251
208
ISBN: 978-960-474-201-1
LATEST TRENDS on COMPUTERS (Volume I)
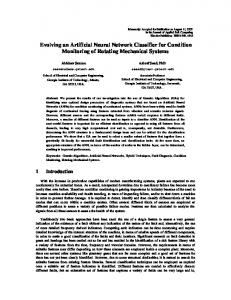
Gabor wavelet filters [2], [4], [8]. The CSOM model proved to have better performances than the other statistical and neural classifiers considered in our experiments, both for the recognition rate and also for reduction of the training time. The proposed ATR algorithm applied for several military vehicle categories of the MSTAR database has the following processing stages (Fig. 1):
a. Image preprocessing a1. Median filtering a2. Histogram equalization a3. Binarization b. Feature selection using Gabor Wavelet Filtering (GWF) c. Neural classification using Concurrent SelfOrganizing Maps (CSOM)
Fig. 1. Flowchart of the ATR cascade.
By denoting γ = f / α and η = f/ β, one obtains a normalized response
2 Feature Selection Using Gabor Filters (GF) The feature selection is based on the two-dimensional Gabor filters (2D GF). A distinct advantage of the Gabor functions is their optimality in the space–spatial-frequency planes, providing the smallest possible pieces of information about time-frequency events (Gabor, 1946). In the spatial domain, a 2D GWF is defined as a complex sinusoidal plane wave function modulated by a Gaussian 2 '2
rξ ( x, y ) =
2 '2
⎛ ( u cosθ + v sin θ − f ) 2 ( u sin θ − v cos θ ) 2 −π 2 ⎜⎜ + ⎜ α2 β2 ⎝
⎞ ⎟ ⎟ ⎠
,
(4)
where f is the central frequency of the sinusoidal plane wave, θ is the anti-clockwise rotation of the Gaussian and the plane wave, and α and β are the sharpness values of the major and minor axes of the elliptic Gaussian. The response of the above 2D Gabor filter for an image ξ(x,y) can be calculated via the convolution respξ ( x, y ) = ψ ( x, y) ∗ ξ ( x, y) . (5)
ISSN: 1792-4251
2
πγη
ψ ( x, y ) ∗ ξ ( x, y ) .
(6)
The response of the Gabor filter is a low level Gabor feature. In a feature space constructed from the Gabor filter responses, invariant search operations can be established based on the rotation, scale, and translation invariance properties of the Gabor features [4]. Furthermore, the Gabor feature space provides robustness to noise and illumination changes. One uses features at a single location (x; y), and thus, by combining the responses of several filters in different orientations and frequencies, complex objects can be represented. Sampling filter parameters A filter bank, consisting of several filters, needs to be used, as the relationships between responses of filters provide the basis for distinguishing objects. Next, it is considered how the filter parameters should be chosen for the bank of filters. The selection of discrete rotation angles θk has been chosen so that orientations to be spaced uniformly in the interval [0, π), that is,
ψ ( x, y ) = e −(α x + β y ) e j 2πfx ' , (1) (2) x' = x cos θ + y sin θ , (3) y ' = − x sin θ + y cosθ , while the 2D GF is represented in the frequency domain by a Gaussian centered at the point (fcosθ, fsinθ)
π e ψ (u , v) = αβ
f
θk =
209
kπ , k = {0,..., N − 1} , N
(7)
ISBN: 978-960-474-201-1
LATEST TRENDS on COMPUTERS (Volume I)
where θk is the kth orientation and N is the number of orientations to be used. We have considered the following values for N: 3, 6, 9, 12, 15 and 18. For example, for N = 3, the corresponding discrete π 2π orientations are: 0, , . 3 3 In the selection of discrete frequencies fk, the following exponential sampling is used [4] that is, (8) f k = a − k f max , k = {0,..., M − 1}, th where fk is the k frequency, f = fmax is the highest desired frequency, and a is the frequency scaling factor (a > 1). Useful values for a include a = 2 for octave spacing and a = 2 for half-octave spacing; M is the number of considered scales. By choosing a =
2 , fmax =
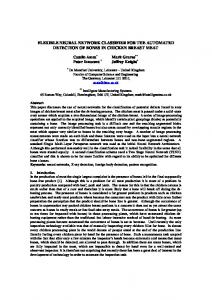
(c) f = 1 / 8 2 , θ = 0, γ = 1, η = 0.5.
1 cycles/pixel (Nyquist 2
frequency) and the number of scales M = 11, one obtains the following set of central frequencies: 1 1 1 1 1 1 1 1 1 1 1 , , , , , , , , , , . (9) 2 2 2 4 4 2 8 8 2 16 16 2 32 32 2 64 To provide a smooth behavior of the features, the sharpness parameters γ and η have been adjusted to obtain a sufficient overlap of the Gabor filters in the feature space. For a good performance in the experiments of military vehicles recognition, one has chosen γ = 1 and η = 0.5. In Fig. 2 there are shown the responses of several 2D Gabor filters for an input binarized image.
(d) f = 1 / 64, θ = π / 3, γ = 1, η = 0.5.
(e) f = 1 / 64, θ = 2π / 3, γ = 1, η = 0.5.
(a)
(f) f = 1 / 64, θ = 2π / 3, γ = 1, η = 0.5. Fig. 2. (a) Binary input image. (b)-(f) Responses of the corresponding 2D Gabor filters, whose parameters are specified for each case.
(b) f = 1 / 2, θ = 0, γ = 1, η = 0.5.
ISSN: 1792-4251
210
ISBN: 978-960-474-201-1
LATEST TRENDS on COMPUTERS (Volume I)
For the M frequencies of interest and the N orientations of the desired angular discrimination, one can construct a set of M x N 2D Gabor filters. For each filter of indices {(i,j) 0 ≤i≤ M-1; 0 ≤ j≤N-1}, one computes the filter response G = resp( x, y; f i , θ j ) }, 0 ≤ x,y ≤ P-1. Then,
one computes the following three statistical parameters: mean, variance and skewness (measure of the asymmetry of the data around the sample mean) of response magnitudes for the square central zone of P x P pixels. Hence, we have a vector of 3 MN features, which is led to the classification processing stage.
3 Neural classifier with concurrent selforganizing modules
Fig. 3. The training phase of the CSOM model.
Concurrent Self-Organizing Maps (CSOM) [5] is a collection of small SOM modules, which use a global winner-takes-all strategy. Each module is trained to correctly classify the patterns of one class only and the number of networks equals the number “M” of classes. The CSOM training technique is a supervised one, but for any individual net the SOM specific unsupervised training algorithm is used. We built “M” training patterns sets and we used the SOM training algorithm independently for each of the “M” neural units. Namely, each SOM module is trained with the patterns characterized by the corresponding class label. The CSOM models for training and classification are shown in Figs. 3 and 4.
3.1 Training (k=1,…,M)
of
each
SOM(k)
3.2 Recognition Phase For the recognition, the test pattern has been applied in parallel to every previously trained SOM module. The neural module providing the minimum distance neuron is decided to be the winner and its index becomes the class index that the pattern belongs to (see Fig. 4). In fact, CSOM is a system of systems having improved performances over a single big SOM with the same number of neurons, both from the point of view of recognition accuracy and for reducing the training time as well [5], [6], [7].
module
Assume that the module SOM(k) has J(k) neurons; particularly, one can choose
J (1) = ... = J ( M ) =
J M
(10)
where J is the number of CSOM neurons and M is the number of classes. For each SOM(k) module, a specific training data subset is prepared containing all the training vectors having the label “k”, as shown in Fig.3. Assume also that the number of vectors having the class label “k” is N(k), so that M
∑N
(k )
=N
Fig. 4. The classification phase of the CSOM model.
(11)
k =1
where N is the total number of training vectors. Usually, J(k) >> N(k), to use the interpolation capacity of CSOM.
ISSN: 1792-4251
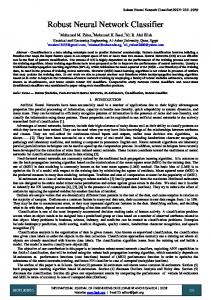
3.3 Example Consider the two class 2D dataset “Palm” shown in Fig. 5; the training set contains 36 vectors (18 vectors for each class); the test set has the same number of vectors as the training lot. We have tested a CSOM with M=2 modules having a circular architecture using the above dataset “Palm”: N(1) = N(2) = 18 training vectors/class.
211
ISBN: 978-960-474-201-1
LATEST TRENDS on COMPUTERS (Volume I)
One considers 1394 images corresponding to the depression angle of 170 for training, while the other 1365 pictures corresponding to the depression angle of 150 are considered for test.
1 0.9 0.8 0.7
Table 2. Number of pictures for each of the military vehicle class and version in the considered MSTAR dataset. class BMP2 BTR70 T72 version 9563 9566 c21 c71 132 812 s7 15° 195 196 196 196 196 195 191 17° 233 232 233 233 232 231 -
0.6 0.5 0.4 0.3 0.2 0.1
4.2 Recognition performances We have considered the following classifiers for the considered application of ATR of the selected MSTAR pictures: a. Neural classifiers : Concurrent Self-Organizing Maps (CSOM) and Radial Basis Function (RBF) neural network. b. Statistical classifiers : Nearest Neighbor (NN) and K-Means. For CSOM classifier, we have considered two categories of experiments. The model CSOM I uses three SOM modules; each module is trained with the MSTAR images (taken under 170 depression angles) of the corresponding class of military vehicles having one of the three labels: BMP2, BTR70, and T72. The model CSOM II contains six neural modules; each SOM module is trained with the images corresponding to the corresponding version of vehicles (see Table 1): 9563, 9566, c21, c71, 132, and 812. However, the decision is given according to the group (class) level whose the vehicle version of the module belongs. For example, a winner neuron of any of the modules 9563, 9566, and c21 implies the decision corresponding to the class BMP2. We further present the results of our experiments by considering the following parameters: – number of scales: M=11; – number of orientations N=15. Consequently, we obtained a number of MN= 165 Gabor filters as well as a number of 3MN=495 statistical Gabor features for each image.
0 0
0.1
0.2
0.3
0.4
0.5
0.6
0.7
0.8
0.9
1
Fig. 5. A two-class data subset “Palm”; = training vector of the = test vector of the first class, = training vector first class; of the second class; = test vector of the second class.
We further present a comparison of several classifiers for PALM database: Concurrent Self-Organizing Maps (CSOM) with linear and circular architecture, Multilayer Perceptron (MLP), Radial Basis Function (RBF) neural network, Support Vector Machine (SVM), nearest neighbor (NN), and K-Means. Table 1. Recognition score (%) for several classifiers (PALM dataset). Number of neurons 10 20 30 40 50 60 70 80 90 100 per module CSOM with 66.67 80.56 80.5675.00 77.78 83.33 80.56 72.2280.56 80.56 linear modules CSOM with 61.11 80.56 91.6786.11 88.89 91.67 75.00 80.5672.22 80.56 circular modules MLP (20 neurons 75.00 on the hidden layer) RBF 77.78 (σ ∈ [0,076,1]) SVM (linear) 58.33 NN 66.67 K-Means 55.56
4 Experimental Results
Table 3. Recognition score (%) for 1D CSOM I architectures (MSTAR database).
4.1 MSTAR database The MSTAR (moving and stationary target recognition) data is a standard dataset for automatic target recognition (ATR) tasks, using Synthetic Aperture Radar (SAR) imagery Three types of military ground vehicles of the former Soviet Union which are BMP2 (tank), BTR70 (armored car), and T72 (tank) in MSTAR database are used for our experiments. We have considered 2759 images of 128 x 128 pixels, using two depression angles: 150 and 170. The number of images for each category is shown in Table 2.
ISSN: 1792-4251
Number of neurons per 10 20 30 40 50 60 70 80 90 100 module Total number 30 60 90 120 150 180 210 240 270 300 of neurons CSOM I with 82.05 83.44 84.25 83.30 71.94 69.82 69.82 72.01 69.60 73.19 3 linear modules CSOM I with 78.83 80.73 80.81 79.49 73.19 73.92 76.12 74.43 73.11 75.31 3 circular modules
212
ISBN: 978-960-474-201-1
LATEST TRENDS on COMPUTERS (Volume I)
Table 4. Recognition score (%) for 2D CSOM I architectures (MSTAR database). Number of neurons per module Total number of CSOM neurons CSOM I with 3 square modules CSOM I with 3 cylindrical modules CSOM I with 3 toroidal modules
3. The best recognition score of 95.31 % is obtained using a CSOM with 6 cylindrical SOM modules of 40x40 neurons each. By comparison, the RBF neural network leads to the recognition score of 93.19 %, the NN method obtains a score of 92.23 %, and the K-means leads to the score of 54.87 %.
10x10 20x20 30x30 40x40 50x50 60x60 70x70 300
1200 2700 4800 7500 10800 14700
82.93 93.26 93.48 93.70 93.63 93.63 93.26 90.11 93.55 93.92 94.65 94.29 94.14 93.77
References: [1] C. Bishop, Pattern Recognition and Machine Learning, Springer, 2006. [2] J.K. Kamarainen, V. Kyrki, H. Kälviäinen, “Robustness of Gabor Feature Parameter Selection”, Proc. IAPR Conference on Machine Vision Applications (IAPR MVA 2002), December 2002, pp. 132–135. [3] T. Kohonen, Self-Organizing Maps, Springer-Verlag, 1995. [4] V. Kyrki, J.K. Kamarainen, H. Kälviäinen, “Simple Gabor feature space for invariant object recognition”, Pattern Recognition Letters, February 2004, vol. 25, issue 3, pp. 311–318. [5] V. Neagoe and A. Ropot, ”Concurrent SelfOrganizing Maps for Pattern Classification”, Proc. of First IEEE International Conference on Cognitive Informatics, ICCI 2002, 19-20 August 2002, Calgary, Alberta, Canada, ISBN 0-7695-1726-9, pp. 304-312. [6] V. Neagoe and G. Strugaru, "A concurrent neural network model for pattern recognition in multispectral satellite imagery", Proc. of the World Automation Congress, 2008 (WAC 2008), International Symposium on Soft Computing in Industry (ISSCI'08), Sept. 28–Oct. 2, 2008, Hawaii, USA, ISBN:978-1889335-38-4, IEEE Catalog No. 08EX2476. [7] V. Neagoe and A. Ropot, "A New Neural Approach for Pattern Recognition in Space Imagery", in Harbour Protection Through Data Fusion Technologies, NATO Science for Peace and Security Series-C: Environmental Security, Springer, 2009, pp. 283-289. [8] H. Ruohong, Y. Ruliang, “SAR Target Recognition Based on MRF and Gabor Wavelet Feature Extraction”, IEEE International Geoscience and Remote Sensing Symposium (IGARSS 2008), July 2008, vol. 2, pp. II-907–II-910. [9] N. M. Sandirasegaram, “Automatic Target Recognition in SAR Imagery using a MLP Neural Network”, Technical Memorandum, Defence Research and Development Canada (DRDC), Ottawa, TM 2002120, November 2002. [10] Y. Sun, Z. Liu, S. Todorovic, J. Li, “Adaptive boosting for SAR automatic target recognition”, IEEE Transactions on Aerospace and Electronic Systems, January 2007, vol. 43, issue 1, pp. 112–125.
83.88 92.31 94.07 94.58 94.07 94.36 94.43
Table 5. Recognition score (%) for 1D CSOM II architectures (MSTAR database).
Table 6. Recognition score (%) for 2D CSOM II architectures (MSTAR database). Number of neurons per module Total number of CSOM neurons CSOM II with 6 square modules CSOM II with 6 cylindrical modules CSOM II with 6 toroidal modules
10x10 20x20 30x30 40x40 50x50 60x60 70x70 600
2400 5400 9600 15000 21600 29400
91.28 94.14 94.58 94.80 94.80 94.58 94.95 92.16 94.58 95.09 95.31 95.02 94.14 94.87 91.21 93.63 94.80 94.43 94.95 94.73 94.43
Table 7. Best recognition scores (%) of the experimented classifiers (MSTAR database). Type of classifier Recognition score (%)
2D CSOM II (6 Radial Basis Function cylindrical SOM (RBF) net modules of 40x40 (σ = 1.10) neurons each) 95.31
93.19
Nearest Kneighbor Means (NN) 92.23
54.87
5 Concluding Remarks 1.
The paper proposes an ATR algorithm based on the
neural network classifier of the Concurrent SelfOrganizing Maps (CSOM). 2. We have experimented the presented algorithm for a set of 2759 SAR images of 128 x 128 pixels belonging to the MSTAR database corresponding to three military vehicle classes: BMP2 (infantry fighting vehicle), BTR70 (armored car), and T72 (tank). The implemented neural CSOM classifier is evaluated for various architectures and sizes of the SOM modules. Namely, we have taken into account both the 1D architecture (linear and circular) and also the 2D one (square, cylindrical, and toroidal).
ISSN: 1792-4251
213
ISBN: 978-960-474-201-1