[12] K. D. Rolt and H. Schmidt, âAzimuthal ambiguities in synthetic aperture sonar and synthetic aperture radar imagery,â IEEE J. Oceanic Eng., vol. 17, pp. 73â79 ...
270
IEEE TRANSACTIONS ON IMAGE PROCESSING, VOL. 8, NO. 2, FEBRUARY 1999
A Confidence-Based Approach to Enhancing Underwater Acoustic Image Formation Vittorio Murino, Member, IEEE, and Andrea Trucco, Student Member, IEEE Abstract—This paper describes a flexible technique to enhance the formation of short-range acoustic images so as to improve image quality and facilitate the tasks of subsequent postprocessing methods. The proposed methodology operates as an ideal interface between the signals formed by a focused beamforming technique (i.e., the beam signals) and the related image, whether a two-dimensional (2-D) or three-dimensional (3-D) one. To this end, a reliability measure has been introduced, called confidence, which allows one to perform a rapid examination of the beam signals and is aimed at accurately detecting echoes backscattered from a scene. The confidence-based approach exploits the physics of the process of image formation and generic a priori knowledge of a scene to synthesize model-based signals to be compared with actual backscattered echoes, giving, at the same time, a measure of the reliability of their similarity. The objectives that can be attained by this method can be summarized in a reduction in artifacts due to the lowering of the side-lobe level, a better lateral resolution, a greater accuracy in range determination, a direct estimation of the reliability of the information acquired, thus leading to a higher image quality and hence a better scene understanding. Tests on both simulated and actual data (concerning both 2-D and 3-D images) show the higher efficiency of the proposed confidence-based approach, as compared with more traditional techniques. Index Terms— Acoustic imaging, image enhancement, image generation, underwater acoustics.
I. INTRODUCTION
T
YPICALLY, underwater acoustic imaging systems aim at the investigation of underwater scenes whenever operational conditions do not allow the observation of such scenes by using optical systems. Unfortunately, acoustic images are affected by a low quality, due to a set of problems that make it difficult to understand an observed scenario. Nevertheless, acoustic systems are useful in visualizing submerged objects (whether natural or artificial) and in generating precise seabed maps [1], [2]. Generally, the beamforming (BF) technique [3] is utilized for the formation of acoustic images, both two-dimensional (2D) and three-dimensional (3-D) ones [1]–[6]. For 2-D imaging, a linear array is sufficient and the resulting image represents a section of a scene, visualized in a direction-distance format (typical of sonar systems [1]; see Fig. 1). For 3-D imaging, a 2-D array is required and the obtained image is similar Manuscript received May 3, 1996; revised April 2, 1997. The associate editor coordinating the review of this manuscript and approving it for publication was Prof. Hua Lee. V. Murino is with the Dipartimento Scientifico e Tecnologico, University of Verona, I-37134 Verona, Italy. A. Trucco is with the Department of Biophysical and Electronic Engineering, University of Genoa, I-16145 Genoa, Italy. Publisher Item Identifier S 1057-7149(99)00927-6.
Fig. 1. Example of 2-D imaging using a beam-signal envelope.
to a conventional (orthoscopic) optical image with additional precise information about the scene distance, i.e., a range image. A 3-D map representation is also used to visualize this kind of data [2] (see Fig. 2). In 2-D imaging, successive reflections, generated by different scene layers or by different objects located in the same direction, are indispensable to visualize the external surface and the internal structure of a scene [7]–[9]. By contrast, to obtain an understandable 3-D image, typically, only the external surface of a scene (i.e., the profile visible with an optical system) should be considered, neglecting its internal structure [2]. Besides underwater applications, 2-D and 3-D acoustical imagings are used in medical applications and nondestructive testing (NDT); moreover, microwave imaging presents many analogies to acoustical imaging. These applications deal with objects like off-shore petrol structures, shipwrecks, and archaeological objects in underwater imaging, body organs and possible internal lesions in medical imaging, material defects in NDT, and military or civilian targets (e.g., ships, tanks, or aircraft, with their sizes, shapes, and orientations) in microwave imaging. Also in these cases, object detection and recognition are performed by expert operators who try to understand a scenario on the basis of a priori knowledge (related to the sensor and to the scene considered) and experience.
1057–7149/99$10.00 1999 IEEE
MURINO AND TRUCCO: ENHANCING UNDERWATER ACOUSTIC IMAGE FORMATION
Fig. 2. Example of 3-D imaging starting from the absolute maximum amplitude of a beam signal.
In this paper, we consider acoustic imaging processes utilizing the BF technique for image formation. In short, BF deals with the processing of signals acquired by an array of sensors aimed at enhancing signals coming from a fixed steering direction and attenuating, as much as possible, signals coming from other directions. Therefore, the output signal of a BF process is a function of time, called beam signal. In our case, BF is used for imaging purposes and the general procedure adopted for the imaging process lies in insonifying a scene by means of one or more suitable acoustic pulses, in acquiring the backscattered echoes by using an array of sensors, in applying beamforming to the acquired signals, and, finally, in extracting from the beam signals the information necessary for the formation of an image [1]–[5], [7], [10]–[17]. More specifically, after calculating the beam signal in a fixed direction, it is possible to determine the information about the scene (e.g., the distance) in the steering direction, thanks to the spatial selectivity of BF. By repeating this operation for various directions, one can obtain the image of the region of interest. Unfortunately, acoustic images are affected by severe problems that make it difficult, as compared with optical images, to extract useful information about an observed scenario as well as to understand it. The poor directivity of the used antennas (i.e., main lobe width) produces images with rough resolution, and the nonideal rejection of the signals coming from directions different from the steering one (i.e., presence of side lobes) generates artifacts and a strong blurring effects. Finally, speckle noise (generated by the coherent interference of the backscattered signals) affects such images, giving rise to an inhomogeneous object representation. For these reasons, several postprocessing techniques [2], [18]–[21] are used to restore and enhance computed images, so improving scene understanding. All the above-mentioned applications require that these techniques should be computationally economical
271
in order to satisfy real-time needs. This can be achieved either by using special hardware devices or, more often, by devising simple methods for image improvement (like threshold-based methods). However, due to either the use of high-cost hardware or the simple on-line methods available for image improvement, the overall cost of accomplishing an effective and useful processing of an image is considerably high. In this paper, we present a new approach to enhancing the formation of acoustic images by improving the information extraction from beam-signal envelopes leading to high-quality (2-D or 3-D) acoustic images. The method proposed and the related results refer to short-range underwater imaging, but the approach can be straightforwardly generalized to other applications (e.g., medical imaging). More precisely, our approach is based on a local comparison between the beam signal envelopes actually obtained and the expected ones, suitably defined on the basis of both the physics of the image formation process and the a priori modeling of a scene. To this end, a reliability measure, called confidence, has been introduced that allows a rapid examination of beam signals, aimed at accurately detecting possible target echoes backscattered from a scene, while disregarding useless information. The confidence measure can be considered as an ideal interface between beam signals and the related image; it operates directly (on line) on the image-formation process, with only a slight increase in the computational load. The confidence-based approach yields better results than other similar methods used in this field. In particular, we describe how the most widely used technique for echo detection (i.e., the matched filter) can be re-enforced by the subsequent use of the confidence-based method. As a result, images of improved quality can be obtained. The objectives that can be attained by the proposed approach are as follows: 1) reduction in artifacts due to the lowering of the side-lobe level; 2) better lateral resolution; 3) precise distance determination; 4) accurate detection (for each beam signal) of target echoes, associated with an estimation of the reliability of the information extracted, and, consequently, 5) a higher image quality that allows a better image recognition and a better understanding. These results are obtained by the application of a physical model-based approach operating on line on the set of beam signals. The enhancement carried out by this method can be considered as a fast restoration method to be applied at an early stage to one-dimensional (1-D) signals to directly generate improved 2-D and 3-D images, instead of performing demanding postprocessing algorithms. In our opinion, these results and the formulation of the method itself constitute the main original points of this paper. This paper is organized as follows. In Section II, we outline the characteristics of the most widely used methods for extracting information from beam signals. Section III describes the proposed method, its theoretical principles and practical fea-
272
IEEE TRANSACTIONS ON IMAGE PROCESSING, VOL. 8, NO. 2, FEBRUARY 1999
tures. Its performances were quantitatively assessed by means of the beam power pattern computation and a comparative analysis was also made. In Section IV, the results (on 2-D and 3-D images) obtained by using both real and synthetic data are reported. A further comparison is made with the results yielded by a postprocessing restoration algorithm. Finally, conclusions are drawn in Section V.
those coming from other directions are attenuated, as one can deduce by substituting (1) into (2)
II. IMAGE FORMATION AND RELIABILITY EVALUATION
In general, after fixing the steering direction, the beam pattern is a function that yields the attenuation with which the beamforming system transfers a plane wave to the beam signal, for each possible incidence angle [3]. When the received echoes are not continuous waves but pulses, the beam pattern depends on the envelope shape and duration. In this condition, the beam pattern can be defined as the maximum of the beam signal over time [25], [26]:
In this section, we analyze first the methods based on the beamforming algorithm for the generation of 2-D and 3-D images, then some techniques to evaluate the reliability of the information contained in them. The methods considered are the most widely used by acoustic imaging systems and meet simplicity and speed requirements. Other problems (e.g., time delay estimation, source localization, etc.) can be solved by more complex and more computationally onerous methods that are difficult to apply to 2-D and 3-D imaging. In order to make a comprehensive comparison, we consider methods for underwater acoustic imaging [1], [2], [10]–[14], [22], [23], for medical acoustic imaging [4]–[6], [15], for nondestructive acoustic testing (NDT) [15]–[17], and for microwave imaging [8]. A. Beamforming and Visualization Beamforming (BF) is a technique widely used in signal processing: its goal is to estimate signals coming from a fixed direction (steering direction), while attenuating those coming from other directions [3]. In essence, it is a spatial filter that linearly combines the temporal signals spatially sampled by a discrete antenna, i.e., an array of sensors located according to punctiform a known geometry. One considers an array of and omnidirectional sensors constituting the receiving device, and assumes that an acoustic pulse composed of plane waves impinge on the array. (The far-field hypothesis is not a strict requirement, as, under near-field conditions, one can take into account the wave curvature by applying a focused BF [3], the position of the th sensor, by [24].) Denoting by the versor normal to the wave front and directed toward the wave source, by the sound velocity, and by the angular received by the th sensor can frequency, the signal be expressed (after a base-band demodulation that yields a complex output signal [3]) as (1) is the temporal envelope of the acoustic pulse. where According to the definition of quadrature beamforming [3], being a versor), a beam signal steered in the direction is defined as (2) is the number of sensors, where to each sensor, and backscattered echoes coming from
are the weights assigned The net result is that are emphasized, whereas
(3)
(4) or on the basis of the total energy of the beam signal [25], [26]: (5) As suggested in [4] and [26] for imaging applications, the definition of the beam pattern presented in (4) is more suitable than that presented in (5); therefore, in this paper, the beam pattern will be defined as the maximum of the beam signal over time. The beam pattern of an imaging system is very important, as it allows (like the point spread function) an objective evaluation of the system performances. A conventional beam pattern presents a main lobe in the direction in which the array is steered and side lobes of minor, but not negligible, magnitudes in other directions. The width of the main lobe corresponds to the lateral resolution of the imaging system, whereas the generation of artifacts degrading useful information depends on the level of the side lobes. The sidelobe level can be reduced by suitably fixing the values of the but, unfortunately, this operation increases the coefficients width of the main lobe, thus worsening the lateral resolution of the system. Images are generated by collecting the beam signals steered in each direction of interest (according to the lateral resolution of the system) and by displaying the information contained in them. Obviously, the acoustic field backscattered by a real scene is not a plane wave but the wave front is a corrugated surface. Therefore, the signal received by the th sensor, cannot be related to a precise direction of arrival any more. Nevertheless, the beam signal steered in the direction, can always be computed by using (2). Twodimensional images can be formed by linear arrays, whereas 2-D arrays allow the formation of acoustical 3-D images. In 2-D images, each beam signal contributes to forming a whole image line; consequently, the most widely used imaging method is the direct one: it consists in converting a whole beam-signal envelope into the pixels forming an image line (see Fig. 1). A color or a gray level proportional to the amplitude of the beam-signal envelope at a fixed instant is assigned to the related pixels [1], [4], [5], [7], [11]–[14], [16],
MURINO AND TRUCCO: ENHANCING UNDERWATER ACOUSTIC IMAGE FORMATION
[17], [23], [27]. By using suitable palettes—look-up tables (LUT’s)—one can achieve results that are sufficiently understandable. In order to obtain beam signals for which the echo amplitudes do not depend on time positions, received signals are amplified with a gain that increases over time—timevarying gain (TVG)—and is able to compensate for the loss due to the propagation spreading and the medium attenuation [17], [22], [28]. To improve image quality, some authors deem it convenient to visualize the power of a beam signal envelope, rather than its amplitude. This is accomplished on a linear scale [10] or on a logarithmic scale [8], [12]. An interesting comparison of various visualization methods is made in [20]. The aforesaid methods build an image by starting directly from a beam-signal envelope, possibly amplified with a TVG. A more advanced method, well-suited for low signal-to-noise ratio (SNR) conditions (as frequently occurring in underwater acoustic imaging) consists in applying a matched filter to the beamformer output [14], [22], adopting as an impulse response the pulse used to insonify the scene. Then, an envelope detector is applied, and the resulting signal (i.e., a local energy) is utilized to create an image line. Visualization can be performed on a linear scale [22] or on a logarithmic scale [14]. This method aims at determining the temporal positions of echoes (thus limiting the effect of noise) and at creating energy peaks corresponding to such positions. In the case of a pulse in white Gaussian noise, the matched-filter receiver has proved to be the optimal filter in terms of SNR maximization. Moreover, if the insonification pulse has a timebandwidth product greater than unity, the coherent gain of the matched filter increases, thus ensuring better performances in very noisy conditions. In acoustic 3-D imaging, one must extract from each beam signal the distance related to the first reflection. A tern can be calculated in accordance with this distance and with the steering direction: it represents a point in a 3-D map (see Fig. 2). An analysis of each beam signal is required. In most cases, the selected distance to be represented in an image is the one related to the temporal instant at which the beam signal envelope (possibly, after the matched filtering) reaches an absolute maximum amplitude [2], [4], [13]. As mentioned earlier, to represent the absolute maximum amplitude [2], [13] or a logarithmic measure of the power of such a maximum value [4], colors or gray levels can be used. Of course, this simple procedure does not ensure that the absolute maximum amplitude will be related to the reflection of an object (if any) in the steering direction [2]. The probability of detecting a spurious reflection (due to side lobes) instead of the reflection of an object in the steering direction is not negligible. In conventional 2-D and 3-D imaging systems, the adopted insonification pulse is often an amplitude-modulated carrier of constant frequency. In the case of a rectangular pulse that lasts it is easy to understand that, without for a time equal to the matched filter, the accuracy of the distance determination To decrease the error of the distance is equal to measure down to zero (in the ideal case), it is necessary to insert a matched filter before the envelope extraction. This improvement is obtained through a local integration performed by the matched filter along the beam signal.
273
One important problem related to methods based on the amplitude of the beam signal envelope is the sensitivity to the side lobes present in the beam pattern. The practical consequences of such sensitivity are degrading effects consisting in halos visible around the objects contained in an image [1], [7], [8], [15] where no physical obstacles are actually present (i.e., artifacts). The use of a suitable threshold can aid in attenuating such halos [2], [4], [8], [15], [16]. In 2-D imaging, the profile of a beam signal is represented in an image only at time instants when the envelope amplitude exceeds a suitable threshold. In 3-D imaging, each tern is represented on the 3-D map only if the absolute maximum amplitude of the related beam signal envelope exceeds a suitable threshold. When the value of the maximum amplitude does not exceed the threshold, one can assume the absence of obstacles in the steering direction considered. Unfortunately, it is very difficult to find a suitable value for the threshold, due to the differences in the amplitudes of the echoes generated by different objects, or by different parts of the same object differently located. Reflections, generated by the internal layers of a scene (in 2-D imaging), show marked differences in amplitude, too. Therefore, in order not to lose some details of the targets contained in a scene, one must fix a rather low threshold, resulting in an unsatisfactory reduction in halos. Vice versa, if one fixes a higher threshold, one obtains an acceptable reduction in halos but loses some useful information about the scene. B. Reliability Evaluation In many cases, to evaluate the reliability of the spatial information extracted from each beam signal, the SNR related to the envelope of the sampled beam signal, (possibly after a matched filtering), is considered [2]. Such a parameter is computed through the ratio between and the the square of the estimate of the mean value variance estimate, as follows:
(6)
SNR
(7)
is the total number of time samples where the constant The limitations of such a reliability contained in estimate lie in the too general significance of the SNR, which is an indicator of the overall quality of the imaging process but it does not take into account how specific information is extracted from beam signals. To improve reliability estimation, only in the case of 3-D images built by starting from the absolute maximum amplitude (7) of each beam signal (denoted by
274
IEEE TRANSACTIONS ON IMAGE PROCESSING, VOL. 8, NO. 2, FEBRUARY 1999
Fig. 3.
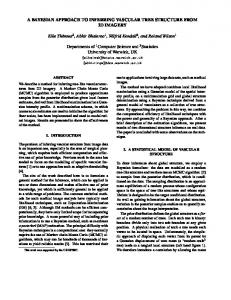
Examples of an emitted acoustic pulse and of some expected beam-signal envelopes, for different distances from a scene.
A. Estimation of Expected Beam Signals
has been modified [13] as follows:
SNR
(8)
is called the SNR of the The calculated parameter, SNR peak. This method aims to assign high reliability values to those beam signals whose absolute maximum amplitudes are quite above the mean value, and that show overall profiles with small variations around the mean value [2]. The limitations of this statistical method lie in its poor ability to discriminate between beam signals with very different real contents. For instance, if the envelope of a beam signal shows a peak at a given time instant and is flat at other instants (i.e., it consists of a sequence of samples that are all equal, except for the peak), the SNR value is not dependent on the peak value (as would be reasonable) but it is a function of the total number of time samples making up the signal, which results in an undesired characteristic. III. THE CONFIDENCE-BASED APPROACH A novel approach based on confidence measures has been developed that allows one to determine the correct distance of an obstacle (or of the various layers of a scene) by estimating the reliability with which, at every sampling instant, the beam signal examined can be compared with a possible (model-based computed) echo of the transmitted pulse. Unlike the methods described in the previous section, the proposed approach makes it possible to determine the distance and, at the same time, to estimate the reliability by a single mechanism. To carry out such operations, the developed confidence-based method requires the calculation of the mean square distance between the beam signal envelope at the beamformer output and an expected beam signal based on the modeling of the scene. The concept of an expected signal has recently been developed, even though for different purposes, in the medical and NDT fields [5], [16].
For given structures of the transmitter, of the scene, and of the receiving array, a beam signal is defined as the signal that a single sensor, placed in the coordinate origin, would receive if its reception pattern were identical with the beam pattern generated by the array. Therefore, due to the side lobes in the beam pattern, an a priori definition of the expected envelope requires the knowledge of the shape and of the structure of the whole scene. As such a knowledge is not available, it is necessary to resort to some approximations. A first suitable approximation is to assume the beam pattern to be rectangular in shape, flat at 0 dB in the area within the width of the main lobe (measured on the real beam pattern by using the points at 3 dB) and null outside this area. Therefore, the only scene portion that contributes to the beam signal is the small area within the width of the main lobe. As a result, it is not necessary any more to know the whole structure of the scene: thanks to this approximation, the scene portion not covered by the main lobe gives no contribution. The second approximation is to assume the material of the scene to be diffusive so that the expected pulse can be considered independent of the steering direction of the beam signal. For low steering angles, the width of the main lobe does not change very much, and backscattering is nearly independent of the incidence angle between the beam signal and the scene [14], [29], [30]. Under these conditions, the surface of a small area depends only on the distance between the array and the scene; consequently, the expected envelope depends only on this distance and the material in the small area. The latter approximation is not too restrictive as, typically, the wavelengths used in short-range underwater imaging are short with respect to the roughness of recurrent objects (i.e., natural or encrusted man-made objects); therefore, a diffusive behavior is often a reasonable assumption. the sampled With reference to Fig. 3, let us denote by envelope of the acoustic pulse transmitted, and by the sampled envelope of the beam signal expected, where is the arrival time corresponding to the distance of the
MURINO AND TRUCCO: ENHANCING UNDERWATER ACOUSTIC IMAGE FORMATION
scene from the array. One can see that the amplitude of the expected envelope decreases and its deformation increases as the distance increases or, equivalently, as the arrival time increases. However, for not too different distances, the shape and the amplitude of the expected envelope vary only slightly, hence, for the sake of simplicity, we assume a constant shape and a varying amplitude. On the basis of all the above considerations, one can easily make a more or less refined collection of expected envelopes, according to the distance of a possible target, to the material the target is made of, and, if necessary, to the characteristics of the propagation medium. B. Direct Comparison (i.e., The first confidence measure proposed, named confidence level one), is used to make a direct comparison between the envelopes of two beam signals, i.e., the expected and the real one for each beam signal The comparison is made in terms of direction of interest the quadratic distance, as follows:
275
and scattering peculiarities. For instance, in 2-D imaging, the presence of successive reflections makes it difficult to forecast the amplitudes of the various echoes. The same problem is faced in 3-D imaging, too, when the material of a scene object is not known, or when scene objects have nonnegligible reflecting behaviors. As a consequence, a direct comparison turns out not to be flexible enough to meet some practical requirements. C. Indirect Comparison To overcome the problem of an inaccurate knowledge of expected amplitudes, the previous confidence level has been modified by separating the information about the envelope shape from that about the envelope amplitude. To this end, both the envelope of the expected beam signal and the envelope of the real signal must be split into the product of two terms: an amplitude coefficient and a shape function with a normalized amplitude. The adopted notation is the following:
(10) (9)
is the number of sampling instants containing the where assume all possible sampling expected envelope. If we let instants for a beam signal, we can evaluate, at each instant, the similarity between the envelopes of the real beam signal and those of the expected one. The amplitude and the shape of the expected beam signal may vary just as a function of The larger the value of the closer the similarity of the expected envelope to the envelope present at about the On the basis of the temporal profile of it instant is possible to build an acoustic image in a very advantageous way, as will be shown in the following. makes it possible to compare the energy In (9), related to the difference between the two beam signals with the energy of the real beam signal in order that the values assumed by the confidence level may not depend on the energy of the transmitted signal, nor on the distance of the scene from the array. In terms of energy, the confidence approximates a local SNR, where the signal is represented by the real envelope and noise is represented by the difference between the expected and real envelopes. The definition of an SNR measure that is not based on the statistical characteristics of the beam signal [as (7) and (8) are] is made possible by the use of the modelbased signal concept. Therefore, we can regard, instant by instant, the value of the confidence level as being equal to the SNR computed over a time window that is as long as the insonification pulse. The defined confidence measure requires the a priori knowledge (even though approximate) of the amplitude of the pulse that is expected to be present in a beam signal (expected envelope), possibly after the matched filtering operation. However, such a knowledge is not always characterized by a sufficient accuracy [8], mainly due to the effects of speckle
is the expected amplitude of the where reflected pulse, coming from a distance corresponding to the Analogously, the envelope of the real beam signal instant is normalized to the value assumed at the sampling instant :
(11) is the amplitude of the envelope of where the beam signal at the instant Therefore, the new confidence level, can be defined as
(12) and are two constants, real and positive, that where rule the degrees of importance that one would like to lend to the comparison between the envelope shapes and to the comparison between the envelope amplitudes. The former is a local comparison and the latter is a point-wise comparison; both are made through the square distance. The larger the the larger the decrease in the confidence level value of caused by the difference between the expected and real shapes. with regard to the amplitudes. The same holds true for and one can By suitably tuning the two constants, obtain an acceptable trade-off between amplitude and shape and can requirements. Strategies for the regulation of be devised according to the a priori knowledge of the scene (i.e., target objects) and of the medium properties.
276
IEEE TRANSACTIONS ON IMAGE PROCESSING, VOL. 8, NO. 2, FEBRUARY 1999
(a)
(b)
(c)
(d)
Fig. 4. Comparison of the beam power patterns of a wide-band imaging system composed of 64 sensors. They were computed (a) without using the confidence approach; by applying the CL2 confidence measure when the SNR of the expected envelope was: (b) 20 dB; (c) 10 dB; (d) 5 dB.
D. Performance Evaluation Performances of confidence levels are difficult to evaluate in an analytical way as they depend on the goodness of the simulation performed, i.e., on the similarity of the expected echoes to the received ones. To face this problem, performances can be assessed for different degrees of similarity by varying the SNR. In other words, starting from a perfect simulation (i.e., the expected echo is equal to the real echo), the expected echo is gradually degraded by lowering the SNR to emulate realistic situations. As mentioned in Section II, in underwater acoustics the beam pattern of an imaging system is recognized to be a reliable measure of performance. Consequently, in this subsection, the computation and the comparison of the beam patterns before and after applying the confidence-level will be presented for realistic working conditions. It was assumed that a plane wave incoming from the direction (with a frequency equal to 1 MHz, a duration equal to 30 s, and a Gaussian-shaped envelope) impinged -equispaced sensors. on a linear array composed of 64 As usual, the reasoning was restricted to a plane where the
steering direction was indicated by the angle and the After fixing arrival direction was indicated by the angle (the direction perpendicular to the array baseline), the were computed for any beam signals possible angle and the beam pattern was evaluated by using (4), rewritten as follows: (13) The conventional beam pattern (after transformation into a logarithmic scale and normalization) is shown in Fig. 4(a): it follows the theory of wide-band beamforming [26]. An expected beam envelope was defined equal to the envelope of the beam signal obtained when the steering and the i.e., the condition in which arrival directions coincide the confidence level should be the highest). Then, the expected envelope was corrupted by an additive Gaussian noise of tunable power and the goodness-of-fit level was measured by using the related SNR. In Fig. 5(a), for instance, one can see the expected envelope and the real envelope (of the beam steered in the arrival direction) when the SNR is equal to 20 dB.
MURINO AND TRUCCO: ENHANCING UNDERWATER ACOUSTIC IMAGE FORMATION
277
It is important to note that this equation yields values that are already on a logarithmic scale. The normalized beam power pattern was evaluated when the SNR of the expected envelope was equal to 20 dB [see Fig. 5(a) and 4(b)], 10 dB [see Fig. 5(b) and 4(c)], and 5 dB [see Fig. 5(c) and 4(d)]. The beam pattern in Fig. 4(b) shows a dramatic decrease in the side-lobe level together with a sharp narrowing of the main lobe, as compared with the conventional beam pattern in Fig. 4(a). However, the close agreement between the expected and real envelopes could be judged too optimistic for real conditions. If the SNR is reduced to 10 dB (more realistic condition) and 5 dB (pessimistic condition), the advantages are always present but their importance is proportionally decreased. In any case, a comparison of Fig. 4(d) with Fig. 4(a) shows that at an SNR 5 dB the side-lobe reduction is greater than 10 dB and the main lobe width is less than a half, despite the poor similarity between the real and expected envelopes [see Fig. 5(c)]. To complete the analysis, it is necessary to study what happens when a great difference in shape between the expected and real envelopes is associated with a wrong amplitude prediction. For instance, we computed the beam pattern when the expected envelope had an amplitude that was twice the and real one, as shown in Fig. 6(a). We fixed in order to stress the shape comparison, and we obtained the result shown in Fig. 6(b). The shape comparison is very important, independently of the amplitude comparison. When the wave has an arrival angle different from the steering one, the pulse in the beam signal has a shape that is sharply enlarged, as compared with the expected one. To point out this effect, Fig. 7(a) shows the pulse envelope when the beam signal is steered in the arrival direction, whereas Fig. 7(b) shows the pulse envelope when the beam signal is steered 15 from the arrival angle. Thanks to this effect, the tuning of the two constants allowed us to achieve a good result despite a wrong amplitude prediction: the obtained beam pattern is very similar to those in Fig. 4(c), computed at an SNR of 10 dB. From the above consideration, one can deduce that the confidence level could be a flexible way to improve the beam pattern of an imaging system when a knowledge (even though if approximate) of the backscattered pulse envelope is available. The beam patterns showed that an improvement in the lateral resolution and a decrease in the interfering signals can be achieved.
(a)
(b)
(c) Fig. 5. Expected (solid line) and received (dotted line) echo envelopes when the SNR is: (a) 20 dB; (b) 10 dB; (c) 5 dB.
Following (12) and after fixing the profile was computed for each beam signal, of the confidence of the above-mentioned collection. In this way, the confidence was dependent on the arrival angle like the beam The beam signal; therefore, we denoted it by pattern after the application of the confidence was computed by using a new version of (4) in which the profile of the confidence replaced the envelope of the beam signal: (14)
E. Comparative Analysis An additional way to evaluate the performances of confidence levels is to compare the output signals from different echo-detection systems when the input signal is the same, i.e., a given beam signal in which a couple of replicas of the insonification pulse is present. Fig. 8 shows the plot of such is a basic signal containing two ideal replicas signals: (of amplitudes 1 and 0.5, respectively) of a rectangular pulse composed of 5 carrier cycles. A realistic beam signal was at an SNR of 0 obtained by adding Gaussian noise to is the output signal from a common envelope detector dB; is the signal obtained preceded by a matched filter;
278
IEEE TRANSACTIONS ON IMAGE PROCESSING, VOL. 8, NO. 2, FEBRUARY 1999
(a)
(b)
Fig. 6. (a) Example of the expected (solid line) and received (dotted line) echo envelopes when an inaccurate amplitude estimation is performed. (b) The related beam power pattern computed by applying the CL2 confidence measure.
(a)
Fig. 8. Examples of a possible beam signal and of the related outputs produced by three different systems. (a) Noise-free beam signal; (b) beam signal with additive white Gaussian noise at SNR = 0 dB; (c) matched filter plus envelope detector; (d) confidence measure by direct comparison; (e) confidence measure by indirect comparison.
(b) Fig. 7. Envelope of a beam signal when the beam is steered: (a) in the arrival direction; (b) 15� from the arrival angle.
by applying the first confidence level (i.e., direct comparison) finally, is the signal obtained by to the signal fixing and and applying the second confidence level (i.e., indirect comparison) to the signal For both confidence levels, the expected envelope was defined
as a triangle of unitary amplitude (i.e., and appropriate duration. By comparing the output signals of the three echo detection systems that were aimed at processing the beam signal in Fig. 8, it is possible to point out some considerations. • Owing to the coherent gain of the matched filter, the shows a peak for each echo, despite envelope the low SNR. Unfortunately, the behavior of the signal around the peak is not very steep and the peak height is always related directly to the echo amplitude. by the • The confidence-based processing of the signal direct comparison produces a very steep peak when the amplitude of the triangle is close to the expected one, and
MURINO AND TRUCCO: ENHANCING UNDERWATER ACOUSTIC IMAGE FORMATION
279
Fig. 9. Geometry for the experiment using a synthetic linear array and a scene made up of nylon strings. The figure also shows the beam patterns related to two different beam signals perpendicular to the array and applied to different points.
completely rejects the echo having an amplitude that is half the expected one. Sometimes, when the amplitudes of the expected echoes can be computed with high precision, this behavior can be very useful to discard echoes due to side lobes. by • The confidence-based processing of the signal the indirect comparison produces two steep peaks with a sufficient independence of the echo amplitude. These two peaks are not so steep as in the direct-comparison case, but, from an imaging point of view, the overall behavior is much better than that of the of the signal Moreover, the dependence of the peak on the signal echo amplitude can be regulated by tuning the value of thus allowing the exploitation of this the coefficient method even when the a priori amplitude information is not so precise, as very often occurs. • As both the confidence levels and the matched filter try to locate the exact position of a reflected pulse independently of the duration of the insonification pulse, an accurate determination of the distance does not depend any more on the duration of the transmitted pulse, but it tends where is the to approach the ideal case sampling period [2]. IV. RESULTS When the confidence approach is applied, an image is not built any more by starting from the beam-signal envelope but from the profile of the selected confidence level over time. This results in an image of higher quality in which target objects can be reliably detected and the related range information is more accurate, so allowing one to avoid the use (or improve the performances) of restoration/reconstruction algorithms (e.g., [31], [32]) to be applied before scene understanding. Thanks to the flexibility of the indirect comparison, the peaks in the profile of the confidence level are narrower in time and of more uniform amplitude (see Fig. 8). Therefore, in 2-D imaging, it is not necessary to fix a threshold and to
visualize only the points at which the confidence level exceeds the threshold. In 3-D imaging, in order to obtain the external surface of a scene, only the point closest to the observer, among the points at which the confidence level exceeds an attention threshold, can be visualized for each beam signal. This section is divided into three subsections: the first considers 2-D imaging starting from real data and the second deals with 3-D imaging starting from simulated data. In these experiments, the confidence measures were computed without the use of a matched filtering, as the SNR’s of the received signals were quite high. The third subsection concerns the load of the confidence-level computation. A. 2-D Real Images To verify the actual efficiency of the proposed confidence measures, a real experiment was developed and performed in the laboratories of the O. M. Corbino Institute of Acoustics, National Research Council, Rome, Italy. The array was obtained by the synthetic-aperture technique by translating a single transducer, along a straight line, to 250 different 1.5 mm-spaced positions. At each step, the transducer emitted a fixed acoustic pulse and received the pulse echoes coming from a scene. The scene consisted of a set of parallel nylon strings stretched between two plane surfaces and arranged in such a way that the perpendicular section formed the word “SEA,” as shown in Fig. 9. Thanks to the large number of strings used, more than ten successive reflections occurred in some beam signals, due to the strings placed in the steering direction, or to those present in the directions of the side lobes. As can be deduced, it was a severe testbed to assess the performances of the confidence-based approach. The values of the parameters of the array and the scene configuration were the following: sound velocity in the medium: 1500 m/s (assumed constant); carrier frequency: 460 kHz mm); rectangular pulse envelope; pulse (wavelength s; sampling frequency in quadrature [3], duration [33] equal to 1.024 MHz; number of acquired time samples
280
IEEE TRANSACTIONS ON IMAGE PROCESSING, VOL. 8, NO. 2, FEBRUARY 1999
(a)
(b)
(c)
(d)
Fig. 10. Two-dimensional real images of 65 nylon strings. The images were obtained by using: (a) the amplitudes of the envelopes of compensated beam signals; (b) the envelope power; (c) the logarithm of the power (measured in decibels); (d) the envelopes of the output signals of the matched filter.
equal to 202; diameter of nylon strings equal to 0.6 mm; scene distance from the array: between 52 and 64 cm (i.e., 12 cm-high characters), width of the word “SEA” equal to 35 cm. The expected envelope was computed by assuming that the insonification pulse was backscattered from a single target similar to a nylon string, and the echo was received by one omnidirectional sensor placed in the coordinate origin. The scattering was simulated by the method described in [29]. A physics-based model of the expected target was built under the hypothesis that it was not a string but a particle whose dimensions were very small in comparison with and that it had the same radius, density, and bulk modulus as an actual string. This model permitted the use of the scattering transfer function as defined in [34]. Moreover, the simulation was not repeated at all the time instants, but the beam was partitioned into about ten adjacent time intervals and an expected envelope was computed for each interval. To process the acquired signals, we used the beamforming in quadrature in the time domain [3],[33], with a dynamic focusing [27] and unit weight coefficients. Images were ob-
tained by means of parallel beams perpendicular to the array [23], by simply shifting the application point for each beam (i.e., the coordinate origin), as shown in Fig. 9. To calculate each beam, only the signals received from 80 sensors were utilized: 40 to the right and 40 to the left of the application point for the beam. Fig. 10 presents the images obtained by the most widely used methods of visualization (described in Section II). Each image column was formed starting from the behavior of a given beam signal: the output values provided by the method considered were assigned to the image point by point. The visualized area represented a 19 cm 38.4 cm rectangle, 50 cm far from the array. The number of formed beam signals was equal to 250; the application points for the beam signals corresponded to the positions of the sensors in the synthetic array. Fig. 10(a) was obtained by using the amplitudes of the beamsignal envelopes [23], compensated by TVG’s. Fig. 10(b) was obtained according to the behaviors of the compensated square envelopes (envelope power). Fig. 10(c) shows, point by point, the value of the power represented on a logarithmic
MURINO AND TRUCCO: ENHANCING UNDERWATER ACOUSTIC IMAGE FORMATION
281
effectiveness of such determination, providing a lower visual quality than that obtained by the confidence-based method. B. 3-D Simulated Images
Fig. 11. Two-dimensional real image of 65 nylon strings: the image was obtained on the basis of the behavior of the CL2 confidence measure.
scale in dB (denoted by transformation [18]:
calculated through the following
(15) and and where the actual power value is denoted by are the minimum and maximum power values when all the beam signals are considered. At the points at which the value of is indefinite; it is set equal to the minimum value among the values obtained at the other points. Fig. 10(d) was obtained by means of the envelopes representing the outputs of the matched filter, whose inputs were the beam signals compensated by TVG’s. Finally, Fig. 11 was obtained by using the outputs of the confidence method after fixing based on an indirect comparison and In both Figs. 10 and 11, 256 gray levels were used, which were assigned according to the linear law (16) is the gray level of the pixel associated with the where which represents, depending on the method used, the value amplitude, the power, the power logarithm, the output of the and matched filter, or the confidence level. The values are the minimum and maximum values of in a whole image. The images obtained by the matched filter and the confidence-based method (both are local procedures) are very uniform, unlike those obtained by the described pointwise methods (based on amplitude, power, and the power logarithm). However, one can notice that, among the methods used, only the one based on confidence levels makes it possible to clearly separate the target points from the background by eliminating the “gray” background and sharply reducing the halos around the points. Moreover, in Fig. 11, the size of the points representing the nylon strings is smaller than that obtained by the other methods, including the matched filter. This filter improves the distance determination, but the slow slopes of a signal around peaks (see Fig. 8) limit the visual
To verify the efficiency of the confidence measures in 3-D imaging, an experiment was performed by the simulation method described in [29], generalized to 3-D images [30]. The simulation required a square array placed on the plane (Fig. 2) and made up of receiving sensors that acquired the echoes coming from a scene. The echoes were produced by an omnidirectional insonification performed by a single transmitter placed in the coordinate origin. The medium was assumed to be linear and homogeneous. To evaluate the robustness of the confidence-based method, white Gaussian noise was added to the signals received by the sensors; the noise was such as to obtain an SNR equal to 10 dB. The configuration used for the experiment was characterized by the following parameters: sound velocity in the medium: mm), 1477 m/s, carrier frequency: 500 kHz s, triangular acoustic-pulse envelope, pulse duration 50 1-cm-spaced sensors, sampling array made up of 50 frequency in quadrature equal to 50 kHz. The scene consisted of three continuous surfaces: 30 cm, parallel to 1) a rectangle of dimensions 20 cm the array and 5 m far from it [upper left portion of Fig. 12(a)]; 2) a 20 cm 20 cm square whose distance from the array ranged from 3.5–3.62 m, according to the plane where [middle equation portion of Fig. 12(a)]; 3) a spherical cap of 30 cm diameter whose distance from the array ranged between 6.50 and 6.57 m [lower right portion of Fig. 12(a)]. To process the signals acquired, we used a phase-shift BF implemented through the FFT, with a dynamic focusing and unit weight coefficients [24]. This type of beamforming is 2-D and beams have the same application point (i.e., the coordinate origin) but different steering directions. Since, in this case, the targets represented continuous objects, the expected envelope was computed by assuming that the insonification pulse was backscattered from a surface parallel to the array, and the echo was received by one omnidirectional sensor. The dimensions of the simulated surface were equal to those of the region covered by the main-lobe width at the various distances (since the beam pattern was assumed to be rectangular, as described in Section III-A). By analogy to the simulation of the three objects in the scene, the small surface was simulated by a random dispersion of ideal punctiform scatterers at an average distance smaller than [29]. The simulation was repeated for all the distances of interest, changing the surface dimensions and storing the resulting expected envelopes. In real cases, the surface should be modeled by using the available a priori information about the scattering characteristics of the material of the objects to be detected in a scene (e.g., target strength, etc.). The images shown in Fig. 12 are the projections of the obtained 3-D maps on the array plane. The area of each
282
IEEE TRANSACTIONS ON IMAGE PROCESSING, VOL. 8, NO. 2, FEBRUARY 1999
(a)
(b) Fig. 12. Projections of 3-D maps on a plane parallel to the array: (a) the darkness is proportional to the absolute maximum amplitudes of beam signals; (b) the darkness is proportional to the CL2 confidence measure.
image is a square of 1.8 m side. In Fig. 12(a), the darkness represents the value of the absolute maximum amplitude (compensated for according to the distance) for each beam signal. In Fig. 12(b), the darkness indicates the value of the first significant maximum value of the behavior of the (calculated for each beam signal) for confidence level and The transformation defined by (16) was applied to these two images, too, in order to use all the 256 gray levels available. Of course, from these images one can derive only the shapes of the objects, not their distances from the array. As can be noticed, the image obtained by the confidence levels is better defined and more homogeneous than that obtained by the maximum amplitudes, as the spurious halos were sharply reduced. If one tries to eliminate the halos from Fig. 12(a) by means of suitable thresholds, one loses, at the same time, many elements of the scene, thus degrading the shapes of the target objects and making the scene understanding more difficult.
Fig. 13. Result of the postprocessing restoration algorithm based on the MRF approach and applied to the image in Fig. 12(a).
A postprocessing restoration algorithm can also be applied to recover original information. Fig. 13 shows the result of a restoration algorithm applied to the image in Fig. 12(a). This algorithm is based on the Markov random fields (MRF’s) approach [32]. A cost function to be minimized iteratively has been designed that makes it possible to embed criteria useful for image restoration. In this case, as typically occurs in restoration problems, smoothness and closeness to input observations were chosen as constraints imposed on the cost function. One can notice that the final result obtained by the MRF-based algorithm is quite similar to that obtained by the confidence-based technique [Fig. 12(b)], but the latter was achieved with a much lower computational load. Figs. 14 and 15 present the 3-D elevation maps obtained, respectively, by the maximum absolute amplitudes of the beam-signal envelopes and by the confidence levels. In both : if the value cases, each beam signal results in a point of the maximum amplitude or of the confidence level related to this point does not reach a given attention level (threshold), the point is translated to the background. To fix such a threshold, the values of the maximum amplitudes and of the confidence levels related to the whole image were normalized to a value between zero and one; then the value 0.1 was chosen as a threshold to degrade the overall information only slightly. The value on the axis indicates the height (in meters) with respect to the background, whose distance from the array center was equal to 6.76 m. By analogy to the previous images, in these pictures, too, the darkness indicates the value of the maximum amplitude (Fig. 14) and the value of the confidence level (Fig. 15). The quality and the definition of the map obtained by the confidence approach are higher than those of the map obtained by the absolute maximum amplitudes. The confidence-based approach improves the quality of a map through an accurate echo detection, while avoiding subsequent applications of restoration and/or reconstruction algorithms. This result should be considered not only from a visual point of view (actually, in a map obtained by using only amplitude values, a human operator could detect the objects
MURINO AND TRUCCO: ENHANCING UNDERWATER ACOUSTIC IMAGE FORMATION
283
Fig. 14. Three-dimensional elevation map of the scene containing the objects described in the text; the map was obtained by means of the absolute maximum amplitudes. The points generated by maximum amplitudes below a threshold (10% of the total range) were translated into the background.
Fig. 15. Three-dimensional elevation map of the scene containing the objects described in the text; the map was obtained by the The points generated by confidence values below a threshold (10% of the total range) were translated into the background.
present in a scene and infer their shapes in some way, even though with more difficulty), but especially for the purpose of automatic scene recognition. Recognition systems have not yet reached such a level of development to face all possible real situations (in particular, in underwater environments), hence input images of good quality can facilitate the automatic recognition/understanding of an observed scene. Thanks to the perfect knowledge of the scene simulated, one can evaluate the quality of the obtained 3-D maps by means of objective error criteria [8], [16]. To this end, we built an ideal 3-D map of the scene considered and used the mean square error (MSE) to assess the qualities of the maps shown the value of the in Figs. 14 and 15. If we denote by coordinate at the point on the ideal map and by the corresponding value on the map calculated by means of
CL2 confidence measure.
the maximum amplitudes or by the confidence level, we can define the MSE as MSE
(17)
is the total number of possible pairs Morewhere over, we also evaluated the percent relative mean square error (RMSE), defined as RMSE
(18)
The map built by means of the maximum amplitudes (Fig. 14) shows an MSE equal to 898 cm and an RMSE equal to 0.1963%. The map built by means of the confidence level (Fig. 15) shows an MSE equal to 608 cm and an RMSE
284
IEEE TRANSACTIONS ON IMAGE PROCESSING, VOL. 8, NO. 2, FEBRUARY 1999
equal to 0.1376%. One can notice that both errors decrease, thanks to the confidence level, by a factor equal to about 1.45. C. Computational Remarks The computational load required by confidence levels is not very high, as compared with that necessary to calculate a beam signal [2], [3], [33]. However, it can be further reduced by efficient implementation methods. For instance, one can try to limit the number of times the confidence value has to be evaluated by computing it only at those time instants in which the envelope is sharply greater than zero. For both 2-D and 3-D images, the calculations of the confidence levels on the basis of indirect comparisons were performed at the end of the beamforming process. Such calculations increased the computational load by a percentage ranging from 5%–20%, as compared with the load required by a simple beamforming. V. CONCLUSIONS In this paper, we have proposed a confidence-based technique for image formation that requires a local comparison between each beam-signal envelope and the expected one, and that is suitably defined on the basis of the modeling of the scene observed and in accordance with the physics of the signals involved. It is a 1-D signal processing technique that can be applied at an early processing stage to improve the formation of 2-D or 3-D images. The proposed confidence measure acts as an interface between output beamforming signals and an image. As a result, one can overcome the problems arising when acoustic imaging is performed directly on the basis of the point-wise behavior of beam signals. A direct consequence is that echo detection is enhanced and allows the on-line formation of images of better quality, which in turn results in an easier scene recognition. The performances of the proposed confidence measures have been evaluated both on real data (1-D array) and simulated data (2-D array), after addition of white Gaussian noise. The results obtained are more satisfactory than those obtained by the most widely used methods. When the confidence-based method is used in conjunction with a matched filter, the global performance is notably improved. An interesting future development will be the devising of and in a more a methodology to fix the values of objective way. Moreover, a potential future development will lie in making the confidence measures participate actively in the computation of beam signals, besides acting as interfaces at the beamforming output. For instance, since wide-band, highresolution beamforming is characterized by a narrow depth of field [35], suboptimal automatic focusing algorithms using the confidence measures could be developed to estimate the correct focusing distance on the basis of the beam signal obtained. ACKNOWLEDGMENT The authors wish to thank Prof. G. B. Cannelli, E. D’Ottavi, L. Pitolli, and G. Pontuale of the O. M. Corbino Institute of
Acoustics for kindly providing the real data used in this paper and for the useful advice concerning the handling of such data. REFERENCES [1] J. L. Sutton, “Underwater acoustic imaging,” Proc. IEEE, vol. 67, pp. 554–566, Apr. 1979. [2] M. Okino and Y. Higashi, “Measurement of seabed topography by multibeam sonar using CFFT,” IEEE J. Oceanic Eng., vol. OE-11, pp. 474–479, Oct. 1986. [3] R. O. Nielsen, Sonar Signal Processing. Boston, MA: Artech House, 1991. [4] D. H. Turnbull and F. S. Foster, “Beam steering with pulsed twodimensional transducer arrays,” IEEE Trans. Ultrason., Ferroelect., Freq. Contr., vol. 38, pp. 320–333, July 1991. [5] A. Drukarev, K. Konstantinides, and G. Seroussi, “Beam transformation techniques for ultrasonic medical imaging,” IEEE Trans. Ultrason., Ferroelect., Freq. Contr., vol. 40, pp. 717–726, Nov. 1993. [6] A. Macovski, “Ultrasonic imaging using arrays,” Proc. IEEE, vol. 67, pp. 484–495, Apr. 1979. [7] M. Soumekh, “Array imaging with beam-steered data,” IEEE Trans. Image Processing, vol. 1, pp. 379–390, July 1992. [8] B. D. Steinberg and H. M. Subbaram, Microwave Imaging Technique. New York: Wiley, 1991. [9] C. F. Schueler, H. Lee, and G. Wade, “Fundamentals of digital ultrasonic imaging,” IEEE Trans. Sonics Ultrason., vol. SU-31, pp. 195–217, July 1984. [10] R. W. Sheriff, “Synthetic aperture beamforming with automatic phase compensation for high frequency sonar,” in Proc. 1992 Symp. Autonomous Underwater Vehicle Technology, Washington, DC, June 1992, pp. 236–245. [11] M. P. Hayes and P. T. Gough, “Broad-band synthetic aperture sonar,” IEEE J. Oceanic Eng., vol. 17, pp. 80–94, Jan. 1992. [12] K. D. Rolt and H. Schmidt, “Azimuthal ambiguities in synthetic aperture sonar and synthetic aperture radar imagery,” IEEE J. Oceanic Eng., vol. 17, pp. 73–79, Jan. 1992. [13] V. Murino, B. Quellec, J. A. S. Victor, and P. Robert et al., “MOBIUS: 4th Progress REPORT MAST 0028-CD (2nd-year Rep.),” Rep. TS.ASM 92/B/STS/NC/208-BQ/CC, Oct. 1992. [14] J. Chatillon, M. E. Bouhier, and M. Zakharia, “Synthetic aperture sonar for seabed imaging: Relative merits of narrow-band and wide-band approaches,” IEEE J. Oceanic Eng., vol. 17, pp. 95–105, Jan. 1992. [15] L. J. Busse, “Three-dimensional imaging using a frequency-domain synthetic aperture focusing technique,” IEEE Trans. Ultrason., Ferroelect., Freq. Contr., vol. 39, pp. 174–179, Mar. 1992. [16] S. R. Ghorayeb, W. Lord, and S. S. Udpa, “Application of a beamforming technique to ultrasound imaging in nondestructive testing,” IEEE Trans. Ultrason., Ferroelect., Freq. Contr., vol. 41, pp. 199–208, Mar. 1994. [17] Y. Ozachi, H. Sumitani, T. Tomoda, and M. Tanaka, “A new system for real-time synthetic aperture ultrasonic imaging,” IEEE Trans. Ultrason., Ferroelect., Freq. Contr., vol. 35, pp. 828–838, Nov. 1988. [18] M. S. Hughes, “Analysis of digitized waveforms using Shannon entropy,” J. Acoust. Soc. Amer., vol. 93, pp. 892–906, Feb. 1993. [19] D. Irac´a, L. Landini, and L. Verrazzani, “A piece-wise spatial invariant model of ultrasonic image formation,” IEEE Trans. Ultrason., Ferroelect. Freq. Contr., vol. 35, pp. 457–463, July 1988. [20] P. N. Keating, T. Sawatari, and G. Zilinskas, “Signal processing in acoustic imaging,” Proc. IEEE, vol. 67, pp. 496–510, Apr. 1979. [21] U. R. Abeyratne, A. P. Petropulu, and J. M. Reid, “Higher order spectra based deconvolution of ultrasound images,” in Proc. 1995 IEEE Workshop on Nonlinear Signal and Image Processing, Neos Marmaras, Greece, vol. I, pp. 539–542. [22] S. G. Johnson and M. A. Deatt, “The application of automated recognition techniques to side-scan sonar imagery,” IEEE J. Oceanic Eng., vol. 19, pp. 138–144, Jan. 1994. [23] S. Buogo et al., “Visualizzazione del fascio acustico subacqueo focalizzato per mezzo della tecnica dell’apertura sintetica,” Rivista Ital. di Acustica, pp. 53–60, July/Sept. 1992. [24] V. Murino and A. Trucco, “Dynamic focusing by FFT beamforming for underwater 3D imaging,” Acoust. Lett., vol. 17, no. 9, pp. 169–172, 1994. [25] X. Lurton and S. Coatelan, “Array directivity for wide band signals: A time-domain approach,” Proc. Europ. Conf. Underwater Acoustics, Luxembourg, Sept. 1992. [26] V. Murino, A. Trucco, and A. Tesei, “Beam pattern formulation and analysis for wide-band beamforming systems using sparse arrays,” Signal Process., vol. 56, pp. 177–183, Jan. 1997.
MURINO AND TRUCCO: ENHANCING UNDERWATER ACOUSTIC IMAGE FORMATION
[27] M. H. Lee and S. B. Park, “New continuous dynamic focusing technique in ultrasound imaging,” Electron. Lett., vol. 21, pp. 749–751, Aug. 15, 1985. [28] I. Claesson and G. Salomonsson, “Frequency- and depth-dependent compensation of ultrasonic signals,” IEEE Trans. Ultrason., Ferroelect. Freq. Contr., vol. 35, pp. 582–592, Sept. 1988. [29] T. L. Henderson and S. G. Lacker, “Seafloor profiling by a wideband sonar: Simulaton, frequency-response, optimization, and results of a brief sea test,” IEEE J. Oceanic Eng., vol. 14, pp. 94–107, Jan. 1989. [30] O. George and R. Bahl, “Simulation of backscattering of high frequency sound from complex objects and sand sea-bottom,” IEEE J. Oceanic Eng., vol. 20, pp. 119–130, Apr. 1995. [31] M. E. Zervakis, A. K. Katsaggelos, and T. M. Kwon, “A class of robust entropic functionals for image restoration,” IEEE Trans. Image Processing, vol. 4, pp. 752–773, June 1995. [32] V. Murino, A. Trucco, and C. S. Regazzoni, “A probabilistic approach to the coupled reconstruction and restoration of underwater acoustic images,” IEEE Trans. Pattern Anal. Machine Intell., vol. 20, pp. 9–22, Jan. 1998. [33] D. C. M. Horvat, J. S. Bird, and M. M. Goulding, “True time-delay bandpass beamforming,” IEEE J. Oceanic Eng., vol. 17, pp. 185–192, Apr. 1992. [34] S. N. Rschevkin, The Theory of Sound. New York: Macmillan, 1963. [35] V. Murino, A. Trucco, and G. Tacconi, “Focused beamforming for underwater imaging: Depth of field and range resolution optimization,” in Proc. Oceans’94 Osates Int. Conf., Brest, France, vol. 1, pp. 352–357.
Vittorio Murino (S’92–M’93) received the Laurea degree in electronic engineering and the Ph.D. degree in electronic engineering and computer science, both from the University of Genoa, Genoa, Italy, in 1989 and 1993, respectively. He was a Post-Doctoral Fellow at the University of Genoa, working in the Signal Processing and Understanding Group, Department of Biophysical and Electronic Engineering, as Supervisor of Research Activities on signal and image processing in underwater environments. He worked on several national and European projects funded by the European Commission (EC), especially in the context of the Marine Science and Technology (MAST) program, concerned with the investigation of underwater scenes by visual and acoustical sensors. He is an Evaluator for the European Commission of project proposals related to the MAST III, Industrial and Material Technology (BRITE-EURAM III), and Long Term Research (LTR) programs. In 1995, he became an Assistant Professor with the Department of Mathematics and Computer Science, University of Udine, Italy, where he supervised research activities in an EC-funded project (VENICE, Brite-Euram III program) regarding multisensorial underwater vision for object recognition and virtual reality applications. He is currently an Associate Professor of image processing at the University of Verona, Italy. His main research interests include computer vision and pattern recognition, acoustic and optical underwater vision, data fusion, probabilistic techniques for image processing (Markov random fields, Bayesian networks), and neural networks. Recently, his research has focused on the integration of image analysis and synthesis methodologies for object recognition and virtual reality modeling. Dr. Murino is a reviewer for several international journals and a member of IAPR.
285
Andrea Trucco (S’91) was born in Genoa, Italy, in 1970. He received the Laurea (M.Sc.) degree in electronic engineering from the and the Ph.D. degree in electronic engineering and computer science, both from the University of Genoa in June 1994 and June 1998, respectively. He is responsible for the research activities in Acoustics and Underwater Signals, Signal Processing and Telecommunications Group, Department of Biophysical and Electronic Engineering, University of Genoa. His main research interests are array synthesis, coherent and noncoherent algorithms for acoustic imaging, acoustic image improvement, interferometric sonar and radar, and simulation methodologies. His is also involved in several research projects in the context of the Marine Science and Technology program of the European Commission. Dr. Trucco was three times a finalist for the Philips Awards for European Young Scientists from 1987 to 1990, and ranked third twice. In 1995, he won the Student Paper Competition organized by the 9th International Symposium on Unmanned Untethered Submersible Technology. In 1997, he won the Student Paper Competition organized by the MTS/IEEE Oceans’97 International Conference. He is a member of IAPR.