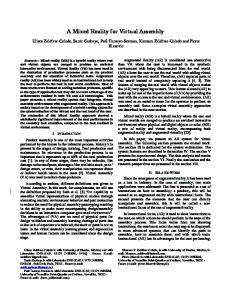
A Dynamic Task Representation Method for a Virtual Reality Application Maria Chiara Leva1, Alison Mragaret Kay1, Fabio Mattei1, Tom Kontogiannis2, Massimiliano De Ambroggi1, and Sam Cromie1 1
Aerospace Psychology Research Group, Trinity College Dublin 2 Ireland 2 Department of Production Engineering and Management, Technical University of Crete, Chania Greece {levac,alison.kay,matteif}@tcd.ie,
[email protected],
[email protected],
[email protected]
Abstract. The paper introduces an approach and a tool for representing tasks in the workplace as it emerged from a research finalized in reproducing safety critical tasks in Virtual Reality (VR) simulations. In the context of an EU research project called Virthualis. The tool, developed to address the needs of three different user groups, supports data collection and provides a structure for the interviews and for the simultaneous graphical representation of the task. It can be used as a common means of communication between the technical personnel involved in the interviews, the human factors expert and the VR expert. This aids the common understanding of a task, its main objective, challenges and criticalities whilst performing the actual analysis. Keywords: Task analysis, Human Factors, safety procedures, troubleshooting.
1 Introduction A proper acquisition of relevant information about a task in a safety-critical environment is the foundation of every sound human factor analysis. The scope of the analysis may cover a Human Reliability Assessment, an evaluation of a humanmachine system, the writing of a procedure or the preparation of a training program. More and more studies have highlighted that this critical first step of the analysis has often been neglected leaving the design stage without structured information about the tasks and contexts to be addressed.[1], [2], [3], [4], [5], [6]. This issue has become apparent in the course of a European project (called Virthualis) aimed at reproducing safety-critical tasks in Virtual Reality (VR) simulations. The main insight leading to the implementation of the project, is that real plants can be modeled in VR, where experiments can be conducted, observations made and data collected. This gives the safety analyst a safe environment to form and test hypothesis, and train operators using a trial and error approach, something that can seldom be done on a real plant. Within Virthualis the analysis of the task and its description is the first input required for the development of the Virtual Reality (VR) simulation. In this framework the Task Modeler is just a tool used for guiding the preliminary phases of data collection about task to be analyzed and then represented using the D. Harris (Ed.): Engin. Psychol. and Cog. Ergonomics, HCII 2009, LNAI 5639, pp. 32–42, 2009. © Springer-Verlag Berlin Heidelberg 2009
A Dynamic Task Representation Method for a Virtual Reality Application
33
Virtual Reality. Its scope is to provide a structure of the interviews and for the graphical representation of the task so that it can be a common means of communication for all involved in the analysis. 1.1 End Users Needs for Task Modeling and Representation In the preliminary phase of the project end-user needs were elicited. The end-users can be subdivided in three different user groups: the HF analysts, the Industrial End Users and the VR experts. The Human Factors analysts needed an approach and a tool to help them in providing: - A template for the interview process of a Task analysis with the ability to structure the interview phase in order to highlight and examine the deviations from standard practice. These deviations are fundamental to understanding what can and does go wrong in the field and should be an integral part of any safety critical task representation. A graphical representation of the procedure map linked to the template including: - A list of tasks and subtasks with their associated actor roles, mapping a given procedure. - Logical links between sub-tasks, events and actor roles. - A list of all the possible sequences of execution for a given procedure - A list of possible success end states and failure end states. - A list of the possible error modes of the tasks and Performance Shaping Factors (PSF) affecting activities. - A list of tools, documents, artifacts and information exchanges between the roles for each step of the task. - A tabular representation of the above elements derived from the graphical structure - A task analysis that can constitute the basis for performing a quantitative human reliability assessment of a task. - The possibility of comparing the procedure with VR experiment results and to change it if necessary. The industrial end-users needed: - A representation of the task that was easy to understand so that they could verify the information they provided was correctly translated - Be able to use the task analysis to rewrite existing standard procedures - Derive indication for ad hoc possible troubleshooting procedures. Finally, the VR experts tasked with providing a representation of the data requested the following information: - A graphical description of a task and its objectives including logical and temporal description of the expected steps and actors carrying out those steps and a formal description of the task sequences (XML schema) - A list of the different actors to be involved in the Procedure under analysis and indication about the relevant part of the plant, tools and equipment the actors are likely to come in contact with during task execution.
34
M.C. Leva et al.
-
A list of relevant performances to be observed and in respect to which meaningful interactions should be provided (warning messages etc.).
Some existing tools and method have been revised in the area of Task analysis and Workflow Modeling to address those needs. Table 1 reports a summary of the review. Table 1. Revision of existing techniques/tools in respect to Virthualis user needs
Tool and Method revised in the task analysis domain Hierarchical Task Analysis (HTA); [7] is a process for developing a description of tasks in terms of operations (things people do to reach goals) and plans (statements of conditions that tell when each operation is to be carried out). HTA has been mostly used for the design of training. Its merit is mainly the clear representation technique. HTA is currently supported by a software: www.taskarchitect.com [8] Goal Operators Methods Selectors (GOMS) [9] is one of the most influential task analysis techniques for the purpose of user interface design. It is intended to estimate user performance based on the description of the system before the system is actually built. Several attempts have been made over the years to develop graphical representation tools as well. (ftp://www.eecs.umich.edu/people/kieras/GOMS/GO MSL_Guide.pdf) Méthode Analytique de Description des taches (MAD) [10] is the task modelling part of a larger method for designing interactive systems. In MAD, task models are similar to HTA models except that the plan has been replaced by so called constructors in order to specify the time order in which tasks are executed. Templates are used to describe the task details even if most of the fields are merely for description purposes and are not used in any automated evaluation or transformation. MAD is supported by a tool called (KMADe) (http://kmade.sourceforge.net/).[11] Groupware Task Analysis [3] essentially consists of a conceptual framework that specifies relevant aspects of the task world that need attention for design purposes. For extracting data, it uses techniques such as structured interviews, interaction analysis, and observation. Task modeling is then performed as a cyclic activity where models are created, evaluated, modified. GTA mainly
Issues in respect to Virthualis needs The main problem encountered with it was primarily the limited capability to represent task deviations flow and critical decision point as logical gates. GOMS underpinning model does not allow for any type of error analysis, the model works under the assumption that a user will know what to do at any given point.
The tool has been developed primarily with the focus of analysis of user interfaces. Therefore task structure is still configured around the notion of a hierarchical breakdown of a task tree that does not logically represent the impact of task deviation on the nominal expected flow. This tool has also been developed primarily with the focus of analysis of user interfaces. Therefore, the main issue encountered was the difficulty in representing task deviations flow and
A Dynamic Task Representation Method for a Virtual Reality Application
35
uses hierarchical representations. GTA is also supported by a software tool: http://www.cs.vu.nl/~martijn/gta/.[12] Tool and Method revised in the workflow modeling domain: Microsaint is a commercial tool developed by Micro Analysis and Design Inc. It consists of a discreteevent network simulation software package for building models that simulate real-life processes. It is used to model and simulate manufacturing processes, such as production lines, to examine resource utilization, efficiency, and cost. It can model service systems to optimize procedures, staffing, and other logistical considerations and it can model human operator performance and interaction under changing conditions. [13]
critical decision points as logical gates.
IBM Task modeler in Eclipse [14] The “Task Modeller” developed by IBM as an editor that is part of the software development platform called Eclipse A usability practitioner can produce either classic HTA (Hierarchical Task Analysis) diagrams or RAG (Roles and Goals) diagrams. A development manager can produce a use case model. The link for the download and demo version of this product is the following: http://www.alphaworks.ibm.com/tech/taskmodeler/d ownload
The issue related to this UML modeling tools is that its usage for Human Factors Practitioners and Safety analysts is not so immediate because it is meant to be used primarily by software developers. Furthermore no support is provided for guiding the task analysis interview process.
Issues with respect to Virthualis needs: With respect to this tool, the issues highlighted were the impossibility of using the source code and modifying it in order to integrate the tool within the Virthualis platform. Also, the fact that Microsaint does not really model human error, and does not allow the provision of a classification of the possible errors for a given procedure
In revising the techniques for workflow modeling it was highlighted that a UML notation currently used is the Business Process Modeling Notation (BPMN) [15]. The “primary goal of BPMN is to provide a notation readily understandable by all business users, from the business analysts that create the initial drafts of the processes, to the technical developers responsible for implementing the technology that will perform those processes, and finally, to the business people who will manage and monitor those processes. BPMN provides a simple means of communicating process information to business users, process implementers, customers, and suppliers. The notation seems to be very suitable for representing the task in a graphical way easily understandable and for providing a sound logical structure to serve the needs elicited among Virthualis users.
36
M.C. Leva et al.
2 Task Modeling within Virthualis: The Approach Chosen The Task Modeler developed within Virthualis provides a structured interview template for the human factor practitioner so that he can reconstruct a model of an actual task execution considering also the deviation from the nominal task flow and its consequences. The structured interview template has been prearranged in such a way that all the branching of the task, also the ones originating from deviation, are analyzed and represented till they reach their final outcomes (it was decided to use a stop logic that depends upon the purpose of the case study). Furthermore, the method for representing the chain of events in the Task Modeler needs to have a clear logical structure for task-mapping. The structure should be composed of the following main categories: -
-
Activities (tasks and sub-processes). An activity is a generic term for work that the operator performs. An activity can be atomic or non-atomic (compound). Events (start events, messages to be sent to the system or the other actors, completion events, errors, deviations, tools related events) Links and Gates (gateways for controlling the merging or splitting of actions according to “And” & “Or” logic, connectors between activities, gates etc..) Gateways are used to control the divergence and convergence of the sequence flow and critical decision points where deviations can occur; links are used to show the order that activities are supposed to be performed in a process; links can also represent referents to messages flows and associations. Information connected to task (performance shaping factors, etc.) does not have a direct effect on the Sequence Flow or Message Flow of the Process, but provide useful information about what data may be required to perform the activity, what influences the activity and/or what the activity can produce.
2.1 Description of the Tool Developed The “Task Modeler” (TM) uses different Graphical User Interfaces (GUIs) for editing and visualizing the collected information in different formats. The representation of the task model can be input following a guided structured interview, through two editors: a graphical and tabular one. The visual representation documents the relationship between tasks and sub-tasks making up a procedure, highlighting the workflow, actor interactions, parallelisms, and possible deviations. Every change in each editor has to be simultaneously reported on any other. For the first version of the TM, five processes were considered: 1. A safety analyst / human factor (HF) specialist imports, exports or creates a new task model; 2. A safety analyst / HF specialist performs a task analysis interview sessions in real time by filling the interview template or the tabular task; 3. A safety analyst / HF specialist alters a certain task representation; 4. Industrial end-user views and print a task model; 5. Retrieve different kinds of reports about the task model
A Dynamic Task Representation Method for a Virtual Reality Application
37
Fig. 1. Use case diagram illustrating some uses of the tool by the three different user groups
The Graphical User Interface developed includes five main sections: 1. Section 1 “Case study Wizard: it allows the creation of a new case study, the definition of its properties (general information about the plant under study, the interviews sessions, the operators involved etc..) and it introduces the template for the structured interview. 2. Section 2 provides a tabular editor of the information collected trough the template of the structured interview. 3. Section 3 provides a graphical view of the sequence of events, actions and messages in the task model. The sequence is synchronized with the information input through the tabular or the wizard view and can be edited directly as well. The graphical interface provides a palette containing the symbols used for representing the task model (Business Process Modeling Notation) and a map facilitating the navigation of extended graphs. 4. Section 4 enables the analyst to query the information inserted. 5. Section 5 is in common with the Virthualis Platform and enables to explore and edit existing task models and its connected properties. 2.2 Detail Description of TM Functions The first section of the GUI is the case study wizard. As previously mentioned, this section has a first step in which it allows to create a new case study and define its properties (general information about the plant under study, the interviews sessions, the operators involved in the analysis, the PSF related to the case study, etc..). There are three different screens for the first step of GUI Section 1 each one of them has a specific purpose.
38
M.C. Leva et al.
Fig. 2. General information about the Case Study
Fig. 3. List of all the Performance Shaping Factors associated with the Case Study
Screen 1: To create and edit a new case study. An example is reported in Fig.2. The “Id” is automatically given by the software. The fields to be filled are: a. b. d. e. f. g.
Name of the case study; Goal to specify the main goal of the case study; and description; Plant involved; The status of the plant (start up, shut down, normal operation, emergency operation, other); The estimation of task frequency (every day, every week, once a year); The estimation of the expected time in terms of distribution and its parameter.
Screen 2 (Fig.3) is used to visualize the Performance Shaping Factors (PSF) affecting the task, while Screen 3 is used to visualize the information about the operators (“Job Roles”, e.g. CR operator, CR assistant), tools (e.g. gas detector, spanner), plant areas (e.g. control room), and plant components (e.g. pressure valve) inserted for the task. This form is automatically filled by the software collecting the information from the nodes generated during the specification of the steps of the task.
A Dynamic Task Representation Method for a Virtual Reality Application
39
Fig. 4. Example of a screen for the Interview Template
Fig. 5. Properties that can be specified for each node of the Task Model
The second step of GUI Section 1 deal with the interview templates (Fig.4). It includes the template for the structured interview in which the interviewer is able to go through the definition of all the steps of the normal flow of the task and their connected attributes during an interview session. This part will have different screens for inputting the actual outline of the task. Specifically the inputs required are: a)
The information about the case study trigger (a case study trigger can be any of the possible task nodes: an action/task or an event, or a gate); b) The information associated with each task node.
The form is set up into two tabs, one for the general description and one to detail the properties. In this form, it is possible to define the gate or rule specification in which the logic of the sequence of action and event can be explicitly identified; Figure 4 shows the form to be filled to input a new event and the detail of the popup window used to select the conditions.
40
M.C. Leva et al.
The second tab allows detailing the properties of the nodes (Fig. 5) that is: - Expected Duration of the step – it is possible to specify a time distribution; - Actors involved (Job Roles) – all the actors involved in the step. - Tools, Plant areas, and Plant components involved in the considered step. The second Section of the GUI provides a tabular view of the information collected trough the template for the structured interview. It also enables to modify this information and the changes are synchronized for any other Section. The information collected into the tabular view is exportable in a file format readable by Ms Word, Ms Excel, and XML. The third Section provides a graphical view of the sequence of events, actions and messages forming the task model. This third graphical representation enables the Safety Analyst / Human Factors expert to edit the task model in a graphical way. The graphical interfaces provides a graphical palette containing the symbols used for graphically representing the task model (which is the Business Process Modeling Notation) and a map facilitating the navigation of extended graphs. It is possible to drag and drop the symbol from the graphical palette into the drawing area to create a new node of the task. The map is updated every time the drawing area or the tabular view is edited. The properties of every generic graphical node or connection are editable by opening the guided interview template format for the selected node through a right-click of the mouse. The tabular view and the graphical view are visible from a unified window as shown in Fig.6.
Fig. 6. Graphical and Tabular view of the task model
GUI Section 1, Section 2, Section 3 and Section 4 use the same data model according to the chosen Model View Controller (MVC) architectural pattern.
3 The Task Model and the Design of VR Experiments The task analysis provides a structured description of the activities that permits a high-profiling of the task, the context of work and the users’ needs. However, task analysis is more focused on “what” the operators are expected to do than on “how”
A Dynamic Task Representation Method for a Virtual Reality Application
41
Table 2. Link between PSF, task deviations and suggestions for VR experiments Task deviation Does the operator spot the leakage in the first 5 min?
PSF Clearness of roles/responsibility Accessibility/Location of leakage Number of simultaneous goal
Suggestions for VR experiment In one experiment no one is clearly assigned to the task of oil leakages, the set of tasks are shared among everybody Test different positions for the leakage (first floor and second floor) In one experiment the operator assigned to do the checking is also assigned many other tasks, in another is only assigned one or few compatible tasks
they actually perform their activities from their own perspective. Another method, based on user scenarios, seems to be more suitable to examine user activities from the visual perspective (e.g. location, gaze direction, affordances and constraints on movement) and generate functional and usability specifications for virtual environments (VE). This information however can find as a cornerstone the fact that for each node of the task model (especially critical decision-points), the important performance shaping factors and tools to be used are recorded. They are linked to specific task deviations and in relation to those and the need to observe how they influence the task some suggestion for the Virthualis simulation experiments can be reported. An example of it is reported in Table 2.
References 1. Kirwan, B., Ainsworth, L.K. (eds.): A. Guide to Task Analysis. Taylor &. Francis, Ltd., London (1992) 2. Diaper, D., Stanton, N.A.: The Handbook of Task Analysis for Human-Computer Interaction Lawrence Erlbaum Associates Inc. Publishers Mahwah, New Jersey (2004) 3. Van Welie, M., Van der Veer, G.C.: Groupware Task Analysis. In: Hollnagel, E. (ed.) Handbook of Cognitive Task Design, pp. 447–476. Lawrence Erlbaum Associates, New Jersey (2003) 4. Kontogiannis, T.: A Petri Net Based Approach for Ergonomic Task Analysis and modelling with emphasis on adaptation to system changes. In: Safety Science, vol. 41, pp. 803–835. Elsevier Pergamon Press, Amsterdam (2003) 5. Chitnis, M., Tiwari, P., Ananthamurthy, L.: UML Overview, Tutorial, http://www.developer.com/design/article.php/1553851 6. Jung, W.D., Yoon, W.C., Kim, J.W.: Structured Information Analysis for Human Reliability Analysis of Emergency Task in Nuclear Power Plants. In: Reliability Engineering and system Safety, vol. 71, pp. 21–32. Elsevier Science, Amsterdam (2001) 7. Annett, J., Duncan, K.D.: Task analysis and training design. Journal of Occupational Psychology 41, 211–221 (1967) 8. TaskArchitect software, http://www.taskarchitect.com
42
M.C. Leva et al.
9. Card, S.K., Thomas, T.P., Newell, A.: The Psychology of Human-Computer Interaction. Lawrence Erbaum Associates (1983) 10. Baron, M., Lucquiaud, V., Autard, D., DL et Scapin: K-MADe : un environement pour le noyau du modèle de description de l’activité. In: Proceedings of the 18th French-speaking conference on Human-computer interaction, Montreal, Canada, April 18-21 (2006) 11. K-MADe, http://kmade.sourceforge.net/ 12. Groupware Task analysis, http://www.cs.vu.nl/~martijn/gta/ 13. Microsaints, http://www.maad.com/index.pl/micro_saint 14. Task modeller IBM, http://www.alphaworks.ibm.com/tech/taskmodeler/download 15. White, Stephen, A., Miers: Derek BPMN Modeling and Reference Guide. Future Strategies Inc. (2008)