A Feature-based Machine Learning Agent for Automatic Rice and Weed Discrimination Beibei Cheng Microsoft Corporation Redmond, Washington Email:
[email protected]
Eric T. Matson M2M Lab-RICE Research Center Purdue University West Lafayette, IN, USA Email:
[email protected]
Abstract
global population expected to reach 9 billion by 2050, agricultural production must double if it is to meet the increasing demands for food and bioenergy. Given limited land, water and labor resources, it is estimated that the efficiency of agricultural productivity must increase by 25% to meet that goal, while limiting the growing pressure that agriculture puts on the environment. Robotics and automation can play a significant role in society meeting 2050 agricultural production needs. For six decades robots have played a fundamental role in increasing the efficiency and reducing the cost of industrial production and products.
Rice is an important crop utilized as a staple food in many parts of the world and particularly of importance in Asia. The process to grow rice is very human labor intensive. Much of the difficult labor of rice production can be automated with intelligent and robotic platforms. We propose an intelligent agent which can use sensors to automate the process of distinguishing between rice and weeds, so that a robot can cultivate fields. This paper describes a feature-based learning approach to automatically identify and distinguish weeds from rice plants. A Harris Corner Detection algorithm is firstly applied to find the points of interests such as the tips of leaf and the rice ear, secondly, multiple features for each points surrounding area are extracted to feed into a machine learning algorithm to discriminate weed from rice, last but not least, a clustering algorithm is used for noise removal based on the points position and density. Evaluation performed on images downloaded from internet yielded very promising classification result. 1.
Introduction
Rice is an important crop utilized and depended on as a staple food in the diet of many people. This dependence spans many parts of the world and is of particular importance in many parts of Asia. The process to grow rice is not currently as automated as are many other dependent staple crops across the world such as wheat, corn or sorghum, which are produced in large fields with efficient techniques, large machinery and mass production. Unlike these crops, the production of rice remains a very human labor intensive practice. Given the statement of belief by the IEEE Robotics and Automation Society [1], the automation of agriculture can be enhanced with robotic, and therefore agent-oriented systems. Agriculture is humankinds oldest and still its most important economic activity, providing the food, feed, fiber, and fuel necessary for our survival. With the
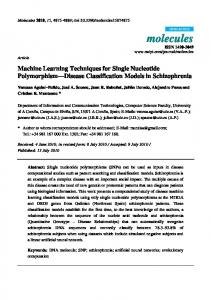
Much of the difficult labor of rice production can be automated with intelligent and robotic platforms. We propose an intelligent agent architecture which can use sensors to automate the process of distinguishing between rice and weeds, so that a robot can cultivate fields. This agent system will be used to control a platform, such as Bonirob [2] as shown in Fig. 1, which is an example of a row crop robotic platform that can be utilized in tillage and general crop production. A. Motivation As a good source of protein and a staple food in many parts of the world, rice is mostly planted in Asia and subtropical/tropical zone of Africa. Weedy plants which are growing with rice not only cost time and energy for farmers to get rid of them, but also cost rice damage and lost earnings. Nowadays, with the development of agriculture technology, we are looking for an automatic rice/weed discrimination method in order to produce rice in a more efficient way. The cycle of rice growing can be divided into five stages as showing in Fig. 2 [3]. Rice ear starts growing up after the heading stage, where rice can be obtained from, as shown in Fig. 3 marked by pink circle. There is a plenty of weeds in the rice farm, Fig. 4(a) ~ (d) shows four typical types of common weeds in rice fields [4].
(a)
Fig. 1. Bonirob (IEEE RAS).
(b)
(c) (d) Fig 4. Four typical types of common weeds, (a) Sagittaria Trifolia, (b) Semen Euphorbiae, (c) Alligator Alternanthera, (d) Barnyardgrass.
Fig. 2. The cycle of rice. Fig. 5. Original Image (Rice with Semen Euphorbia in the center.)
Fig. 3. Rice ear and leaf tips.
B. Background and Related Work Several approaches to rice/weed classification have been proposed with varying degree of success. Ryohei et al proposed a method of rice plant detection based on rice ear detection [5]. Xavier et al developed an approach using crop rows extraction to get rid of the weed [6]. Hong et al used feature extraction and artificial neural network for crop/weed segmentation [7]. However, there are drawbacks in each existing approach: although rice ear can be used as an important feature to distinguish rice from weed in [5], the weed inside young rice plant (without rice ear) has to be identified as well, which is even more critical since weed often causes more damages to young rice; different from crop in [6], the rice is planted in the water and is growing in both vertical and horizontal direction, which is impossible to use the straight row to eliminate weed; [7] requires to segment each individual plant before extracting its features, while it is hard to separate them since the
leaves of rice are overlapping each other as shown in Fig. 5. After addressing the above drawbacks, this paper proposed a general solution to discriminate weed in different rice growing stages. The solution is briefly described as below. First, instead of segmenting the edge of rice/weed, the corner points (i.e. the tips of leaf, the rice ear as shown in Fig. 3) are detected by using Harris Corner Algorithm. Second, multiple features for each points surrounding area are extracted to represent the color of that area, the coarseness of that area and so on. Thirdly, some machine learning algorithms are utilized to train those features in order to get a classifier to deliver high discrimination accuracy. The detail of the methodology is given in the next session. This paper is organized with the methods in section 2, experiments and results in section 3, conclusions in section 4 and finally the future work in section 5. 2.
Methods
An overview of methods used is shown in Fig. 6. A pre-processing algorithm - Harris corner detection is used for the points of interests’ localization and characterization. Feature sets for all the detected Harris points are generated, which is used to train the machine learning algorithm. A post-processing algorithm – DBSCAN is used to do some postprocessing. The following shows each processing step in detail. A. Sample Image Fig. 5 is an image with size 1125x1500 downloaded from the internet with one of the typical weeds named Semen Euphorbia inside the rice. As you can see, some rice plants have ear while some do not. The following shows the steps how to find out the weed from the rice. 1125x1500 image containing both weed and rice 1125x1500 image containing both weed and rice Detected weed points
Pre-processing using Harris corner detection
DBSCAN
Fig.6. Overview for weed discrimination from rice.
B. Harris Corner Detection The tips of roots/branches/leaves/gains from both weed and rice are corner points. Based on the fact that Corner is detected based on the significant change in all directions while edge has no change along the edge direction, Harris corner detection algorithm [8] is firstly applied to mark the region of interest as shown in Fig.7. Fig 5 is firstly divided into 480x360 sub-region from top left to bottom right. Harris points are then calculated based on each subregion. Fig. 7 demonstrates the overall detected Harris points. C. Feature Extraction Relevant features extracted from a 40x40 window with the Harris corner pixel at the center include color features and texture features. Color features measure the absolute color and the change of color while the texture features measure the smoothness, coarseness and regularity of that area. The color features are item 1 to 6, in Table 1. The texture features are item 7 to 14. However, these texture features use only histograms, which carry no information regarding the relative positions of pixels with respect to each other. To solve this problem, a co-occurrence matrix [9] is used which considers pixel position. Additional textual features from these co-occurrence matrices are labeled from item 15 to 24 in Table 1. D. Feature Evaluation After the 24 features listed in Table 1 are extracted from each point in Fig. 7, the ground truth for each point is also the ground truth for each point is also manually labeled(‘0’ represent rice while ‘1’ represent weed). Each feature’s information gain [10] is calculated and three features (11, 13 and 14) are removed because their information gain is zero.
Harris corner points found inside image
Machine learning for classification
Generate features
Weed and rice feature sets
Fig. 8 and 9 demonstrates the data visualization with red dots representing rice points and blue dots representing weed points for the worst two features combination (feature 11 and feature 13) and the best features combination (feature 6 and feature 22).
E. Machine Learning Algorithm 1) Supervised Learning: Therefore, the training data set including the point’s twenty-one features and the ground truth is used to train multiple machine learning algorithms such as Decision Tree [11], Support Vector Machine [12], Neural Network [10]. 2) Clustering Algorithm: Grouping the more similar objects in the same group, clustering algorithm is an unsupervised learning method. Density-based spatial clustering of applications with noise (DBSCAN) [14] is the clustering algorithm chosen in this research. The DBSCAN identifies clusters in large spatial data sets by looking at the local density of database elements. It is applied here to remove the false positive Harris Points of weed based on the different density between weed area and rice area. 3.
Fig. 7. Output Image with Harris Points.
Fig. 8. Data distribution in feature 11 and feature 13 plane.
The experimental data set consists of 1261 Harris points with 561 rice points while 700 weed points as shown in Figure 7. A ten-fold cross validation is used to set up the training and testing data sets. The data set is divided into ten parts where 9/10 is used for training and the rest is used for testing. This procedure is repeated ten times. The accuracy of the classifier is based on averaging the accuracy of the ten test sets. Table 2 presents the accuracy result by applying different machine learning algorithms, and shows that decision tree delivers the best classification result. Fig. 10 provides the ten-fold cross validation result for all Harris points after applying the trained decision tree classifier. As you can see, most of Harris points of the weed are correctly discriminated except few points of rice are incorrectly detected as the weed. DBSCAN is then applied for grouping those Harris points based on their position. For DBSCAN algorithm, the number of objects in a neighborhood of an object is set to be 8 and the neighborhood radius is set to be 50. As shown in Fig.11, those false positive weeds with black color are removed because of their low density. 4.
Fig. 9. Data distribution in feature 6 and feature 22 plane.
Experiments and Results
Conclusions
As the importance of rice grains are paramount to the health and security of people in many parts of the world, the increased efficiency introduced by intelligent agent systems and robotics, will be critical in the coming years. As the emphasis has been placed on agricultural robotics by many government an
nutrients to be focused on the efficient production of rice or other needed grains. We have proposed and developed an intelligent agent which can use sensors to automate the process of distinguishing between rice and weeds, so that a robot can take on the former human task of field cultivation. If the robot cannot distinguish between the weed and the crop, it is impossible to deploy robots for this time consuming and arduous environment task. So, in this paper, we describe a feature-based learning approach to automatically identify and distinguish weeds from rice plants. Fig. 10. Output Image with weed discrimination after decision tree classification.
This paper proposes a framework for weed and rice identification based on image feature analysis and machine learning techniques. Harris point finder is applied to the preprocessing of the images. Multiple features associated with the weed/rice types are then extracted. Machine learning algorithms are employed to classify weed from rice and then DBSCAN is used to remove the false positive weed. The experimental results demonstrate that integration of various image processing techniques, feature extraction techniques, and machine learning methods as proposed in this paper can achieve high classification accuracy. 5.
Fig. 11. Output Image with weed discrimination after DBSCAN clustering.
academic agencies to fulfill these needs, the technology to enable humans to reduce the human effort and time required to produce rice will be important. The human time can be used for higher level practice, while the lower lever and lower capability tasks of rice production can be relegated to machines. One of the time consuming tasks is that of cultivation and reduction of noxious and resource draining weed species. Reducing the weeds will allow all ground
Future Work
This current work results in an agent that can do rudimentary work to distinguish between rice plants and common weed types. The future work includes the inclusion of more weed types to differentiate from rice. Secondly, the implementation of this system on a rice field robot for navigation and elementary cultivation testing. Finally, the generalized methodology will be used to create a method employable in any production crop scenario.
Table 1. Extracted features. Feature set Color features
Label 1 2 3 4 5 6
Measure Mean Red Mean Green Mean Blue Std Red Std Green Std Blue
Description The average red value inside window The average green value inside window The average blue value inside window The standard deviation of red inside window The standard deviation of green inside window The standard deviation of blue inside window
Textual features
7 8 9 10 11 12 13 14 15~16 17~18 19~20 21~22 23~24
Mean of histogram Variance of histogram Skewness of histogram Flatness of histogram Contrast of histogram Maximum of histogram Correlation of histogram Closeness of histogram Contrast Correlation Uniformity Closeness Strongest response
The first moment of gray image The second moment of gray image The third moment of gray image The fourth moment of gray image The intensity contrast of gray image The uniformity of gray image The correlation of gray image The homogeneity of gray image The intensity contrast of correlation matrices The correlation of correlation matrices The uniformity of correlation matrices The homogeneity of correlation matrices The maximum probability of correlation matrices
Table 2. Performance comparison for different machine learning algorithms Decision Tree SVM Naive Bayes
TP Rate 0.982 0.952 0.929
References [1] IEEE RAS Agricultural Robotics, http://www.ieeeras.org/agriculturalrobotics. [2] Ruckelshausen, A., Biber, P., Dorna, M., Gremmes, H., Klose, R., Linz, A., Rahe, F., Resch, R., Thiel, M., Trautz, D., Weiss, U. 2009. BoniRob an autonomous field robot platform for individual plant phenotyping. Proceedings of the Joint International Agricultural Conference, Wageningen, 2009. [3] The rice Growing and Production Process, http://www.rga.org.au/f.ashx/rice growing.pdf. [4] General weeds types, http://wenku.baidu.com/view/ e0bb770a844769eae009ed6a.html. [5] Ryohei Masuda, Kenta Nakayama, Kazuo Nomura, Rice plant detection in heading team for autonomous robot navigation , XVII World Congress of the International Commission of Agricultural and Biosystems Engineering (CIGR), Qubec City, Canada, June 13-17, 2010. [6] Xavier P. Burgos-Artizzu, Angela Ribeiro, Maria Guijarro, Gonzalo Pajares, Real-time image processing for crop/weed discrimination in maize fields. Comput. Electron, 75, 337-346, 2011.
FP Rate 0.019 0.047 0.066
Precision 0.982 0.953 0.931
Recall 0.977 0.952 0.929
[7] Hong Y. Jeon, Lei F. Tian, Heping Zhu, Robust crop and weed segmentation under uncontrolled outdoor illumination. Sensors, 11, 6270-6283, 2011. [8] Chris Harris, Mike Stephens, A combined corner and edge detector. In Alvey Vision Conference, pages 147152, 1988. [9] Robert M. Haralick, K.Shanmugam, Itshak Dinstein, Textural Features for Image Classification. IEEE Transactions on Systems, Man, and Cybernetics, SMC-3, 610-621, 1973. [10] T.M. Mitchell, Machine Learning, the Mc-Graw-Hill Companies, Inc, 1997. [11] Leo Breiman, Classification and Regression Trees, Boca Raton, FL: CRC Press, 1984. [12] Cortes, C.; Vapnik, V, Support-vector networks, Machine Learning 20 (3): 273, 1995. [13] Martin Ester, Hans-Peter Kriegel, Jrg Sander, Xiaowei Xu, A density based algorithm for discovering clusters in large spatial databases with noise. In Evangelos Simoudis, Jiawei Han, Usama M. Fayyad. Proceedings of the Second International Conference on Knowledge Discovery and Data Mining (KDD-96), AAAI Press. 226 -231, 1996.