A Framework for Automatically Detecting and Assessing Performance Antipatterns in Component Based Systems using Run-Time Analysis Trevor Parsons Performance Engineering Laboratory Dublin City University
[email protected] Abstract We propose a framework for automatically detecting and assessing the impact of poor performance design (performance antipatterns) in component based systems using run time analysis. The framework consists of three modules, a monitoring module, a detection module, and a visualization module. Our framework borrows techniques from the field of Knowledge Discovery in Databases. We intend to instantiate the framework for the Enterprise Java Beans platform.
1. Introduction Current complex distributed enterprise systems with performance requirements can be difficult to design for even the most experienced system designers. There are many different facets that contribute to the complexity of such systems. When designing these systems one has to contend with issues related to security, maintainability, reusability, transactional integrity, performance, etc. Component based middleware platforms such as Enterprise Java Beans (EJB), Microsoft .Net and the CORBA Component Model (CCM) address the needs of large enterprise projects by providing reusable standardized services and reliable runtime environments. Such platforms allow developers to concentrate their efforts on fulfilling application requirements rather than spending time developing the underlying infrastructure. However, even with such existing technologies in place, enterprise systems still prove extremely complex. As a result it can be difficult for developers to completely understand the performance impact of their design decisions. Such design decisions can play a large role in an application meeting its performance goals. The literature [1] demonstrates how different software architectures impact the overall system performance. The paper shows how different software architectures, providing the same functionality, yielded different performance results while running in identical environment conditions.
John Murphy Performance Engineering Laboratory University College Dublin
[email protected] The increasing use of Commercial Off The Shelf (COTS) components [2] can create further confusion, in terms of a complete understanding of system behavior, since the internals of such components may be unknown. Nevertheless, system designers squeezed by shrinking development cycles, are often compelled to treat performance as an afterthought, a matter of production tuning to be accomplished after the system has been coded, integrated, functionally tested and deployed. As a result of time-to-market constraints and the complexity of enterprise systems developers may not have a proper understanding of the system design from a performance perspective and consequently complex distributed enterprise systems often suffer from severe performance problems. The next section presents our proposed solution, a framework for automatically detecting and assessing the impact of poor performance design (performance antipatterns [3]) in component based systems using runtime analysis. We apply techniques borrowed form the field of Knowledge Discovery in Databases (KDD). Section 2 gives a brief introduction to the field of data mining and knowledge discovery in databases, followed by the detailing of our monitoring, detection, and visualization modules. Section 3 presents two Enterprise Java Bean performance antipatterns and shows how the detection module detects these patterns in a sample system. Section 4 discusses related work. Section 5 presents current status & future work. Section 6 gives our conclusions.
2. Proposed Solution We propose a framework for automatically detecting and assessing the impact of poor performance design (performance antipatterns) in component based systems using dynamic analysis, by applying techniques borrowed form the field of Knowledge Discovery in Databases (KDD). Our solution is applied to a running system in order to detect, assess and visualize performance antipatterns that may be present in the system. The
Monitoring Module
2.1 Knowledge Discovery in Databases
Detection Module
Collects run-time performance data for each component in the distributed application
ARM The ARM phase mines the runtime data for association rules at minimum level of support and confidence
Distributed Application
RA Using performance data and support/confidence levels the performance impact of the discovered rules on the system is assessed
The component based system being monitored
Rule Selector may request further pass of ARM and RA phases
Visualisation Module AD Creates UML models of the system at different levels of abstraction using run-time data highlighting discovered hotspots and antipatterns. Antipatterns are augmented with suggested refactorings.
Rule Selector Antipattern Library
Looks for rules containing antipattern characteristics
Deployment Descriptor Analyser
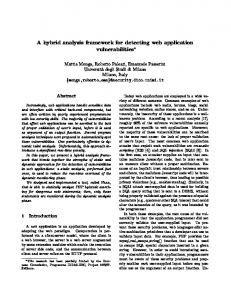
Figure 1. Framework Overview increasing use of COTS components means that static analysis of applications, in order to discover the underlying system design, for example [4] and [5], may be rendered useless when applied to many component oriented systems, since the entire source code for these applications may be not be completely available. In contrast, to [4] [5] our approach uses dynamic analysis combined with the analyzing of the systems deployment descriptors to uncover poor performance design, eliminating the need for static analysis. Our technique is applied to a running system, and consequently fits well with iterative (agile) development processes such as Extreme Programming [6] and the Rational Unified Process [7] which require a running implementation of the application at each iteration of development. In addition, with the aforementioned component technologies, system composition may occur very late in the development process and in some cases it may even occur at runtime. This fact results in the need for performance tools that can be applied to a running system so that the interaction of components that bind at runtime can be observed and assessed in terms of performance, and resource usage. As opposed to current performance tools, that tend to generate massive amounts of data which can prove overwhelming when trying to locate the cause of performance bottlenecks, our approach makes sense of such data, and through processes similar to those used in the field of KDD presents the discovered “knowledge” in readable, familiar formats pin-pointing the performance problems and their underlying causes. The framework consists of three modules: a monitoring module, a detection module, and a visualization module (see Fig. 1).
The emerging field of KDD [8] combines techniques from pattern recognition, statistics, machine learning, databases, and visualization to automatically extract concepts, concept interrelations, and patterns of interest from large databases. The basic task is to extract knowledge, or information, from lower level data (databases). The basic tools used to extract patterns from data are called Data Mining methods, while the process of surrounding the usage of these tools (including preprocessing, selection, and transformation of the data) and the interpretation of patterns into “knowledge” is the KDD process. This extracted knowledge is subsequently applied to support human decision-making, e.g., prediction and classification tasks, summarize the contents of databases, or explain observed phenomena. The application of KDD systems alleviates the problem of manually analyzing the large amounts of collected data which decision-makers face presently. KDD systems have been implemented and currently in use in finance, fraud detection, market data analysis, astronomy, diagnosis, manufacturing, and biology. The KDD process (Fig. 2) is made up of the following sub processes: selection, pre-processing, transformation, data mining and interpretation. The proposed framework can be considered as an instance of the KDD process. The monitoring module (described in section 2.2) implements selection, pre-processing and transformation of data, the detection module (section 2.3) performs the data mining and interprets the discovered patterns while the visualization module (section 2.4) presents the discovered knowledge. Data mining is currently used for such tasks as exploratory data analysis, descriptive modeling, predictive modeling, pattern discovery and retrieval by content. We are currently interested in using data mining techniques from the field of pattern discovery. Agrawal et al. [9] [10] introduced a class of regularities, association rules, and gave algorithms for finding such rules. An association rule is an expression X=>Y, where X and Y are sets of items. The intuitive meaning of such a rule is that transactions of the database which contain X tend to contain Y. Association rules are statements of the form “98% of customers that purchase tires and automobile accessories also get automotive services.” Association Rule Mining (ARM) is the process of finding relationships among attributes in large databases. The exemplar application of ARM is market basket analysis. Bar-code technology has made it possible for retail organizations to collect and store massive amounts of sales data, referred to as basket data. A record in such data typically consists of the transaction date and the items bought in the transaction. Finding association rules from such basket data is valuable for cross-marketing and attached mailing applications. However, ARM can be applied to any activity where a large amount of data is available and we
PreProcessing
Selection
Data
Target Data
Pre-processed Data
Transformation
Data Mining
Transformed Data
Interpretation
Patterns
Knowledge
Figure 2. The KDD Proces give a transaction centric view of a component based suspect that there might be something interesting in that system. The COMPAS interaction [14] [15] recorder can data. Application domains range from decision support to be used to record all business transactions. It captures telecommunications alarm diagnosis and prediction. We user-initiated scenarios and displays the sequence of EJB intend to apply association rule mining to the task of calls that comprise them. It also collects related detecting poor performance design. performance data. Essentially we intend to use ARM algorithms to gain better understanding of how and where system resources 2.3 Detection module are being consumed within a component based system. By The detection module performs the data mining and is applying ARM to dynamic data produced by the responsible for the discovery and assessment of monitoring module, we can obtain statistical information performance hotspots and antipatterns that exist within the on what sequences of calls are most common within the running system. This module uses the run time system. By analyzing the common sequences and their information collected by the monitoring module as its related resource usage, potential performance hotspots are input. The detection module’s process can be divided into uncovered and assessed. The detection module scans all three phases: ARM, Rule Assessment (RA) and common sequences to discover any known antipatterns Antipattern Detection (AD). that exist within them. All potential hotspots and 2.3.1 Association Rule Mining. ARM is performed in antipatterns are displayed in the visualization module. order to find interesting relationships and patterns within Explanations and possible refactorings can be associated the runtime data collected. The relationships that are with the hotspot candidates that have known antipatterns found during the initial phase are expressions of the form associated with them. X => Y, where X and Y are sets of items, or in our case, 2.2 Monitoring Module sets of method calls. The intuitive meaning of such an The goal of the monitoring module is to collect run time expression is that transactions of the database which data for each component in the distributed system. The contain X tend to contain Y. X is referred to as the monitoring module collects the method calls made by antecedent of the rule and Y the consequent. The each component, and their related performance data. The following is a formal statement [9] describing the ARM detection module uses algorithms that require a problem performed in the ARM phase of the detection transaction centric view of the system, i.e. the method module: Let I={i1,i2,…,im} be a set of literals, called items. calls from different components are aggregated into their Let D be a set of transactions, where each transaction T is related business transactions. Fig. 3 displays the output I. Each transaction has an an itemset such that T format produced by the monitoring module. For each associated unique identifier, called its TID. A set of items method call performance data is collected. In particular X I is called an itemset. T contains an itemset X, if X memory usage and CPU usage are obtained. T. An association rule is an implication of the form X =>Y, where X I, Y I, and X Y=0. The rule X =>Y holds in the transaction set D with confidence c if c% of transactions in D that contain X also contain Y. The rule X => Y has support s in the transaction set D if s% of Figure 3. Monitoring Module Format transactions in D contain X Y. The ARM phase of the detection module discovers all The Java Virtual Machine Profiler Interface (JVMPI) association rules of sufficient support and confidence. A [11] (soon to be replaced by JVMTI [12]) is a C interface number of ARM algorithms already exist in the literature to the Java Virtual Machine (JVM), which is used by [16]. Once the association rules are discovered, they are profilers to gain access to information relating to the used as input into the RA and AD phases. Since a JVM’s current state. Using the JVMPI, it is possible to minimum support level is set when performing rule extract CPU and memory consumption information at a discovery, discovery of insignificant less frequent method level. Performance tools such as [13] and [14] occurring antipatterns can be avoided. The approach taken [15] have the ability to collect performance data and to allows the most commonly occurring antipatterns to be
discovered by initially setting a high minimum support level. By lowering the minimum support level less frequently occurring patterns can be subsequently discovered, if required. Specifying a minimum confidence value ensures that the discovered rules are accurate. Accurate rules suggest that a strong pattern exists. Lowering the minimum confidence level allows weaker patterns to be discovered, if so needed. 2.3.2 Rule Assessment. The assessment module scans the rules produced during the ARM phase. The rules are assessed in light of the performance impact they have on the system. Performance data collected during runtime analysis, as well as the support and confidence levels associated with the discovered rules, are utilized to compute the impact of each rule in relation to system performance at the current system load, thus, highlighting any performance hotspots. Both the data mining information and performance data are also used by the assessment module to predict the impact rules may have on system performance at different workloads. Because potential hotspots may not have a significant impact at the current system load, but could become the performance bottleneck if the workload was to increase, the assessment module uses the support and confidence levels as well as the related performance data to predict the impact of rules at higher workloads. By analyzing support and confidence levels, trends in relation to what parts of the system are most active can be revealed. Applying performance data to the discovered trends, the assessment module can detect and highlight what rules will most affect the system performance at different loads. As a result, even at low loads the framework has the ability to detect bottlenecks that may only appear at higher workloads. This is quite advantageous since such load dependent performance bottlenecks can often be overlooked during testing. In many cases the testing environment may not be able to simulate loads quite as large as those that would occur in the production environment and due to this fact the antipatterns and hotspots may not be discovered until the system is in full use. 2.3.3 Antipattern Detection. On completion of the ARM and RA phases, the AD phase of the detection module inspects the rules and uncovers the performance antipatterns within them. The AD phase is made up of three components: the Antipattern Library, the Deployment Descriptor Analyzer and the Rule Selector: The Antipattern Library is made up of a collection of performance antipatterns and each pattern is accompanied with a description in terms of its system specific characteristics. The Deployment Descriptor Analyzer: System specific information is required by the Rule Selector so that it can identify the antipattern characteristics within the rules being analyzed. The required information can be obtained from the EJB deployment descriptors, which avoids the need to inspect the system source code. Deployment descriptor inspection
is advantageous since with the increasing use of COTS components, system source code may not be available in its entirety. The Rule Selector: For every performance antipattern in the Antipattern Library the Rule Selector inspects all rules discovered during the ARM phase. Rules which contain antipattern characteristics are marked as antipattern instances. To be able to identify antipattern characteristics the rule selector requires information from the deployment descriptor analyzer. In order to detect instances of certain antipatterns, rules at a range of support and confidence levels may be required (see section 3.3). Therefore, for certain antipatterns the rule selector may request a further pass of the ARM and RA phases.
2.4 Visualization module A significant percentage of performance problems in component based systems come about because of a poor understanding of the system. In many cases developers do not understand why there are performance implications when a change in the expected user loads occurs or when there is a change to the system design. The visualization module utilizes information from the monitoring and detection modules to create models of the system. The models augmented with performance data present the system using UML, a format that a vast number of developers are already familiar with, allowing them to view the system from a performance perspective. Any discovered antipatterns and/or hotspots are highlighted within the models. Antipatterns [17] document recurring problems and mistakes made during software development. As well as documenting these problems, antipatterns also document their solutions. Thus, antipatterns help to identify what might be wrong with a software project and what can be done to resolve these issues. Performance antipatterns [3], in documenting the problem, list the performance principles [3] violated by the antipattern. Pin-pointing the existence of performance antipatterns with suggestive refactorings and explanations of the problem not only helps developers to locate and treat performance issues within the system, but also helps form a sense of performance intuition as the underlying performance principle [3] being violated by the antipattern is disclosed. The visualization module follows the Model Driven Architecture [18] paradigm insofar as the system models can also be presented at different levels of abstraction allowing developers to zoom in and out on particular problems within the system.
3
Example System
In the following sections we provide two example antipatterns and describe how our detection module detects each pattern. Work is currently underway to automate the process described.
3.1 Antipattern A: Too Many Remote Calls Badly designed distributed applications may suffer from poor performance for a variety of reasons. A major cause of poor performance, however, is a large communication overhead between the distributed components of the system. In many cases this large communication overhead is a direct result of bad (or a lack of) system design. Often if performance issues had been taken into consideration at the design stage, distributed communication between components could have been dramatically reduced.
relationships. Consequently, the loading of an instance of a single entity bean may result in the loading of numerous entity beans from the database, producing a large entity bean graph. When loading an object can result in the loading of a huge number of related objects, performance suffers. This is especially wasteful if the case is such that only a few objects are actually needed. For example an entity bean may exist in an e commerce system that represents a user’s account details. The user account entity bean may contain the fields name, userid, age, phone and address. For the example lets say that the field address is itself an entity bean containing a similar number of fields of which some are entity beans. Therefore, loading the user account entity, results in a number of beans getting loaded. A situation may arise such that a high percentage of the time the entity is loaded only the first three fields, namely name, userid and age, are ever accessed. Therefore loading the entire bean graph is wasteful. A common solution to this problem is to lazy load the fields that are not generally needed. Loading a complete entity bean graph is known as aggressive loading and is a common EJB antipattern.
3.3 Antipattern Detection Phase
Figure 4. Sample Output from the Monitoring Module This antipattern creeps up in EJB systems in many shapes and forms. The problem is that multiple fine grained invocations of remote session/entity beans add the overhead of multiple network calls. A typical example is the accessing of remote entity beans directly, rather than accessing them through a session facade. Consider an online e commerce scenario where before a purchase is complete a customer chooses to review his/her account details. A servlet receives a request to retrieve a customer’s details and makes n + 1 remote calls to the remote entity bean (accessing the bean’s n remote getter methods and the bean’s finder method). Alternatively using a Session Façade [19], the number of remote calls could have been reduced to 1.
3.2 Antipattern B: Aggressive Loading of Entities Entity beans are persistent data components, i.e. they are an in memory Java representation of persistent data. Entity bean data is loaded into an in-memory entity bean instance by reading data stored in a database in order to manipulate the data within the Java Virtual Machine. The procedure of loading the data from the database can be a time consuming process especially when entity beans are large objects with numerous fields. The situation is not helped by the fact that beans may be involved in inter-bean
In order to provide a proof of concept of our detection technique we have implemented a sample application with performance related design flaws. The sample application consists of two EJB entity beans namely Department and Employee and an EJB session bean Admin. The transaction file produced by the monitoring module is shown in Fig 4. and contains five different business transactions. We have omitted the performance data from Fig 4. as for this example we are concerned with detection of the antipatterns only and do not assess their related performance impact. We apply our technique to the following list of transactions that were observed over a particular time period. The transactions are a result of the system user looking up the Department entity bean in order to get the department name, Id, wageBill and a list of Employee beans (transaction 1). For each Employee, employee details are obtained (transaction 2) and a session bean is used to calculate an employee’s income tax (transaction 3). The user next looks up a number of Department beans and retrieves values for name and wageBill (transaction 4) followed by a call to the Admin session bean to calculate the department corporation tax (transaction5): {Transaction1,Transaction2,Transaction3, Transaction2, Transaction3, Transaction2,Transaction3, Transaction4, Transaction5,Transaction4, Transaction5, Transaction4}. The ARM phase of the detection module discovers all frequently occurring rules by setting a high minimum support level. We select an initial minimum support value of 25% and a minimum confidence level of 30%. The AD phase of the detection module inspects the rules discovered, searching for certain characteristics that may indicate the presence of antipatterns. The aim is to detect the presence of the two antipatterns described above.
The detection of Antipattern A involves searching the discovered rules for rules of the form: X=>Y, where X is an itemset that contains one remote call and Y is an itemset that contains one or more remote calls. The detection module requires system specific information in order to be able to differentiate between local and remote calls. The system specific information can be acquired from the EJB system’s XML deployment descriptors. Deployment descriptors provide information which allows one to determine whether beans are local or remote. The detection module inspects the deployment descriptors and lists all remote beans, and their respective remote interfaces. The detection module, loaded with this information, inspects all rules and marks rules that satisfy the marking criteria for the particular antipattern being detected. The marking criteria for Antipattern A are: • If both the antecedent and consequent contain remote bean invocations (through the remote interface) the rule will be marked as a possible antipattern. • If two rules X and Y exist that contain remote calls in their antecedent and consequent, where rule X shares the same antecedent as rule Y, the consequent of rule X is a subset of the consequent of rule Y, and rule X has the same levels of confidence and support as rule Y, only rule Y is marked as a possible antipattern. The second criterion above prevents the marking of multiple rules that point to the same antipattern or business transaction(s). Applying the marking criteria to our sample application Table1. Rule #
Antecedent
Consequent
1
department.getName
department.getWageBill
S (%) 33
C (%) 100
2
department.getWageBill
department.getName
33
100
3
employee.getFirstName
employee.getLastName, employee.getAddress employee.getTotalSales, employee.getWeeklySales
25
100
4
employee.getLastName
25
100
5
Employee.getAddress
employee.getFirstName, employee.getAddress employee.getTotalSales, employee.getWeeklySales employee.getFirstName, employee.getLastName, employee.getTotalSales, employee.getWeeklySales
25
100
6
Employee.getTotalSales
25
100
7
Employee.getWeeklySal es
employee.getFirstName employee.getLastName, employee.getAddress employee.getWeeklySales employee.getFirstName employee.getLastName, employee.getAddress employee.getTotalSales
25
100
our detection module marks the rules depicted in Table 1. Rules 1 and 2 relate to Business Transaction 4 and Business Transaction 1 (Fig. 3) and state that “100% of transactions that contain department.getName() also contain department.getWageBill()” (and vice versa). This rule is present in 33% of all transactions. Since these two remote calls are always made together the number of remote calls could be reduced using a Value Object (VO) [19] or Data Transfer Object (DTO) [20] to encapsulate the business data and transport it from the application tier to the client tier reducing the number of remote calls to one, thus improving system performance. Rules 3-7 relate
to Business Transaction 2 (Fig. 3). Rule 3 declares that “100% of transactions that contain empoyee.getFirstName() also contain employee.getLastName(), employee.getAddress(), employee.getWeeklySales() and employee.getTotalSales”. Rule 3 (rules 4-7 point to the same antipattern) is present in 25% of all transactions. Again Antipattern A has been detected. In this situation applying the VO or DTO patterns would reduce the number of remote calls from five calls to one. In cases where the consequent is large, a significant reduction in network traffic can be obtained through refactoring this antipattern. The detection of Antipattern B involves, detecting how often only a proportion of an entity bean’s fields are accessed, detecting how often all of the fields of the same entity are accessed, and comparing these values to give us an idea of what fields should be ideally lazy loaded. This requires searching the discovered rules for rules of the form: X=>Y where X an itemset that contains one getter method relating to a particular entity bean persistent field, and Y is and itemset that contains zero or more getter methods that belong to the same entity bean. Again system specific information can be acquired from the EJB systems XML deployment descriptors. The information required by the detection module in order to detect Antipattern B is collected as follows: for every entity bean in the system, the entity bean’s deployment descriptor is inspected. The detection module subsequently lists all persistent fields belonging to that entity bean. All rules are then inspected with the following marking criteria: • If the antecedent of a rule contains a persistent field getter method belonging to the particular entity, the rule is marked. • If two rules X and Y exist, where rule X shares the same antecedent as rule Y, the consequent of rule X is a subset of the consequent of rule Y, and rule X has the same levels of confidence and support as rule Y, only rule Y is marked as a possible antipattern. Again the second criterion prevents the marking of multiple rules that point to the same antipattern or business transaction(s). From the marked rules we select any rules where the antecedent and consequent do not contain all the getter methods that belong to the particular entity bean. We refer to these rules as the small rules. If a small rule is found the detection module then searches for rules that contain a higher number of persistent field getter methods belonging to the same entity bean. We refer to these rules as the large rules. A further pass of the ARM phase can be performed (and may be required) in order to find the large rules. If not found after further passes we can stop searching for the large rules, satisfied that the large rules do not occur above a certain level of support and confidence. The small rules are compared to the large rules in order to show the presence of Antipattern B. We applied this technique to our sample application. The rules depicted in Table 1 were marked when support and confidence were set to 25% and 30% respectively.
Rules 1 and 2 are small rules and correspond to Business Transaction 4 and Business Transaction 1 and declare that “100% of transactions that contain department.getName() also contain department.getWageBill()” (and vice versa). This rule is present in 33% of all transactions. Only half of the persistent fields of the Department entity bean are covered by rules 1 and 2. The detection module now searches for the corresponding large rules. Since there are no corresponding large rules in Table 1, a second pass of the ARM phase of the detection module with lower support and confidence settings is required. For the second pass we set the confidence and support to 25% and 8% respectively. Applying the marking criteria again to the rules produced by the second pass of the ARM phase, the rules depicted in Table 2 are produced. Rules 10 and 11 (large rules) from Table 2 correspond to Rules 1 and 2 respectively, (small rules) from Table 1. A comparison of the rules highlights the presence of Antipattern B, since (from Rules 1 and 2) 100% of transactions that contain department.getName() also contain department.getWageBill() (and vice versa), however (from Rules 10 and 11, Table 2) only 25% of the transactions that contain either department.getName() or department.getWageBill() contain getter methods for all Table2. Rule #
Antecedent
Consequent
1
department.getName
Department.getWageBill
S (%) 33
C (%) 100
2
department.getWage Bill Employee.getFirstNa me
Department.getName
33
100
employee.getLastName, employee.getAddress employee.getTotalSales, employee.getWeeklySales
25
100
4
Employee.getLastNa me
25
100
5
employee.getAddress
employee.getFirstName, employee.getAddress employee.getTotalSales, employee.getWeeklySales employee.getFirstName, employee.getLastName, employee.getTotalSales, employee.getWeeklySales
25
100
6
employee.getTotalSal es
25
100
7
employee.getWeeklyS ales.
25
100
8
department.getEmplo yees
employee.getFirstName employee.getLastName, employee.getAddress employee.getWeeklySales employee.getFirstName employee.getLastName, employee.getAddress employee.getTotalSales department.getName, department.getId, department.getWageBill
8
100
9
department.getId
department.getName, department.getWageBill department.getEmployees
8
100
10
department.getName
8
25
11
department.getWage Bill
department.getId department.getWageBill department.getEmployees department.getName department.getId department.getEmployees
8
25
3
persistent fields. If no large rules are found with support of 8% and confidence of 25% we can be satisfied that while 100% of transactions that contained department.getName() also contained department.getWageBill(), less than 25% of transactions that contained either of these two getter methods also contained all other persistent field getter methods. In this example scenario a performance improvement can be gained in 25% (33-8) of all transaction by lazy loading the Id and Employees fields, however 8% of the time a performance hit will be taken when the Employees and Id
fields are requested and the information has to be obtained from the database.
4
Related Work
Previous approaches to pattern detection are generally focused on design recovery [4], [5], [21], [22]. Earlier approaches [4], [5] were restricted to static analysis techniques. With current component technologies system composition may occur very late in the development process. In some cases it may even occur at runtime. As a result static pattern detection is not sufficient. More recent approaches [21], [22] have combined the advantages of static and dynamic analysis to overcome this problem and improve design pattern instance recognition. In general source code is used as the basis for the static analysis. However, with the increasing trend towards COTS components, the entire source code of a modern component based systems may not always be freely available. Our approach also uses dynamic data. However we overcome the issue of source code availability by extracting any static system information we require from the system deployment descriptors which are deployed with the system. The aforementioned approaches tend to inspect legacy systems in an attempt to detect design patterns present in the systems so that a better understanding of the system design can be obtained. Such approaches aim at finding all instances of a given pattern. In contrast our approach aims at finding the most frequently occurring instances of a given pattern, since such instances have a more substantial impact on system performance. Related approaches attempt system design recovery by uncovering design patterns in the system, as performance engineers, we are more concerned with the detection of performance design flaws (or antipatterns) within the system. While architectural and design patterns (and antipatterns) are generally concerned with software quality attributes such as reusability and maintainability, performance (anti)patterns, are solely focused on performance concerns. We are particularly interested in EJB performance antipatterns. Performance antipatterns have been presented by the literature [3]. Also, antipatterns related to EJB have been addressed by [23].
5
Current Status and Future Work
We are currently applying our detection technique to trade3 [24], an IBM performance benchmark application. Implementations of the detection and visualization modules are currently underway. Our antipattern library is being expanded to detect a wider range of antipatterns than were presented in this paper. Research into the area of data mining techniques is in progress with the aim of maximizing the efficiency of our detection module. Emphasis is also currently being placed on looking into the field of data mining in greater detail to see how it
could be further applied to extract valuable information from runtime data. Finally we plan on applying our framework to a typical e-commerce system such as [25].
[8] Usama Fayyad, Gregory Piatetsky-Shapiro, and Padhraic
6
[9] Rakesh Agrawal, Tomasz Imielinski and Arun Swami.
Conclusion
We propose a framework to automatically detect and assess the impact of poor performance design (performance antipatterns) in component based systems. Our solution is applied to a running system in order to detect performance hotspots and antipatterns that are present in the system. The framework consists of three modules a monitoring module, a detection module, and a visualization module. We have presented an approach to detect the presence of performance antipatterns using techniques borrowed from the field of data mining and apply this technique to a sample application transaction log file. We present the results of applying the technique to our sample application illustrating the usefulness of this approach. We also included sections on related work and on our current status and future work.
Acknowledgements
Smyth. “The KDD process for extracting useful knowledge from volumes of data.” Communications of the ACM, volume 39, issue 11, pp27-34, November 1996. “Mining Association Rules between Sets of Items in Large Databases”. Proceedings of the 1993 ACM SIGMOD International Conference on Management of Data (1993).
[10] Rakesh Agrawal and Ramakrishnan Srikant. “Fast Algorithms for Mining Association Rules”, Proc. 20th Int. Conf. Very Large Data Bases, VLDB (1994)
[11] http://java.sun.com/j2se/1.4.2/docs/guide/jvmpi/jvmpi.html [12] http://java.sun.com/j2se/1.5.0/docs/guide/jvmti/jvmti.html [13] http://www.quest.com/performasure [14] Mos, A., Murphy, J., “Understanding Performance Issues in Component-Oriented Distributed Applications: The COMPAS Framework”, In Seventh International Workshop on Component-Oriented Programming (WCOP 2002) of the 16th European Conference on Object-Oriented Programming. June 2002, Malaga, Spain.
[15] http://ejbperformance.org. [16] Jochen Hipp, Ulrich Güntzer, Gholamreza Nakhaeizadeh “Algorithms for Association Rule Mining A General Survey and Comparison”. SIGKDD Explorations (2000)
The Authors’ work is funded under the Research Innovation Fund and the Advanced Technology Research Programme from the Informatics Research Initiative of Enterprise Ireland, and is gratefully acknowledged.
[17] Brown, W. J., Malveau, R. C., McCormick, H. W. and
References
[18] Object Management Group, Model Driven Architecture,
[1] E. Cecchet et al., “Performance and Scalability of EJB Applications”, Proc of 17 th ACM Conference on ObjectOriented Programming, Seattle, Washington, 2002, pp 246261
[2] C. Albert, L. Brownsword, “Meeting the Challenges of Commercial-Off-The-Shelf (COTS) Products: The Information Technology Solutions Evolution Process (ITSEP)”,International Conference on Component Based Software Systems (ICCBSS) 2002, LNCS 2255, SpringerVerlag Berlin Heidelberg, 2002, pp. 10-20
[3] Smith, C. U. and Williams, L. G., “Performance Solutions: A Practical Guide to Creating Responsive, Scalable Software”, Addison-Wesley, Boston, MA, 2002.
[4] C. Kramer and L. Prechelt. “Design recovery by automated search for structural design patterns in object-oriented software”. Proc. of the 3rd Working Conference on Reverse Engineering (WCRE), Monterey, CA, pages 208–215. November 1996
[5] R. Keller, R. Schauer, S. Robitaille, and P. Page. “Patternbased reverse-engineering of design components”. Proc. of the 21st International Conference on Software Engineering, Los Angeles, USA, pages 226–235.May 1999.
[6] Beck, K. Extreme Programming. Addison Wesley Longman, Reading, Massachusetts, first edition, 2000.
[7] P. Krutchen, Rational Unified Process, Addison Wesley, April 2000
Mowbray ,T. J. “AntiPatterns: Refactoring Software, Architectures, and Projects in Crisis”. John Wiley, New York, NY, 1998 OMG document number ormsc/2001-07-01, OMG, 2001
[19] Deepak Alur, John Crupi and Dan Malks. “Core J2EE Patterns: Best Practices and Design Strategies.” Prentice Hall / Sun Microsystems Press, 1st edition (June 26, 2001)
[20] Flyod Marinescu. “EJB Design Patterns: Advanced Patterns, Processes and Idioms”. Wiley 2002
[21] Heuzeroth, D., Holl, T. and Löwe, W., “Combining Static and Dynamic Analyses to Detect Interaction Patterns”, Proceedings of the Sixth International Conferenceon Integrated Design and Process Technology (IDPT), June 2002
[22] Lothar Wendehals. “Improving Design Pattern Instance Recognition by Dynamic Analysis”. WODA, ICSE 2003
[23] Tate, B., Clark, M., Lee, B. and Linskey, P., “Bitter EJB”, Greenwich, CT, Manning, 2003.
[24] http://www306.ibm.com/software/webservers/appserv/benchmark3.ht ml
[25] http://rubis.objectweb.org/