A Framework for Optimizing Detour Planning and Development around Construction Zones M. Jardaneh1, A. Khalafallah2, A. El-Nashar3, and N. Elmitiny4 1, 2
Department of Civil, Environmental and Construction Engineering, University of Central Florida, Orlando, FL; email:
[email protected],
[email protected] 3 Department of Industrial Engineering and Management Systems, University of Central Florida, Orlando, FL; email:
[email protected] 4 Egyptian National Institute for Transportation, Ministry of Transportation, Cairo, Egypt; email:
[email protected]
ABSTRACT Construction zones are traffic way areas where construction, maintenance or utility work is identified by warning signs, signals and indicators, including those on transport devices that mark the beginning and end of construction zones. Construction zones are among the most dangerous work areas, with workers facing workplace safety challenges that often lead to catastrophic injuries or fatalities. In addition, daily commuters are also impacted by construction zone detours that affect their safety and daily commute time. These problems represent major challenges to construction planners, as they are required to plan vehicle routes around construction zones in such a way that maximizes the safety of construction workers and reduce the impact on daily commuters. This paper presents a study that aims at developing a framework for optimizing the planning of construction detours. The main objectives of the study are to: 1) identify all the decision variables that affect the planning of construction detours; 2) quantify the impact of these decision variables on construction workers and daily commuters; and 3) implement a model based on shortest path formulation to identify the optimal alternatives for construction detours. The ultimate goal of this study is to offer construction planners with the essential guidelines to improve construction safety and reduce construction zone hazards, and a critical tool for selecting and optimizing construction zone detours.
INTRODUCTION Many commuter drivers have to go through traffic detours on a daily basis. Traffic detouring (also known as rerouting) is the process of forcing the through traffic to follow an alternative path to the usual path in order to promote the safety of construction workers, the safety of commuters and the efficiency of traffic flow. As such, the provided alternative path is usually selected to ensure the orderly movement of all road users on streets and highways throughout construction and work zones. In addition to construction zones, traffic detours are used for lane closures due to adverse weather conditions, road maintenance work, utility construction activities, among other reasons. Traffic detours are typically identified by warning signs, signals and indicators, including those on transport devices that guide commuters throughout the detour. Local authorities usually require construction planners to include detailed
traffic detour plans whenever construction work is expected to affect the traffic flow around the construction zone. The requirement of such traffic detours vary from one state to the other, and even between counties and cities within the same State. Most local authorities and municipalities pay the closest attention to make sure that detour signs are easily understood by both local residents who are familiar with the area, and daily commuters who are familiar with just the main traffic path. There are no specific guidelines for defining the path of the detour other than not to detour traffic into roads that are known to be at or exceeding road capacity (i.e., roads that failed to achieve the desirable level of service). The lack of guidelines and tools to help construction planners in selecting an efficient detour can lead to overlooking potentially good choices of available traffic detours. As such, there is a need for a system to specify detour guidelines and help construction planners in identifying optimal traffic routes that maximizes the safety of construction workers and commuters, while efficiently maximizing traffic flow. The main objective of this research is to develop guidelines and tools that can help construction planners select optimal traffic detour routes. Potentially, this could result in safer construction zones, reduce traffic jams and greenhouse gases, and offer better utilization of the available capacity in the entire traffic network
LITERATURE REVIEW Several studies have been conducted to evaluate the safety of highway construction zones in several locations in the United States. Harb concluded that work zones produce a significantly higher rate of crashes when compared to non-work zone locations (Harb 2009). Harb cited that motor vehicle crashes increase by 26% during construction or roadway maintenance in work zones (Harb 2009). Anderson et al. introduced the concepts of assignment, transshipment, and shortest route problems. They categorized traffic rerouting problems under a category of liner programming named network flow problems. The network model for such problems consist of nodes and arcs (Anderson et al. 2007). Focusing on shortest route problems, they considered the main objective for such problems is to find the shortest path or route between two nodes of the network. This can also be expressed as a transshipment problem with one origin and one destination. By transporting one unit from one point (the origin) to another point (the destination), the solution is determined by finding the shortest route through the network (Anderson et al. 2007). Radwan discussed the advantages of utilizing new techniques for tackling traffic incidents, whether these incidents are natural such as hurricanes and floods or manmade such as road construction and car accidents. Radwan emphasized the importance of having a good detour around the incident location (Radwan 2003). Snelder et al. described how a disturbance of even a small section of a network can cause a major disruption to that network as a whole, making it vulnerable and easy to all types of traffic problems, including congestions and delays. They developed a methodology to analyze the specification of the design standards, analyze the road network and test the quality of the network. The developed methodology is reported to improve the network by decreasing the travel time by 2.3% and decreasing the lost time in case of accident by 29%. Moreover, the average speed is reported to have increased by 1.6% (Snelder et al. 2009).
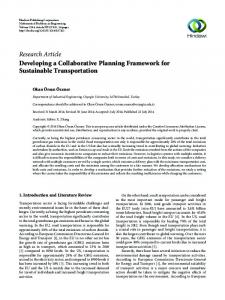
DECISION VARIABLES AND OBJECTIVES This study assumes that the various optimization objectives of planning detours could be accumulated in a cost function. As such, minimizing the total cost of a route is suggested to be the overall optimization objective and criterion to compare among the possible alternative detour routes, as shown in Eq. 1. Considering the total cost of a route is a concept that should help not only with saving the daily commuter time, but also with considering and reducing transportation costs, carbon fuel consumption, and greenhouse gases. As such, this should ultimately help to provide the most economic and sustainable detour alternative. Min: (Total Route Cost = Σ Objective Cost) Eq. 1 Shortest Path Model
Yes
Find Capacity for each link (C)
Min. Time
No
From H.C.M.
Find Volume for each link (V)
Min. Cost
No
Physical Count
Yes Find Free Travel Time for each link (tf) Physical Measurement
Find Capacity for each link (C) From H.C.M.
Calculate Actual Travel Time for each link (t(v)) Function of C, V, tf
Create Time matrix Time between couple of nodes
Min. Distance
Find Volume for each link (V)
Yes Find Traveling Distance Using GIS Software e.g. Google Earth or Mappoint
Physical Count
Find Free Travel Time for each link (tf)
Create Distance matrix Distance between couple of nodes
Physical Measurement
Calculate Actual Travel Time for each link (t(v)) Function of C, V, tf
Calculate Travel Cost for each link Function of t(v)
Create Cost matrix Cost between couple of nodes
No
Apply Shortest path method on the available data
Get optimal Detour
End
Figure 1: Optimization Model Formulation Alternatively, traveling time could also be selected as a design criterion. According to the community and the commuter needs, the construction planner could select either of these two criteria as a detour planning criterion (See Figure 1). Note that the selection criteria dropped the distance as a factor as it could be a deceiving factor.
Network Representation In order to select the optimal solution, a mechanism for identifying all available alternatives should be developed. The traffic network segments are represented by nodes and arrows. Then they are all compiled into a single matrix to represent the travel time or cost and allow the software to select feasible routes.
Formulating Shortest Path Problem To select the optimal solution, a modification to the shortest path formulation is proposed. This method is based on sending a single unit of flow from one node (e.g. node 1) to a destination node (e.g. node m) at the least possible cost/time (Bazaraa 1990). The mathematical formulation of the problem could be described as follows: Minimize
, Subject to
The summation is taken over the existing arcs of the network. The constant x ij (which is equal to 0 or 1) indicates whether an arc is in path or not.
APPLICATION EXAMPLE To better understand the concept of Total Route Cost, an application example is given on a construction zone within the city of Orlando. It noticed that many daily commuters who work, and or study at Valencia Community College drive through the intersection of South Goldenrod Road (SR 551) and Lake Underhill Road. The common route for those commuters is first heading North on Goldenrod Road (SR 551) until reaching the intersection of Goldenrod Road (SR 551) with Valencia College lane (distance is 1 mile), then heading east on Valencia College lane (distance 2.1 miles) until reaching their destination which is Valencia Community College. The total distance of this route is 3.1 miles as illustrated in Figure 2.
Figure 2 Traditional commuter route showing the closed Link
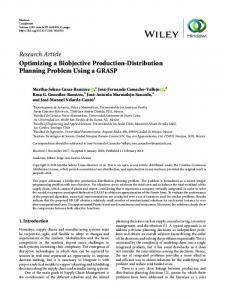
Figure 3 Marginal Cost Curve above Standard BPR (Data from Kockelman 2004)
To formulate the shortest path model for this problem, part of the East-West section (link) of the daily commuter route of Figure 1 is closed, as shown in Figure 2. The closed section or link is the link from the beginning of Valencia College Lane until the intersection of Valencia College Lane with North Chickasaw Trail. This link is considered a critical link in the daily commuter route, since passing through it is a must for the daily commuter to reach the destination. Closing this link is expected to generate substantial disturbance to the network. The length of the closed link is
approximately half a mile, as illustrated in Figure . In order to close this section of the daily commuter route, realistic alternative routes are sought and examined using the modified shortest path formulation. These realistic alternatives are evaluated and assessed based on the optimization objective (cost or time) to find the most feasible alternative route for the original common route. It should be noted that when it comes to economic feasibility, usually a comparison is conducted between the cost of blocking the whole road for a shorter total duration, and the cost of partially blocking the road for a relatively longer duration. While the former allows faster completion of road construction tasks, the latter requires less detour planning. In addition to these costs, the cost of delay due to construction should be considered in assessing the alternatives and selecting the best solution. Moreover, the social value of delay and how much a daily commuter is willing to pay to avoid going through traffic congestion must be precisely estimated in terms of time and money. Since the travel time per unit distance is an inverse function of the speed, delays are expected to noticeably increase as the speed goes down. Also with reduced speeds, density rises as more and more users enter the congested zone, reducing inter-vehicle spacing and causing the speed to fall to almost zero. It has been reported that the travel times tend to rise exponentially as a function of demand for the scarce road space, as illustrated in Figure 3. In this study a formula developed by the Bureau of Public Roads (BPR) is used to calculate the common travel time (FHWA 1979), as shown by the following equation..
Where, V is the traffic volume; C is the practical capacity, corresponding to approximately 80 percent of the true capacity; t(V) is the actual travel time, as a function of demand volume V; and tƒ is the free-flow travel time.
DATA COLLECTION Data was collected on nine different locations. These nine locations are considered critical points that commuters have to pass by in order to take one of the alternative routes. The data was collected on regular days for three consecutive hours and was analyzed on a 15-min basis in order to provide precise results and more extensive information. The analysis also identified the peak hour precisely. Figures 4-9 illustrate the realistic routes that can be taken by daily commuters to avoid the construction zone. Route “A” starts similar to the original route by heading north approximately 0.35 miles on FL-551 (Goldenrod Road), then turning right to merge onto FL-408 E toward Titusville a distance of approximately 0.7 miles. The route continues by merging slight left at Central Florida Greenway/Eastern Beltway/Florida 417 north, a distance approximately 0.4 miles, then taking the Valencia College Lane exit, a distance of approximately 0.3 mile, and then finally turning right at Valencia College Lane for a distance of approximately 1.0 mile to arrive at Valencia Community college. The expected travel time on this route is approximately 4 minutes. The main advantage of this route is its shortest distance and time. On the other hand, the main
disadvantage of this rote is its cost since it requires the commuter to take a toll road, as illustrated in Figure 4. Route B starts by having the commuter head east on Lake Underhill Rd toward S Chickasaw Trail for a distance of approximately 2 miles, before turning left at S Econlockhatchee Trail until reaching the main entrance of Valencia community college at Valencia College Lane. The main advantage of this route is the distance, since this route is consider the second shortest route in terms of distance. The main disadvantage for this route is the existence of a critical facility (a hospital), as illustrated in Figure 5.
Figure 4 Route “A” alternative
Figure 5 Route “B” alternative
Route C starts similar to the original route by heading north on FL-551 (Goldenrod Road) for approximately 2.0 miles, then turning right at FL-50 E/E Colonial Drive for a distance of 0.5 mile, then turning right at north Chickasaw Trail for one mile, and finally back on the original route by turning left on Valencia College lane for approximately 1.7 mile. This route takes the daily commuter a total time of 12 minutes from point A, the intersection of Lake Underhill Road with Goldenrod Road, until reaching the final destination, Valencia Community College. The main disadvantage of this route is that the time is almost tripled compared to the time on the original route. This route is illustrated in Figure 6. Route D starts by heading north on FL-551 (Goldenrod Road) for approximately 2.0 miles, then turning right at FL-50 E/E Colonial Drive for a distance of 2.0 miles, then turning right at north Econlockhatchee Trail for distance of 1 mile. This route takes about 11 minutes to complete and it is illustrated in Figure 7.
Figure 6 Route “C” alternative
Figure 7 Route “D” alternative Route E begins by first heading south on FL-551 (Goldenrod Road) for approximately 1.7 miles, then turning left at Curry Ford Road, driving for distance of 2.1 miles, before turning left at S Econlockhatchee Trail for 3.1 miles and then finally turning right at Valencia College Lane. It takes approximately 17 minutes on this route with a total distance of 7.2 miles, as illustrated in Figure 8.
Route F starts similar to route E but passes through Chickasaw Trail instead of Econlockhatchee Trail. The direction for this route begins by first heading south on FL-551 (Goldenrod Road) for approximately 1.7 miles then turning left at Curry Ford Road, driving for a distance of 1.4 miles, before turning left at S Chickasaw Trail for approximately 1.0 mile, then turning left at El Prado Avenue for 0.4 mile. The route continues onto S Chickasaw Trail for another 1 mile, and ends by finally turning left at S Econlockhatchee trail, arriving to the final destination. This route takes approximately 16 minutes to complete and it is illustrated in Figure 9.
Figure 8 Route “E” alternative
Figure 9 Route “F” alternative
ANALYSIS AND PRELIMINARY RESULTS As mentioned above, in order to have the most accurate results, data was collected at nine different locations. The primary objective of collecting the data is to determine traffic volumes and levels of service in order to select the best alternative solution. As shown from the discussion of the six alternatives illustrated in the above section, the problem involves optimizing a number of objectives (e.g. distance, travel time, direct cost, safety…etc.) The complexity of the problem increases with the consideration of all the available local routes as the number of alternatives in such a case could be hundreds. The complexity also increases with the need for a method to identify all the possible alternative routes. To deal with multiple objectives, a cost (or utility) function could be defined to combine the effect of the considered objectives. As such, customized software could then be developed to aid construction planners in selecting the most optimal alternative. The framework for solving such an optimization problem is based on the concepts discussed below.
Peak Hour Costs Analyzing the collected data to find peak hour is a critical step in building the optimization model. This is important so that the planner would have the flexibility to vary the cost of delay according to the traffic demands and the busiest time of the day. According to the collected data, the peak hour is estimated to be between the hours of 7:00 am and 8:00am.
Highway Capacity and Level of Service The desired level-of-service (LOS), or quality of the connections in the network, is yet another factor that should be considered. An acceptable Volume-capacity ratio
(capacity) is needed as a prerequisite to determine the LOS (see Table 1). It is also recommended to consider the capacity as a separate measure (Kockelman 2004). Table 1 Level of Service Definition for Basic Freeway Segments (TRP 2000)*
*Calculation for the Level of Service (LOS) is composed of the following steps: (1) Calculation of FFS, (2) Determination of Flow Rate, and (3) Calculation of LOS.
CONCLUSION Implementation factors such as driving costs, critical facilities, school zones, peak time, highway capacity and level of service, affect the selection of optimal detour routes around construction zones. A framework for optimizing construction detours has been proposed in order to take these factors into account when developing detour plans. The framework is based on combining the effect of these factors into a cost function and using a modified shortest path formulation to determine the optimal routes. The formulation considers each objective to have a certain cost (utility) that could be determined by the user in order to evaluate the overall quality of the solution. This should prove useful to construction planners as it can help them identify the optimal construction detour around construction zones.
REFERENCES Bazaraa, M. S. (1990). Liner Programming and Network Flows, John Wiley & Sons, New York. Anderson, D. R., Sweeney, D. J., Williams, T. A., and Martin, R.K. (2007). An Introduction to Management Science: Quantitative Approaches to Decision Making, Thomson/South-Western. FHWA (1979). Urban Transportation Planning System (UTPS), Federal Highway Administration, Washington, DC. Harb, R. (2009). Safety and Operational Evaluation of Dynamic Lane Merging in Work Zones, PhD Dissertation, University of Central Florida, Orlando, FL. Kockelman, K. (2004). Traffic Congestion. Handbook of Transportation Engineering. M. Kutz. McGraw- Hill, New York. Radwan, E. (2003). Framework for Modeling Emergency Evacuation. University of Central Florida, Center for Advanced Transportation Systems Simulation, and Florida Department of Transportation, Orlando, FL. Snelder, M., Schrijver J. M., Immers, L. H., Egeter, B. (2009). "Designing Robust Road Networks," Report no. 09-2718, the 88th Annual Meeting of the Transportation Research Board, Washington, DC. TRP (2000). Highway Capacity Manual: 2000 Washington, D.C, Transportation Research Board, Washington, DC.