2010 Second International Conference on MultiMedia and Information Technology
A Graph Indexing Approach for Content-Based Recommendation System Tao PENG, Wendong WANG, XiangYang GONG, Ye TIAN
XiaoGang YANG, Jian MA Nokia Beijing Research Center Beijing, China
State Key Laboratory of Networking and Switching Beijing University of Posts and Telecommunications Beijing, China e-mail:
[email protected] Abstract—Conventional content-based recommendation systems use different classifying algorithms to group items into several groups and for each group generate a ranking list of items. An important characteristic of conventional contentbased recommendation systems is that they use the same ranking list to make recommendations for items in each group, ignoring differences among items inside of a group. The paper proposes a content-based recommendation system built on top of a weighted un-directional graph. The graph describes the content similarity between items based on the semantic relations of their metadata. Neighbors of a node in the graph construct a ranking list of items to be recommended and there is a ranking list for each item. So it is able to emphasize differences among related items. We developed a prototype of the proposed system in Kaleido Photo project, and it proves to be sufficient to recommend most similar photos according to what the user is viewing. Keywords- Graph Indexing; Content-Based Recommender System; Semantic Relations; Feature Similarity
I.
INTRODUCTION
Nowadays, as the explosion of information, recommendation systems are playing a more and more important role in our daily life. Most recommendation systems fall into three categories [1]: content-based recommendation systems, collaborative filtering recommendation systems and hybrid of the two. Contentbased recommendation systems recommend items similar to the ones users previously chose. Collaborative filtering recommendation systems make recommendations based on what people with similar tastes and preferences liked in the past. Hybrid recommendation systems combine contentbased and collaborative methods. Conventional content-based recommendation systems usually use classifying algorithms such as Bayesian classifier to group items into different groups and generate a ranking list for each group [2]. The ranking lists are used to make recommendations for items in the group. Recommendations for items in the same group are the same. So difference between items in the same group is omitted.
978-0-7695-4008-5/10 $26.00 © 2010 IEEE DOI 10.1109/MMIT.2010.84
In the meantime, graph indexing is getting attention in the content-based information retrieval area [3]. Contentbased recommendation systems have their roots in contentbased information retrieval. Semantic relation of item metadata is considered to be used to calculate the similarity between items [4]. And semantic graph indexing has already been considered as an efficient information retrieval technique [5]. In the paper, we propose a content-based recommendation system built on top of a weighted undirectional semantic relation graph. The graph describes the similarity between items based on the semantic relations of their metadata. Each node in the graph represents an item in the system. Neighbors of a node in the graph construct a ranking list of items to be recommended. There is a ranking list for each item in the graph. So the proposed system is able to make recommendations for all items, and difference of all items is also addressed. We also developed a prototype of the proposed recommendation system in Kaleido Photo project. Kaleido Photo project aims at improving the quality of photo sharing service for mobile device users. The rest of the paper is divided into four parts to explain the system in details. In Section 2, we present the system architecture. Then we describe how we build the semantic relation graph index in Section 3, and how recommendations are made in Section 4. Then in Section 5, we present a performance evaluation using precision and recall metrics. Finally, we conclude our work and describe the future work in Section 6. II.
SYSTEM OVERVIEW
This section describes the architecture of the proposed content-based recommendations system. We also discuss the key parts of the system, as well as some related methods. Figure 1 depicts the architectural design of the proposed system. It consists of three major components. The system is driven by user-supplied items. Generation of semantic relation graphs needs to read a lot of data from the metadata database. To reduce impact on the performance of the main item metadata database, we use a replica database that duplicates all metadata from the main metadata database, and build relation graphs from the replica database. 93
Authorized licensed use limited to: BEIJING UNIVERSITY OF POST AND TELECOM. Downloaded on June 23,2010 at 07:20:12 UTC from IEEE Xplore. Restrictions apply.
The single dimensional graph builders are a collection of relation graph builders. Each relation graph builder builds a semantic relation graph based on one item metadata attribute. The relation graph is an un-directional weighted graph. Each node of the graph represents an item in the system. The similarity of two nodes’ metadata attribute determines the weight of the line connecting them. Therefore the graph is able to describe the similarity of a single metadata attribute between all items in the system. We define the weight wij of the line connecting item Pi and Pj as
wij = ω ( Ai, Aj ) f ( Ai, Aj )
(1)
where n is the number of item metadata attributes, and ω is the weight given to the similarity in value of attribute Ak between two items Pi and Pj . The definition of f depends on the type of attribute we passed in. Similar as in [6], we normalize f to have value in [0, 1]. In the next section, we will discuss how we determine ω and f in details. We implemented a prototype of the proposed system in Kaleido Photo project. The Kaleido Photo project deployment is drawn in Figure 2, where clients communicate with the server via WIFI or mobile networks. We also set up a testing environment as shown in Figure 3.
where Ai and Aj are the corresponding metadata attribute. And we define ω as the weight function determined by the similarity of Ai and Aj . The graph index fusing component combines all graphs generated by the single dimensional graph builders. The component does this by adding each line in the graphs to corresponding nodes. If the line exists, add the weight of new line to the original line. The output graph is still an undirectional weighted graph but it now describes semantic relations of all metadata attributes between items.
Internet Tablets
Kaleido Photo Server
WIFI Router
Public Internet
Cell Phone
WIFI Router
Users Uploading Items GSNs
Internet Tablets
Content-Based Recommendation
GSM Internet Tablets
Base Stati on
Recommendation Matching/Dispatching
Cell Phone
Graph Index Fusing
Index DB
Base Stati on
Figure 2. Example of Prototype System Deployment
Single Dimensional Relation Graph Builders
Location Relation Graph Builder
Time Relation Graph Builder
Author Relation Graph Builder
Internet Tablets
Event Relation Graph Builder
WIFI Router
LAN
Item Metadata Replica DB
Database Replication
Internet Tablets
WIFI Router
Main Item Metadata DB Kaleido Photo Server Internet Tablets
Figure 1. Proposed System Architecture.
In the semantic relation graph generated by this component, the similarity of two items is ranked by the weight of the line connecting them. We define the weight W of the line is defined between two nodes Pi and Pj as n
W (Pi, Pj) = ∑ ω ( Aik , Ajk ) f ( Aik , Ajk )
(2)
Figure 3. Testing Environment
III.
GENERATING SEMANTIC RELATION GRAPH INDEX
In this section, we illustrate the proposed system in details based on our prototype implementation in Kaleido Photo project.
k =1
94
Authorized licensed use limited to: BEIJING UNIVERSITY OF POST AND TELECOM. Downloaded on June 23,2010 at 07:20:12 UTC from IEEE Xplore. Restrictions apply.
A. Single Dimensional Relation Graph Generation Here we explain the single dimensional relation graph builder by using time attribute of photos as an example. Other single dimensional relation (e.g. location, author, event, etc.) graphs are calculated similarly. To generate a single dimensional relation graph using (1), we need to define ω and f for each metadata attribute. Table I is a collection of definitions of f we used in our prototype implementation. For each metadata attribute, we choose a granularity and group photos into several collections to forms different single attribute hierarchies. Photos in the same hierarchy are considered similar to each other. And the lower group two photos belong to, the more similar they are considered, and thus the higher weight value ω is given to the line connecting them in the single dimensional relation graph. TABLE I.
All photos belonging to the same group are considered to have the same similarity between each other. Photos in the leaf group in the hierarchy are most related in time. So they are given larger ω in (1). Photos belonging to the same upper group but to the same leaf group are considered less relative and thus the function ω in (1) returns a smaller value for them. For example, in Figure 4, photos in the leaf group 2009-June-9 have the similarity weight of 10. Then a photo pair, one in 2009-June-15 group and the other in 2009June-9 group could have a similarity weight of 5. And other pair, one in 2009-June-15 and the other in 2009-July-13 could have a similarity weight of 2.
METADATA ATTRIBUTES USED IN PHOTO RECOMMENDATION
Attributes
Type
Domain
Taken Time Upload Time Location
Year Year String
YYYY YYYY
GPS Author Event
Double String String
,
Emotion
String
Collections
Tags
String
Collections
Distance Measure Y1 == Y2 ? 1 : 0 Y1 == Y2 ? 1 : 0
| L1 ∩ L 2 | L max |G1 – G2| > 10 ? 0 : 1 A1 == A2 ? 1 : 0
| E1 ∩ E 2 | E max | E1 ∩ E 2 | E max | T1 ∩ T 2 | T max
For example, in time dimension, we first choose a granularity of a day to group photos. Photos are then grouped into several collections and form a time hierarchy like Figure 4. We use this kind of hierarchy to determine the similarity of between photos. Photos in the same leaf group as well as in the same upper group are considered to be similar to each other. So the function f returns 1 for them in (1).
Figure 5. Example of Semantic Relation Graph for Time Attribute
After calculating the time relation between all photos, we have a semantic relation graph similar to Figure 5 for time attribute. In Figure 5, each node Pi in the graph represents a photo in the system and the weight of a line wi is the semantic similarity we calculated by time attribute for the two photos. As we can see in Figure 5, the single dimensional relation graph is constructed by several fully connected sub-graphs, because not all photos in the system are time-dimensionally related. Each sub-graph can be stored in a matrix like:
Stime _ i
where
⎡0 w1 ⎢ w1 0 =⎢ ⎢ ⎢ ⎣ wj
wj ⎤ wk ⎥⎥ ⎥ ⎥ 0⎦
(3)
S time _ i is the ith sub-graph for time relation graph
and w is the weight of lines between nodes in the graph calculated using (1). B. Full Semantic Relation Graph Generation After calculating single dimensional relation graphs for all metadata attributes, we have a matrix similar to (3) for each attribute. We then sum up all the matrices to form a relation matrix for all photos in the system using (4).
⎡0 W 1 ⎢W 1 0 Sn = ⎢ ⎢ ⎢ ⎣Wn
Figure 4. Example of Time Groups Hierarchy
Wn ⎤ Wk ⎥⎥ ⎥ ⎥ 0⎦
(4)
95
Authorized licensed use limited to: BEIJING UNIVERSITY OF POST AND TELECOM. Downloaded on June 23,2010 at 07:20:12 UTC from IEEE Xplore. Restrictions apply.
where Sn is the relation matrix for all photos in the system. And W is calculated by summing up all corresponding weight found in each single dimensional relation graph. Note that W here also agrees with (2), where weight of a line is the sum of all corresponding lines in single dimensional relation graph. Sn is used to store the full semantic relation graph we want to generate. And an example of such a graph is given in Figure 6.
of photo IDs can be found as
ranking list like
3,2,4,6 . According to the similarity
ranking list, we can make recommendations in the order of photo ID 3, 2, 4 and 6. V.
MAKING RECOMMENDATIONS
This section explains how recommendations are made in the proposed system. After calculating the semantic relation graph in the previous section, we can save the graph in the index database. And each photo’s unique id in the system is used as an identifier to the corresponding node in the graph. The process is illustrated in Figure 7.
P2
2,3,4,6 . Then we sort the
list by the weight of lines connecting them to P1. If we assume w5 > w4 > w6 > w13 , we can have a similarity
PERFORMANCE EVALUATION
To order to evaluate the performance of the prototype implementation, we conduct a data set that we collected in our internal software trial, from which more than 5000 photos are selected, and 8 kinds of metadata attributes are considered. Precision and recall are the most popular metrics for evaluating information retrieval systems. They are used to evaluating recommender systems too [7]. Precision is defined as the ratio of relevant item selected to number of items selected, shown in (5) [8]. Precision represents the probability that a selected item is relevant.
Figure 6. Example of Full Semantic Relation Graph
IV.
can find that P2, P3, P4 and P6 are connected to P1. So a list
P=
P5
P1
(5)
where Nrs is the number of real relevant items recommended by the system, and Ns , is the number of items recommended by the system. Recall, shown in (6), is defined as the ratio of relevant items selected to total number of relevant items available. Recall represents the probability that a relevant item is selected.
P=
w4 w1
Nrs Ns
w9
Nrs Nr
(6)
w13 w2 w7
P6
w6
w5
w10
w11
P3
w8
P7
w12
P4
Figure 7. Example of Photo_id-Graph_node Mapping
We make recommendations based on what a user is viewing. So we are told the ID of the photo that a user is currently viewing. We then find the node in the semantic relation graph corresponding to the given photo ID and mark it as a temporary root. Now we are able to find a list of photo IDs whose corresponding node is connected to the root. Then we sort the ID list decreasingly by the weight of the line connecting them to the root. Recall that the weight of a line in the graph represents the similarity of the two photos. So the sorted ID list is a similarity ranking list and our recommendations are from top to bottom in the list. For instance, in Figure 7, if a user is viewing photo 1, we first map photo 1 to node P1 in the semantic graph. Then we
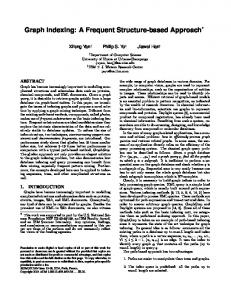
where Nrs is the number of real relevant items recommended by the system, and Nr , is the number of relevant items in the system. Table II shows our test results of precision and recall metrics, using different number of photos as input data set. Overall, the results are very good even when given data set is relatively small. The performance of the proposed system improves quite quickly as the number of input photos are increased. TABLE II.
SUMMARY OF PRECISION AND RECALL RESULTS
Number of photos 50 100 200 500 1000 2000 5000
Precision 0.786 0.846 0.886 0.901 0.908 0.920 0.925
Recall 0.815 0.898 0.918 0.938 0.939 0.941 0.942
96
Authorized licensed use limited to: BEIJING UNIVERSITY OF POST AND TELECOM. Downloaded on June 23,2010 at 07:20:12 UTC from IEEE Xplore. Restrictions apply.
precision
Precision and recall of the tests results are also drawn in Figure 8 and Figure 9, from which we can see the performance of the proposed system stays high and stable when dealing with large number of photos. 1 0.9 0.8 0.7 0.6 0.5 0.4 0.3 0.2 0.1 0
ACKNOWLEDGMENT 0
500 1000 1500 2000 2500 3000 3500 4000 4500 5000 5500 Number of Photos
Figure 8. Tests Results Precision
Recall
a user is viewing. The graph indexing approach is also feasible for other recommendation systems used in online videos sharing sites like Youtube [9] and online book stores like Amazon [10]. A potential risk of the graph indexing approach is that, for very large-scale item-sets, the process of semantic graph index generation might be slow, because it costs too much CPU time and memory bandwidth. A distributed computing environment like the Hadoop project [11] is considered as a good solution, which may also be the next step of the Kaleido Photo project.
1 0.9 0.8 0.7 0.6 0.5 0.4 0.3 0.2 0.1 0
This paper is partly supported by the BUPT-NOKIA Joint Project, National High-Tech Research and Development 863 Program of China (2007AA01Z206, 2009AA01Z210), the National Basic Research 973 Program of China (2009CB320504). REFERENCES [1]
0
500 1000 1500 2000 2500 3000 3500 4000 4500 5000 5500 Number of Photos
Figure 9. Tests Results Recall
VI.
CONCLUSION AND FUTURE WORK
In this paper, we propose a content-based recommendation system based on a semantic relation graph. Firstly, for each item metadata attribute, we group items into several collections to form a single-attribute-similarity hierarchy. Then we create single dimensional relation graph on the basis of the collection hierarchy. Secondly, we superimpose all single dimensional relation graphs into a full semantic relation graph, which describes the metadatasemantic relations of all items. Thirdly, we explain how we make recommendations based on the full semantic relation graph and give an example to illustrate the process. We have implemented a prototype of the proposed recommendation system in Kaleido Photo project. Test results show that the graph indexing approach can fast and efficiently recommend relevant photos based on which photo
G. Adomavicius and A. Tuzhilin. Toward the Next Generation of Recommender Systems: A Survey of the State-of-the-Art and Possible Extensions. IEEE Transactions on Knowledge and Data Engineering. Piscataway, NJ, USA, 2005, pp.734-749. [2] R.J. Mooney and L. Roy. Content-Based Book Recommending Using Learning for Text Categorization. Proceedings of the SIGIR-99 Workshop on Recommender Systems: Algorithms and Evaluation. Berkeley, CA, USA, 1999. [3] S. Berretti, A.D. Bimbo, and E. Vicario. Efficient Matching and Indexing of Graph Models in Content-Based Retrieval. IEEE Transactions on Pattern Analysis and Machine Intelligence. Washington, USA, 2001, pp. 1089-1105. [4] Y. Wang, N. Stash, L. Aroyo, L. Hollink and G. Schreiber. Semantic Relations in Contentbased Recommender Systems. http://www.cs.vu.nl/~guus/papers/, 2009. [5] X. Yang, Y Tian, T. Peng, C Chen, J. Ma. Semantic-Based Graph Index for Mobile Photo Search. The 2nd International Workshop on Education Technology and Computer Science, ETCS 2010, in press. [6] S. Debnath, N. Ganguly and P. Mitra. Feature Weighting in Content Based Recommendation System Using Social Network Analysis. WWW 2008. Beijing, China. 2008. [7] Z. Zaier, R. Godin and L. Faucher. Evaluating Recommender Systems. International Conference on Automated solutions for Cross Media Content and Multi-channel Distribution. 2008. [8] L. J. Herlocker, A. J. Konstan, G. L. Terveen, and T. J. Riedl. Evaluating collaborative filtering recommender systems. ACM Transactions on Information Systems, Vol. 22, pp. 5-53, 2004. [9] http://www.youtube.com/ [10] http://www.amazon.com/ [11] http://hadoop.apache.org/
97
Authorized licensed use limited to: BEIJING UNIVERSITY OF POST AND TELECOM. Downloaded on June 23,2010 at 07:20:12 UTC from IEEE Xplore. Restrictions apply.