Mar 2, 2012 - map; Mrs. Janelle Malone for editorial input; and lab members, in- cluding Yiwen .... Remington, D. L., R. W. Whetten, B. H. Liu, and D. M. O'Malley, ... Schmer, M. R., R. B. Mitchell, and R. K. Perrin, 2008 Net energy of cellu-.
INVESTIGATION
A High-Density Simple Sequence Repeat-Based Genetic Linkage Map of Switchgrass Linglong Liu, Yanqi Wu,1 Yunwen Wang,2 and Tim Samuels Department of Plant and Soil Sciences, Oklahoma State University, Stillwater, Oklahoma 74078
ABSTRACT Switchgrass (Panicum virgatum) has been identified as a promising cellulosic biofuel crop in the United States. Construction of a genetic linkage map is fundamental for switchgrass molecular breeding and the elucidation of its genetic mechanisms for economically important traits. In this study, a novel population consisting of 139 selfed progeny of a northern lowland genotype, NL 94 LYE 16X13, was used to construct a linkage map. A total of 2493 simple sequence repeat markers were screened for polymorphism. Of 506 polymorphic loci, 80.8% showed a goodness-of-fit of 1:2:1 segregation ratio. Among 469 linked loci on the framework map, 241 coupling vs. 228 repulsion phase linkages were detected that conformed to a 1:1 ratio, confirming disomic inheritance. A total of 499 loci were mapped to 18 linkage groups (LG), of which the cumulative length was 2085.2 cM, with an average marker interval of 4.2 cM. Nine homeologous LG pairs were identified based on multi-allele markers and comparative genomic analysis. Two clusters of segregationdistorted loci were identified on LG 5b and 9b, respectively. Comparative analysis indicated a one-to-one relationship between nine switchgrass homeologous groups and nine foxtail millet (Setaria italica) chromosomes, suggesting strong homology between the two species. The linkage map derived from selfing a heterozygous parent, instead of two separate maps usually constructed for a cross-fertilized species, provides a new genetic framework to facilitate genomics research, quantitative trait locus (QTL) mapping, and markerassisted breeding.
Switchgrass (Panicum virgatum L.) is one of the dominant C4 perennial species present in the North American tall grass prairies. Its natural habitat extends to a larger geographic span between about 15 and 55 degree north latitudes (Hitchcock 1951). According to gross morphology and habitat preference, switchgrass is classified mainly into lowland and upland ecotypes (Porter 1966). Lowland plants are tetraploid (2n = 4x = 36 chromosomes), whereas uplands include both tetraploid and octoploid plants (2n = 8x = 72) (Hopkins et al. 1996). Copyright © 2012 Liu et al. doi: 10.1534/g3.111.001503 Manuscript received October 30, 2011; accepted for publication January 16, 2012 This is an open-access article distributed under the terms of the Creative Commons Attribution Unported License (http://creativecommons.org/licenses/ by/3.0/), which permits unrestricted use, distribution, and reproduction in any medium, provided the original work is properly cited. Supporting information is available online at http://www.g3journal.org/lookup/ suppl/doi:10.1534/g3.111.001503/-/DC1 2 Present address: Department of Grassland Science, College of Animal Science and Technology, China Agricultural University, Beijing 100193, People’s Republic of China. 1 Corresponding author: Department of Plant and Soil Sciences, Oklahoma State University, 368 Ag Hall, Stillwater, OK 74078-6028. E-mail: yanqi.wu@okstate. edu
KEYWORDS
linkage map simple sequence repeat (SSR) selfed progeny switchgrass
Aneuploidy is common in both lowland and upland plants, although octoploid upland plants have more aneuploidy incidences than tetraploid accessions (Costich et al. 2010). Molecular marker investigations have revealed enormous genetic diversity within the species (Gunter et al. 1996; Narasimhamoorthy et al. 2008; Zalapa et al. 2011; Zhang et al. 2011). Switchgrass is a tall growing and resilient species. Its genetic diversity has historically been used for soil conservation, forage production, game cover, and as an ornamental grass. More recently, it has been selected as the model herbaceous species for use as a dedicated bioenergy feedstock crop (McLaughlin and Kszos 2005). Switchgrass is listed as one of the major biomass energy crops in the Billion-Ton Update report (U.S. Department of Energy 2011). In a farm-scale study of switchgrass grown as a biomass energy crop on marginal cropland, Schmer et al. (2008) reported switchgrass produces 540% more energy than the energy used for producing its cellulosic feedstock. They estimated greenhouse gas emissions from converting switchgrass feedstock to ethanol were 94% lower than that from gasoline. Switchgrass has received substantial attention and has the potential to be genetically improved for higher biomass production along with other important agronomic traits that can add value to its use as a biofuel feedstock in breeding programs.
Volume 2 |
March 2012
|
357
Switchgrass is a wind pollinated and largely self-incompatible species (Talbert et al. 1983; Taliaferro et al. 1999; Martinez-Reyna and Vogel 2002). Because of this sexually out-crossing mode of reproduction, all released cultivars were populations composed of genetically heterozygous individuals. Recently released switchgrass cultivars were primarily developed using recurrent selection procedures (Vogel et al. 2011). Those breeding and selection protocols are effective but require a lengthy time period to develop new cultivars. Consequently, genetic gains per year are relatively low (Vogel and Pedersen 1993). Molecular tools and genomic information are limited in switchgrass and need to be developed. These new and quickly evolving technologies have extensive potential if incorporated into and coupled with conventional genetic improvement and breeding programs for developing superior cultivars. Molecular markers have been developed to investigate inheritance in the species and facilitate the construction of genetic linkage maps. These maps are fundamental for switchgrass breeding through markerassisted selection and elucidation of the genetic mechanisms for economically important traits. The first linkage maps were constructed with 102 restriction fragment length polymorphism (RFLP) single dosage markers (Missaoui et al. 2005). The markers are distributed in eight homology groups covering over 400 cM. Developing microsatellites or simple sequence repeat (SSR) markers, which are tandem repeats of short (1 to 6 bp) DNA sequences, has gained substantial attention in switchgrass (Tobias et al. 2005, 2008; Wang et al. 2011). The desirable features of SSR markers include their easy use, high information content, codominant inheritance pattern, even distribution along chromosomes, reproducibility, and locus specificity (Kashi et al. 1997; Röder et al. 1998a,b). A pair of genetic maps using SSRs scored as single dosage markers has been developed in switchgrass (Okada et al. 2010). These maps covered, respectively, 1376 and 1645 cM of 18 linkage groups that are expected to represent the full set for a tetraploid genome. Okada et al. (2010) reported that the two tetraploid switchgrass parents had complete or near-complete disomic inheritance. Marker-assisted selection is more efficient when molecular maps are well saturated, as high-density maps provide increased opportunities for detecting polymorphic markers in genomic regions of interest. Linkage maps developed using different genetic backgrounds are needed to better understand inheritance in the species. Linkage maps constructed from different populations will enhance the understanding of the genome structure and gene interaction (Semagn et al. 2010). Two full-sib F1 populations were used to construct previously published maps (Missaoui et al. 2005; Okada et al. 2010). The F1 full-sib populations were made by crossing two selected heterozygous parental plants. NL94 LYE 16x13 (abbreviated as NL94) is a self-compatible genotype selected from a breeding nursery of the OSU northern lowland population formed using Kanlow and other germplasm (Liu and Wu 2011). Selfing NL94 and other self-compatible lowland plants can produce promising inbred lines that offer numerous advantages in breeding, especially for utilizing heterosis by crossing selected heterotic inbreds. We have developed an inbred population from NL94 (Liu and Wu 2011). Accordingly, the major objective of this study was to construct a more saturated SSR-based linkage map using the inbred progeny population. This map would provide a new genetic framework to study associations of molecular markers and agronomic traits of interest.
MATERIALS AND METHODS Plant materials and the selfed mapping population The mapping population was recently described by Liu and Wu (2011). Basically, the mapping population consisted of 139 individuals
358 |
L. Liu et al.
randomly selected from 279 inbreds derived by selfing NL94, which was identified as a typical tetraploid lowland ecotype (2n = 4X = 36) based on the detection of the 49 bp deletion in trnL-UAA intron (see supporting information, Figure S1), a special marker for switchgrass classification between lowland and upland (Missaoui et al. 2006). The decision to use 139 progeny was dictated by our genotype-detecting equipment, which enables the organization of the entire mapping population in two 66-well plates plus a small marker screening panel including seven individuals and the parent. DNA isolation and PCR amplification The genomic DNA for NL94 and its progeny plants was respectively isolated from healthy leaf tissues using the CTAB method (Doyle and Doyle 1990), with minor modifications as described by Liu and Wu (2011). To avoid allele dropout due to poor DNA quality, DNA samples with smear bands of A260/A280 less than 1.8 were extracted de novo. The working solutions were diluted to 10 ng/ml as PCR templates. SSR markers were amplified using selected primer pairs (PP; described in the next section) on Biosystems 2720 thermal cyclers (Applied Biosystems, CA), using the PCR reaction conditions as described by Wang et al. (2011). PCR products were separated using 6.5% KB plus polyacrylamide gel solution on a LI-COR 4300 DNA Analyzer (LI-COR Biosciences, Lincoln, NE). The band sizes of these amplified fragments of SSR markers were determined using Saga Generation 2 software, version 3.3 (LI-COR Biosciences). SSR markers and genotyping analysis A total of 2288 switchgrass SSR primer pairs were assembled from previous publications (Tobias et al. 2006, 2008; Okada et al. 2010; Wang et al. 2011). They were compared to each other using a specialized blast program called bl2seq in NCBI (www.ncbi.nlm.nih.gov/ BLAST/) designed to exclude redundancy. Non-redundant markers were then selected for polymorphism. In addition, 354 sorghum (Sorghum bicolor) SSRs from Wu and Huang (2006) were tested for their transferability in switchgrass varieties “Cave-in-rock” and “Alamo.” Of 189 foxtail millet (Setaria italica) nonredundant SSRs, 80 were taken from Jia et al. (2009) (a primer pair “b255” was excluded from their primer list due to the same primer sequences with “b225”), and the remaining 109 were kindly provided by Dr. A. Doust (Botany Department, Oklahoma State University). The markers were initially screened for informative segregation using a small screening panel. Polymorphic SSRs were used to genotype the first DNA panel of 66 individuals, and then those having stable, heritable, and reproducible markers were genotyped on the second panel of other 66 individuals. At last, the information from the small screening panel and the two 66-well panels was collected to represent the entire mapping population. The markers with greater than 10% missing data were genotyped again from those samples that did not have data in the previous genotyping runs. Marker scoring All codominant markers were scored using the same segregation pattern (,hkxhk.: locus heterozygous in the parent, two alleles). SSR-amplified fragments were encoded as “hh” (only one upper band), “hk” (two bands), and “kk” (only one lower band). For dominant loci, “h-” was scored for presence, and “–” for absence. In both scenarios, “u” was recorded as missing data; this included unclear or ambiguous bands. If a marker produced multiple bands with the same segregation profile but with different sizes, only two main bands were recorded as segregating alleles and the other bands were omitted as redundant information. However, in addition to these main bands, if those markers produced stable secondary bands with different
segregation profiles from the main bands, i.e. multi-allele markers, they were separately encoded by primer name, and the band size in the base pairs was used as a suffix for differentiating between them. All gel bands were manually scored by two independent people. Raw genotyping data are given in File S1. Segregation and linkage analysis Several segregation ratios are possible in the selfed progeny derived from a tetraploid plant with two segregating bands (Table S1). The goodness-of-fit between observed and expected Mendelian ratios was analyzed for each marker locus using a x2 test built in JoinMap 4.0 (Van Ooijen 2006). Markers that deviated from the theoretical expected ratios were considered distorted and were marked to indicate different significance levels (�P , 0.01, ��P , 0.001, and ���P , 0.0001). Linkage analysis was performed using JoinMap 4.0, and the outcross pollinated (CP) full-sib family was used as the population type, which enabled the analysis of a self-pollinated population derived from a heterozygous parent. The linkage map was constructed in two steps. Initially, loci were grouped into linkage groups using the following parameters: the independence test log-likelihood of the odds (LOD) score $ 8.0, maximum-likelihood (ML) mapping module (Stam 1993; Jansen et al. 2001), Kosambi’s mapping function (Kosambi 1944), maximum recombination (REC) frequency ¼ 0.35, goodness-of-fit Jump threshold for removal loci ¼ 5.0, ripple ¼ 1, and third round ¼ yes. After grouping, loci within linkage groups were ordered using the regression mapping algorithm (Stam 1993). The linkage groups established from the third round of analysis formed the initial framework map. Then four to six loci distributed evenly on the framework map were fixed and the calculation parameter was changed to a LOD score $ 3.0 and a maximum REC frequency ¼ 0.40. This step allowed us to assign some of the otherwise ungrouped loci on the already established linkage groups. Two independent linkage groups were accepted as linked if a marker on the end of one group showed a cross linkage to another marker on a second group through the “maximum linkages” function of JoinMap 4.0. In addition, those unmapped markers that showed weak links with mapped loci at the maximum linkage parameter threshold of 2.0 were listed next to mapped loci as accessory loci and formed the final linkage map. Markers showing segregation distortion were included in the final map if their presence did not alter surrounding marker order in a given linkage group. For any markers with an estimated position of less than 0 cM, their position was set as 0 cM, and the positions of other markers on the same linkage group were adjusted accordingly (Beldade et al. 2009). To compare the collinearity between the initial and final maps, the same markers and their individual distances on both maps were arrayed in Microsoft Excel 2007, and a function “correlate” was conducted to obtain a correlation coefficient. Linkage groups (LG) were identified to be homeologous if they shared common SSR markers. Linkage groups were numbered based on the comparison with published linkage maps (Okada et al. 2010). The designation of subgenome “a” or “b” for each LG in this study was given according to the named subgenome of a corresponding LG, which shared more markers than its alternate LG (Okada et al. 2010). For a LG (i.e. 7b), on which only four gSSR markers mapped and no bridge markers were found, the original clone sequences harboring the four gSSR markers (Wang et al. 2011) were blasted against sorghum genome in GRAMENE (http://www.gramene.org/) with “near-exact matches” set as the search sensitivity parameter. Thus, using the sorghum genome sequence as a tool, LG 7b was identified and compared with the reference switchgrass maps of Okada et al. (2010).
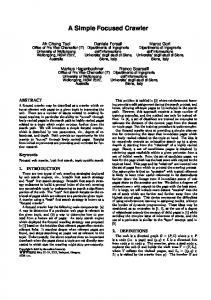
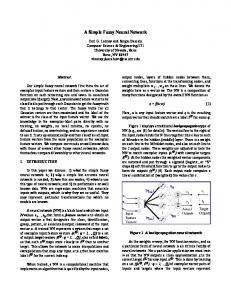
The linkage phase of each locus on the final framework map was obtained from JoinMap 4.0, which automatically determined the coupling and repulsion phase types during the estimation of the recombination frequencies. Chi-square testing for the ratio of coupling to repulsion linkage phase was conducted with the online software of Preacher (2001). Comparative mapping To search for the locations of the mapped SSR loci on foxtail millet chromosomes, foxtail millet genome sequence Phytozome v7.0 (http:// www.phytozome.net/foxtailmillet.php, accessed on March 31, 2011) was used for alignment with the switchgrass mapped marker sequences. The parameters for BlastN program were as follows: Expected (E) threshold = 10, comparison matrix = Blosum62, alignments to show = 100, allow gaps = yes, filter = yes. The output was parsed manually to identify those significant hits with the lowest e-value and the position of each query sequence. Only the final framework markers were evaluated, and all others were omitted. RESULTS Determination of nonredundant PCR markers and polymorphism screening Of the 2288 switchgrass gSSR and EST SSR (eSSR) markers from different sources (Tobias et al. 2006, 2008; Okada et al. 2010; Wang et al. 2011), 19 were determined to be redundant PPs (see Table S2), in addition to the 4 redundant PPs reported previously (Wang et al. 2011). The resultant 2265 nonredundant SSR markers from switchgrass were screened for polymorphisms. Polymorphic markers were preliminarily identified if they showed segregation in the small panel of eight genotypes (Figure 1). Of 1105 switchgrass gSSRs, 377 were determined to be polymorphic. After amplifying them on a panel of 66 individuals, 7 gave monomorphic amplifications (no segregation) and 58 produced unclear amplifications, resulting in difficulties in band scoring and subsequently discarded. The remaining 312 (28.2%) were used for the linkage map construction. Of the 1160 switchgrass eSSRs, 210 showed polymorphisms in the small screening panel. Later, 48 were further discarded due to their unclear amplifications, and the remaining 162 (14%) eSSRs were used for genotyping the entire population. To explore which marker types give more information for the linkage map construction, the relationship between polymorphism, repeat, and motif type were further analyzed. Of the 2265 nonredundant SSR markers, 1022 were of dinucleotide type, 924 were trinucleotide, 244 were compound, and the remaining 75 were tetranucleotide, pentanucleotide, hexanucleotide, or unknown repeat type. Their polymorphic rates were as high as 25.8% (63/244) for the compounds, followed by 25.1% (257/1022) for dinucleotide repeats, 16.7% (155/924) for trinucleotide, and 9.3% (7/75) belonging to other repeat types. Among all switchgrass SSRs tested, 2221 had known motif types. Of them, GA/AG/TC/CT occurred at the highest frequency of 23.9% (531/2221), followed by CA/AC/GT/TG with 17.5% (388/2221), CCG/GCC/CGC/CGG/GGC/GCG with 16.9% [376/2221, most of them from ESTs developed by Tobias et al. (2008)], CAG/GCA/AGC/ CTG/TGC/GCT with 15.1% (336/2221), and AAG/GAA/AGA/CTT/ TTC/TCT with 10.5% (233/2221). The frequencies of motif type were almost consistent with marker polymorphisms. GA/TC was the most abundant motif type with the highest polymorphic frequency of 36.4%, followed by the motif CA/TG with 17.1% (Figure 2). Of the 354 sorghum SSRs, 39 (11.0%) amplified clear and scorable bands in switchgrass, indicating their transferability across the species.
Volume 2 March 2012 |
Genetic Linkage Map of Switchgrass |
359
Figure 1 A gel image of screening SSR primer pairs for polymorphism and reliability on a panel of NL94 (first lane from left side per panel) and seven selfed progeny. Polymorphic and segregated markers are indicated in boxes. The first and last lanes are DNA ladder 50–350 size standards (LI-COR Biosciences, Lincoln, NE).
In the small screening panel, 6 sorghum SSRs showed polymorphisms but only 1 produced clear and heritable bands and was used for the map construction. The 189 nonredundant foxtail millet SSRs were screened, and 102 (54.0%) showed expected bands and were scorable. Of them, 8 markers were validated to be effective for genotyping the entire mapping population. Together, 483 unambiguous polymorphic SSR markers, including 312 gSSR, 162 eSSR, 1 sorghum SSR, and 8 foxtail millet SSR markers, were identified to have effective polymorphisms in the population. The average number of segregated alleles per polymorphic PP was 2.03, with a range of 1 to 6 (Table 1).
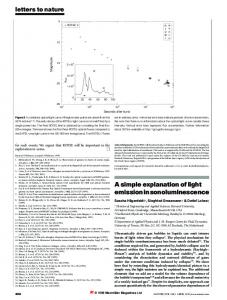
A lower LOD score of 2.0 was set for joining two separated groups in LG 6b because two of the markers resided in the end of each LG (sww-1969 and sww-1889) and showed a cross link with an REC frequency of 0.38. Thus, a total of 469 loci from 453 SSR PPs were ordered and placed on the final framework map with 18 LGs, the complete set expected for a tetraploid switchgrass genome (Figure 4). In addition, 30 accessory loci were assigned to likely positions on the map (Figure 4). Only 7 (1.4%) of 506 loci were not grouped or placed on the final map. Excellent correlation between the initial
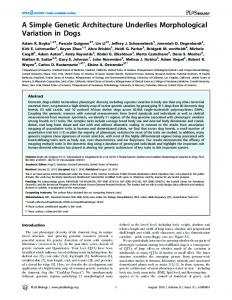
Inheritance of markers The typical segregation of SSR markers was scored as “hh,” “hk,” or “kk” in the mapping population (Figure 3), and only three loci produced from sww-2097, sww-1678, and PVAAG-3053/3054 were scored as dominant. Of 503 codominant polymorphic loci, 81.3% (408/503) had a goodness-of-fit of 1:2:1 segregation ratio in the x2 test (P ¼ 0.05); the remaining 94 (18.7%) loci demonstrated distorted segregation, i.e. deviating from the Mendelian ratio (Table 2). Of the 3 dominant loci, 2 (sww-1678 and PVAAG-3053/3054) showed a 3:1 ratio and 1 (sww-2097 with presence:absence ratio ¼ 80:58) deviated from 3:1. Linkage map construction Under the highly stringent conditions with a minimum LOD score of 8.0 and maximum REC value of 0.35, an initial framework map was constructed with 360 loci (Table 3). Then the framework order was fixed to allow the positioning of an additional 109 loci with the minimum LOD ¼ 3.0 and maximum REC ¼ 0.4. [This value is the maximum detectable recombination frequency for our population size of 139, according to the calculating equation of Wu et al. (1992)].
360 |
L. Liu et al.
Figure 2 Distribution frequency and polymorphism of switchgrass SSRs based on motif types.
n Table 1 Amplification, polymorphism, and mean number of segregated alleles in NL94 switchgrass Marker Types a
Marker Tested
Polymorphic SSRs
Range of Alleles
Total Amplicons from Polymorphic Primer Pairs
Total Segregated Alleles
SWG gSSR
1105
312
1–5
663
632
2.02
SWG eSSR
1160
162
1–6
360
341
2.09
39 189
1 8
4 1–4
4 21
2 16
2493
483
1048
991
Sorghum SSR Millet SSR Total a
Mean Number of Segregated Alleles in NL94
2 2
Marker Sources Okada et al. (2010); Wang et al. (2011) Tobias et al. (2006, 2008); Okada et al. (2010) Wu and Huang (2006) Jia et al. (2009); Dr. A. Doust (unpublished data)
2.03 (Ave)
SWG, switchgrass (Panicum virgatum); sorghum, Sorghum bicolor; Millet, foxtail millet (Setaria italica).
and final maps was observed by comparing their orders (r ¼ 0.9873, P , 0.01; see Figure S2). Including accessory loci, the percentage of polymorphic markers mapped was 98.6% (499/506). The number of loci per LG varied from 4 (LG 7b) to 52 (LG 9b). The total length of the map was 2085.2 cM, and the average distance between two adjacent markers was 4.2 cM (Table 3 and Figure 4). The length of the LGs varied from 3.8 (LG 7b) to 162.5 cM (LG 6b), with an average of 115.8 cM. The marker loci were not evenly distributed across LGs, and consequently, some LGs (LG 2a, 2b, 3b, 5b, and 9b) were denser with the clustering of markers than others. Twenty-three gaps with each $ 15.0 cM, a distance suitable for QTL analysis and marker-assisted application (Beckmann and Soller 1983), remained and collectively spanned 339.6 cM (Table 3). There were 120 common markers shared by this and the previous maps of Okada et al. (2010). Except for three local rearrangements on LG 2b and four on 9a, good collinearity of marker orders along 18 LGs was observed through 102 bridge SSR markers (Figure S3). The LGs, therefore, were named according to the previous maps (Okada et al. 2010) for consistency (Figure 4). The maximum number of bridge markers within each pair of corresponding LGs ranged from 3 to 16 (see Table S3). The designations of subgenome (“a” or “b”) were assigned to each LG based on the identification of bridge markers with previous maps (Okada et al. 2010). Among the remaining 18 common markers, 15 (83.3%) resided on their corresponding homeologous LGs based on the reference map information (Okada et al. 2010) (Table S3), and the other 3 were distributed in nonhomeologous LGs (Figure 4). One short LG was formed with 4 marker loci, of which none were mapped in the Okada et al. (2010) map. Blast
analysis indicated 2 of the 4 mapped markers (i.e. PVCAG-2491/2492 and PVCAG-2163/2164) had hits on the bottom of sorghum chromosome 6 with the E-values of 2.2e-03 and 2.8e-05, respectively (Figure S3). Thus, it was named “LG 7b” as the sorghum chromosome 6 corresponds to switchgrass LG 7, and LG 7a was identified based on the bridge markers with the previous maps (Okada et al. 2010). A polymorphic sorghum SSR (Xtxp-46), which resided on the end of sorghum LG Sbi01 (Wu and Huang 2006), was mapped on LG 9a (Figure 4). Except for a foxtail millet SSR (p58) which resided on an accessory locus of LG 1b, the other seven polymorphic foxtail millet SSRs were distributed on six different LGs, i.e. MPGD25 on LG 2a, b255 on LG 3a, MPGD19 on LG 5b, MPGD17 on LG 7a, b159 on LG 8b, and both b171 and p44 on LG 9b (Figure 4). A comparison of shared markers between this study and a published foxtail millet map (Jia et al. 2009) indicated that, except for one mismatch where a marker (Millet-b159) was expected on LG 6a (or LG 6b) but was actually mapped on LG 8b, the other seven markers showed consistent correspondence of LGs between switchgrass and foxtail millet (Figure 4). A total of 20 multi-allele PPs were used to determine the homeologous LGs. The majority of these PPs (18 of 20) amplified one locus on each subgenome, and the remaining 2 PPs produced three different loci each. Six homeologous LG pairs (LG 1a to 1b, 2a to 2b, 4a to 4b, 6a to 6b, 8a to 8b, and 9a to 9b) were identified based on 12 shared PPs (Figure 4). The result was consistent with the LG naming system described by Okada et al. (2010). The other three homeologous LGs were identified based on bridge markers with the previously published maps (Okada et al. 2010).
Figure 3 A gel image of genotyping an SSR marker PVGA1963/1964 in the parent NL 94 (P) and 65 selfed progeny. Individual genotypes were scored as homozygous (hh or kk) or heterozygous (hk). The first and last lanes are DNA ladder 50–350 size standards (LI-COR Biosciences, Lincoln, NE).
Volume 2 March 2012 |
Genetic Linkage Map of Switchgrass |
361
n Table 2 Segregation of 506 polymorphic loci in the switchgrass selfed mapping population by chi-square test Marker Types
Polymorphic Loci
SWG gSSR SWG eSSR Sorghum SSR Millet SSR Total a
321 176 1 8 506
Codominant
Dominant
1:2:1
1:34:1
3:1
35:1
0 0 0 0 0
1 1 (1) 0 0 3 (1)
0 0 0 0 0
(51)a
269 132 (42) 1 7 (1) 409 (94)
Segregation-distorted loci indicated in parenthesis.
Distribution for segregation-distorted loci and the ratio of linkage phase Among 94 segregation-distorted loci (SDL), 84.0% (79/94) were placed on the final framework map, 13.8% (13/94) belonged to accessory loci, and only 2.1% (2/94) were unmapped. Except for LG 7b and 8a, the other 16 LGs possessed SDL ranging from 3.6% (1/28) in LG 3a to 38.5% (20/52) in LG 9b (Figure 4). Clustering of SDL with greater than 4 loci was observed only in the middle part of two LGs, i.e. 5b and 9b. Remarkably, 10 consecutive SDL were found in LG 9b (Figure 4). The remaining SDL were randomly scattered over the LGs. The ratio of coupling to repulsion linkage phase is expected as 1:1 for allopolyploids, and 1:0.25 in autotetraploids (Wu et al. 1992). Among the 469 linked loci on this framework map, a ratio of 241:228 coupling to repulsion phase linkage were detected, which conformed to a 1:1 ratio (X2 ¼ 0.36 , X2(1, 0.05) ¼ 5.99), completely confirming the disomic inheritance reported by Liu and Wu (2011) and being highly congruent with the results of Okada et al. (2010). Mapping SSR sequences to foxtail millet genome Of the plant species with the genome sequenced, foxtail millet is currently the closest relative of switchgrass, as both species belong to the Paniceae tribe and share a common ancestor 13 (63) million years ago (Doust et al. 2009; Brutnell et al. 2010; Li and Brutnell
2011). The blast analysis indicated that of the 453 tested markers, 389 had hits in foxtail genomes. There existed a one-to-one relationship between nine switchgrass homeologous groups and nine foxtail millet chromosomes (Table 4). A total of 319 of 389 markers from the switchgrass LGs matched nine corresponding foxtail millet chromosomes (Table 4 and Table S4). Two large homeologous groups, 2 and 9 (including 71 and 62 markers, respectively), were anchored in foxtail millet chromosomes II and IX. In contrast, only 8 markers were on foxtail millet chromosome VII. The mismatched markers appeared to scatter at random on foxtail millet chromosomes. DISCUSSION The selfed progeny population for mapping the genome in switchgrass Due to wind-facilitated cross-pollination and strong genetic selfincompatibility, switchgrass is an allogamous species and homozygous inbred lines are unavailable in nature (Talbert et al. 1983). For this reason, full-sib populations from two heterozygous parents were developed to construct switchgrass linkage maps (Missaoui et al. 2005; Okada et al. 2010). The population of Missaoui et al. (2005) was composed of 85 full-sib progeny from a cross of ‘Alamo’ genotype AP13 (seed parent) and ‘Summer’ VS 16, whereas the population of Okada et al. (2010) consisted of 238 full-sib plants derived from crossing one genotype (seed parent) of “Kanlow” with a selection of “Alamo.” Because male and female meioses in the full-sib populations were distinct and independent processes, two separate parental maps were constructed, one map for the male parent and another for the female parent (Okada et al. 2010). Recently we identified a self-compatible lowland switchgrass genotype NL94. A first (S1) generation inbred population from selfing NL94 was developed with the assistance of marker-based identification (Liu and Wu 2011). This S1 population is similar to an F2 population derived from selfing a F1 hybrid of a cross between two different inbred lines; therefore, only one map was constructed instead of two separate (male and female) maps. In other cross-pollinated species, such as loblolly pine
n Table 3 Loci composition and recombination distance of linkage groups Linkage Groups
Loci on Initial Framework Mapa
Total Loci on Final Framework Mapb
Accessory
Total Length
Average Distance (cM)
Number of Gaps .15 cM
Largest Gap per LG (cM)
17 30 40 36 24 35 11 12 12 36 9 10 10 4 7 13 22 32 360 20.0
23 38 47 42 28 46 16 18 18 43 13 16 13 4 9 15 28 52 469 26.1
0 11 3 1 0 2 2 0 2 0 0 0 3 0 0 1 2 3 30 1.7
114.9 135.7 126.5 90.3 152.3 157.7 37.2 75.4 128.2 165.2 137.3 162.5 126.4 3.8 93.1 86 155.2 137.5 2085.2 115.8
5.0 3.6 2.7 2.2 5.4 3.4 2.3 4.1 7.1 3.8 10.6 10.2 9.7 1.0 10.3 5.7 5.5 2.6
0 1 0 0 3 3 0 1 1 1 4 3 2 0 2 1 1 0 23 1.3
12.9 21 8.8 8.9 23.1 21 5.2 15.4 15.1 18.9 29.4 38.1 33.3 1.9 20.7 16.6 39.7c 9.6 339.6
1a 1b 2a 2b 3a 3b 4a 4b 5a 5b 6a 6b 7a 7b 8a 8b 9a 9b Total Average
a Calculated parameters with maximum recombination ratio = 0.35 and minimum LOD = 8.0. b Calculated parameters with maximum recombination ratio = 0.40 and minimum LOD = 3.0. c
Largest gap in whole genome.
362 |
L. Liu et al.
4.2
Volume 2 March 2012 |
Genetic Linkage Map of Switchgrass |
363
Figure 4 A linkage map derived from 139 self-fertilized progeny of tetraploid switchgrass NL 94. Map distances in Kosambi map units (cM) of each linkage group (LG) are shown on the left, and marker names are shown on the right. The gray segment in LG 6b indicates linkage identified with maximum linkage function at a LOD value of 2.0. The accessory loci, which are nearly equivalent to the mapped loci based on the maximum linkage function in JoinMap 4 (Van Ooijen 2006), are listed next to mapped loci. The linkage groups were grouped into homeologous groups based on multi-allele markers (in bold) and connected by dashed lines. The Arabic numeral designation of each homeologous groups (1–9) follows the previously published linkage map (Okada et al. 2010). The bridge markers with good collinear relationships between two switchgrass maps are underlined, and those commonly used markers but cross-linked with other LGs are denoted behind the loci with square brackets and their corresponding LGs inside. Note some markers are labeled with both symbols. The markers from sorghum (Sorghum bicolor) and foxtail millet (Setaria italic) are indicated in italics and species names are added to distinguish them from switchgrass. The dominant markers are indicated with the letter “d” appended to the marker name. The common markers shared by this map and previous sorghum (abbreviated as “sbi”) or foxtail millet (abbreviated as “Sit”) maps are labeled behind the loci with curly brackets and their corresponding LGs inside. Segregation-distorted loci (SDL) indicate different significant levels: �P , 0.01, ��P , 0.001, and ���P , 0.0001.
364 |
L. Liu et al.
Figure 4 Continued.
Figure 4 Continued. Volume 2 March 2012 |
Genetic Linkage Map of Switchgrass |
365
n Table 4 Positioning of switchgrass mapped loci in the genome of foxtail millet (Setaria italica) Switchgrass Homology Group 1 2 3 4 5 6 7 8 9 Total
Foxtail Millet Chromosomea I
II
40 4 5
3 71 3 3
2 1
1 1
1 53
82
III 1 53 1 1 2 1 1 2 62
IV 3 1 1 18 2
1 1 27
V
VI
VII
1
VIII
IX
Total
%
1
2 2 3 1
50 80 67 28 45 22 11 19 67 389 (319)b
80.0 88.7 79.1 64.3 82.2 72.7 72.7 73.7 92.5 (81.7)c
1
1
1 2 2 16 1 1
42
24
2 37 1
1 1 1 1 8
9
1 14 1 19
62 71
a
Based on the personal communication with Dr. A. Doust (Botany Department, Oklahoma State University), the nine chromosomes of foxtail millet corresponded to the first nine assembled scaffolds, which represented 98.9% of the whole-genome sequence of foxtail millet released in Phytozome v7.0 (www.phytozome.net/ foxtailmillet.php). b Total number of loci showing one-to-one relationship between switchgrass linkage groups and foxtail millet chromosomes are indicated in parenthesis. c Overall mean of percentage.
(Remington et al. 1999), sugarcane (Hoarau et al. 2001; Andru et al. 2011), and grapes (Blasi et al. 2011), S1 progeny have also been used for constructing linkage maps using SSR, amplified fragment length polymorphism (AFLP), resistance gene analog (RGA), and target region amplification polymorphism (TRAP) markers. Population size is the other important issue in constructing a linkage map, because it is highly associated with the accuracy of detecting recombination events. However, the size of the mapping population is often limited by the genotyping and phenotyping costs. The population size used in this study was 139 S1 progeny resulting in 278 gametes that were used in the calculation of the recombination frequencies. Consequently, its mapping accuracy should be much higher than that used in the reference maps, as each map was constructed using 238 gametes (238 full-sib F1 individuals, Okada et al. 2010). SSR marker polymorphisms SSRs used as a DNA marker system are advantageous over many other marker systems and have been widely utilized in many plant genomic studies (Morgante and Olivieri 1993). In this study, we exhaustively screened all available switchgrass SSR markers from various sources (Tobias et al. 2006, 2008; Okada et al. 2010; Wang et al. 2011) and found the polymorphic ratio of gSSRs is nearly 2-fold higher than that of eSSRs (i.e. 28.2% vs. 14.0%). This result is consistent with previous studies revealing higher polymorphism levels in gSSR than in eSSR markers (La Rota et al. 2005; Saha et al. 2005). This is because gSSRs mostly reside in nongenic regions (Varshney et al. 2005), so more variations can be tolerated than eSSRs. The majority of gSSRs used here were inherited in a codominant manner, and in most cases, they are chromosome-specific because only a single locus is amplified from one of the two homologous chromosomes. This unique markerchromosome relationship is a very useful feature in a polyploidy genome. Similar phenomena were observed in wheat gSSRs (Röder et al. 1998a). Although previous studies indicated eSSRs are prone to accumulate in gene-rich regions and affect the coverage of linkage maps (Pinto et al. 2006), in this study, mapped eSSRs were interspersed along the whole linkage map, mostly between the gSSRs, and no obvious clusters were observed. It is further noteworthy that 80.6% of SSRs (2010 of 2493 tested markers) amplified monomorphic bands in the parent NL94 of this mapping population, indicating the parent has a high level of homozygosity. Higher polymorphisms of the same gSSR and eSSRs markers were reported between switchgrass varieties
366 |
L. Liu et al.
(Wang et al. 2011; Tobias et al. 2008). We observed a higher frequency of polymorphism in dinucleotide microsatellites (GA- and CA-motifs) than in trinucleotide microsatellites (CCG-, CAG-, and AAG-). This is in agreement with the previous results obtained in switchgrass (Wang et al. 2011) and other grasses, such as tall fescue (Festuca arundinacea) (Hirata et al. 2006; Saha et al. 2006), timothy (Phleum pretense) (Cai et al. 2003), perennial ryegrass (Lolium perenne) (Jones et al. 2001), and zoysiagrass (Zoysia spp.) (Cai et al. 2005). Trinucleotide motifs could stably reside in the target regions and suppress frameshift mutations and variations (Varshney et al. 2005), and dimeric repeats have been found in the untranslated regions of many species (Morgante et al. 2002; Jung et al. 2005). On the basis of the higher occurrence and polymorphism, dinucleotide SSRs could be preferentially selected for linkage map development in the future. We observed that sorghum and foxtail millet gSSR markers had a marker transferability of 11% and 54%, respectively, which mirrored the respective divergence distance of the two species from switchgrass. Because the whole-genome sequence (although not 100%) of foxtail millet is publicly available now and has a higher transferability to switchgrass than sorghum, it provided a valuable resource to develop new molecular markers for constructing LGs of switchgrass, a plant with limited sequence information. Genetic linkage map Estimates of the genome length and map distance between markers are important for the characterization of gene effects, integration of genetic and physical maps, and evaluation of map coverage. Several factors can affect the accuracy of LG construction. Among them, genotyping errors are a common factor that inflates the map length, especially when multiple bands (alleles) of the markers are scored in a polyploidy species (Pompanon et al. 2005). Errors can be divided into two distinct types: type I is allelic dropout, in which one allele of a heterozygote randomly fails in PCR amplification, and type II is false alleles, in which the true allele is mistakenly genotyped due to low quality of DNA, resulting in PCR or electrophoresis artifacts or scoring errors in reading and recording data (Broquet and Petit 2004). To ensure the quality of the linkage map, a number of measures were taken as follows. First, high-quality DNA samples were extracted using a stringent CTAB method (Doyle and Doyle 1990), and each sample was measured for A260/280 value to be �1.8 and analyzed in agarose gel electrophoresis to show only one bright band in a high molecular weight area. Second, the scoring system of codominant markers was
utilized rather than the single dose dominant markers previously used by Okada et al. (2010) and Missaoui et al. (2005). We found most polymorphic markers showed mainly two reproducible alleles in parent NL94. This result is similar with previous studies where the mean number of amplicons per individual was 2.18 (Tobias et al. 2008). The segregation of all markers in progeny was scored as only one pattern (,hkxhk.), instead of five types (,abxcd., ,efxeg., ,lmxll., ,nnxnp., and ,hkxhk.) ranging from two to four alleles in a full-sib population. The fewer alleles recorded, the fewer chances that an allele dropout could occur, thus increasing the accuracy of genotyping. The codominant markers used here provided more information for linkage analysis than do dominant ones (Wu et al. 2002). Third, all marker data were scored independently by two people to reduce errors. Those markers with spurious, unstable, or redundant bands were either repeatedly tested or excluded (accounting for about 10% of total data) from the final map calculations. Four, we initially started linkage calculations using the markers with high fidelity to construct a framework map with LOD to 8.0. Those markers were fixed to allow more markers to be added on the linkage map by reducing the LOD threshold to 3.0 (except for 2.0 to link two segments of LG 6b). This strategy has been successfully used by previous studies (Wu and Huang 2006; Okada et al. 2010) and guaranteed both the accuracy and high coverage of the final full map. A high collinearity between our map and the previously published switchgrass maps of crossed populations (Okada et al. 2010) was observed, excepting the following small discrepancies: seven inversions in marker order between our map and the reference maps (Figure S3). Except for 1 mismatched foxtail millet marker, the other 7 markers from foxtail millet (Jia et al. 2009) and 1 marker from sorghum (Wu and Huang 2006) matched their corresponding foxtail millet and sorghum linkage maps, respectively (Figure 4). The local rearrangement in some LGs could be real due to their universality in plant genomes (Paterson et al. 1996) or to genotyping errors in either of the populations. After all, errors can never be completely avoided in linkage mapping (Johnson and Haydon 2007). When a genetic map is constructed, it is assumed that marker crossovers during meiosis occur at random intervals along chromosomes (Lichten and Goldman 1995). In this study, although we used all available markers, only 4 markers were mapped on LG 7b. In contrast, LG 7b is one of the linkage groups with the highest marker density in a previous study (Okada et al. 2010). Of the 63 markers mapped on LG 7b by Okada et al. (2010), 57 markers were monomorphic and 6 markers produced unscorable bands in our population, indicating the very high homozygosity level of the NL 94 chromosome corresponding to LG 7b. Genome structure of switchgrass The genome structure of switchgrass was described in previous studies, but no consistent conclusions were drawn (Missaoui et al. 2005; Okada et al. 2010; Saski et al. 2011), i.e. allotetraploid vs. autotetraploid. Allotetraploids have two diverged subgenomes and show the same inheritance as diploids. In this study, we speculate NL 94 switchgrass is an allotetraploid genotype because of the evidence described as follows. First, all 503 codominant markers had disomic inheritance, although 18.7% showed segregation distortion. Second, the ratio of coupling to repulsion linkage was 1:1, which is consistent with the disomic inheritance mode in polyploidy map construction (Wu et al. 1992; Qu and Hancock 2001). Third, among 476 mapped SSR markers, only 20 (4.2%) amplified more than two bands and mapped on homeologous LGs, indicating that the two subgenomes are significantly different from each other. The allotetraploid-like genome structure of the tetraploid switchgrass uncovered by this study
and the two recent molecular marker investigations (Okada et al. 2010; Liu and Wu 2011) agree well with the published cytological observations of the bivalent pairing behavior of meiotic chromosomes (Barnett and Carver 1967; Martinez-Reyna et al. 2001; Young et al. 2010). However, because diploid wild ancestors of switchgrass are unknown and there are many examples of autotetraploids that through time have undergone “diploidization” leading to disomic inheritance (see review by Wolfe 2001), much more sequence data are needed to address this issue of allopolyploidy confidently. In this study, we successfully identified six homeologous LGs using the 20 multi-allele markers. Attempts were made to find more multiallele markers, but most of those multi-allele primer pairs were errorprone during band scoring or unstable for the entire population. To avoid eroding the quality of the linkage map, we were cautious when selecting these markers. Approximately 20% the eSSR markers amplified alleles in two subgenomes of switchgrass in previous maps and identified nine complete homeologous LGs (Okada et al. 2010). Although higher numbers of multi-allele SSRs were reported in their study, Okada et al. (2010) strongly believed that the subgenomes of switchgrass were distantly related. Through the bridge markers and comparative mapping between ours and published maps (Okada et al. 2010), nine complete homeologous LGs were identified in this study. Segregation distortion Numerous examples of segregation distortion have been reported in many crop species, including barley (Hordeum vulgare) (Graner et al. 1991; Devaux et al. 1995), rice (Oryza sativa)(Causse et al. 1994; Xu et al. 1997), maize (Zea mays) (Wendel et al. 1987; Lu et al. 2002), and wheat (Triticum aestivum) (Blanco et al. 2004; Quarrie et al. 2005). In this study, segregation distortion was observed for 18.7% of the total marker loci analyzed. This is slightly higher than that of the full-sib switchgrass population with a value of up to 14% (Okada et al. 2010). Because a selfed population was used here, the result is consistent with previous reports that showed selfed populations had a higher tendency for segregation distortions due to inbreeding depression (Andru et al. 2011; Charlesworth and Willis 2009). Two SDL clusters were identified on LG 5b and 9b in this study (Figure 4). Previous studies indicated that segregation distortion was an indication of the linkage between molecular markers and distorting factors (such as recessive lethal genes and incompatible alleles) (Lyttle 1991). If the linkage was tight, they usually had similar segregation patterns and the skewed markers would appear to be clustered (Jenczewski et al. 1997). These two SDL clusters were not found in other studies, suggesting they are population-specific. Similarly, in sugarcane and grape S1 maps (Hoarau et al. 2001; Blasi et al. 2011), some distorted markers were also clustered together. Comparative mapping Comparative genome relationships have been established among rice, foxtail millet, sugar cane, sorghum, pearl millet, maize, and the Triticeae cereals (wheat, barley, rye, and oats) (Gale and Devos 1998). As an emerging biofuel crop with a relatively short breeding history, switchgrass had the only reported relationship with the sorghum genome, in which nine homeologous groups of switchgrass corresponded to 10 sorghum chromosomes (Okada et al. 2010). Here we utilized the newly released foxtail millet sequence and revealed that about 80% of switchgrass markers were located in the foxtail millet chromosomes. This result directly indicated the strong one-to-one relationship between the chromosomes of switchgrass and foxtail millet. The corresponding genomic relationship among switchgrass, foxtail millet, and sorghum is consistent with a previously integrated grass comparative map (Devos and Gale 1997). The high genetic
Volume 2 March 2012 |
Genetic Linkage Map of Switchgrass |
367
similarity between switchgrass and foxtail millet is not surprising when considering their close relationship, with both belonging to the same Paniceae tribe and the high collinearity among grasses reported previously (Devos and Gale 1997, 2000). However, mismatched markers still existed. These might have been derived from chromosomal rearrangements occurring after the respective speciation of both switchgrass and foxtail millet. Due to its small stature, rapid life cycle, inbred pollination, and prolific seed production, foxtail millet is a desirable candidate to be used as a reference model for switchgrass genetic and functional genomics investigation. Genomics and breeding implications Switchgrass has large, highly heterozygous polyploidy genomes that hinder the effort of whole-genome sequencing. Dihaploid lines were identified in switchgrass (Young et al. 2010) and seem to be helpful for simplifying sequence assembly but are unsuitable for entire genome sequencing due to their high sterility and instability (Young et al. 2010). A diploid relative of switchgrass (i.e. Panicum hallii) (2n = 2x = 18) is being sequenced at the Joint Genome Institute (JGI, http://www.jgi.doe.gov/genome-projects/); however, it has only one set of chromosomes, and therefore, it may not be effective for defining two subgenomes of switchgrass. Here we constructed a high-density genetic map derived from selfing a single genotype NL94. A total of 476 SSR markers were mapped in more than 2000 cM genome length with average marker distance of 4.2 cM. The present map provides an excellent tool for distinguishing switchgrass subgenomes. Through continuing to self switchgrass plants like NL94, inbred lines are being produced in our lab. These could be used as the starting material for whole-genome sequencing. Based on our preliminary observations in the field, the selfed progeny of NL94 showed significant segregation for biomass and its associated traits, such as plant height, circumference of plant base, tiller number, and spring growth vigor. It would be much easier to perform a QTL analysis using a single map than two maps from a fullsib population. Our S1 mapping population should have some features of F2 populations, including the estimation of both additive and dominant effects (Carbonell et al. 1993). In conclusion, this study developed a complete genetic map of 18 linkage groups in an inbred lowland switchgrass population using mostly codominant SSR markers. This map is the longest and most dense one constructed to date. Two clusters of segregation-distorted loci were found in the switchgrass genome. A one-to-one relationship between nine switchgrass homeologous groups and nine foxtail millet chromosomes was established. This linkage map should provide a new genetic framework to facilitate genomics research, quantitative trait locus (QTL) mapping, and marker-assisted selection. ACKNOWLEDGMENTS We would like to thank the following funding sources and individuals for sponsoring and helping in this research: National Science Foundation Award EPS 0814361; Oklahoma Agricultural Experiment Station; Andrew Doust (Botany Department, Oklahoma State University) for sharing foxtail millet primer and sequence information; Christian M. Tobias (Western Regional Research Center, USDA– ARS) for his helpful discussion in the construction of the linkage map; Mrs. Janelle Malone for editorial input; and lab members, including Yiwen Xiang, Candace Pitts, Elke Grether, Gary Williams, Sharon Williams, Pu Feng, Chengcheng Tan, James Todd, Shiva Makaju, and Shuiyi Lu. The genome nucleotide sequence of foxtail millet for blast analysis was generated by J.G.I. and has not yet been published.
368 |
L. Liu et al.
LITERATURE CITED Andru, S., Y. B. Pan, S. Thongthawee, D. M. Burner, and C. A. Kimbeng, 2011 Genetic analysis of the sugarcane (Saccharum spp.) cultivar ’LCP 85–384’. I. Linkage mapping using AFLP, SSR, and TRAP markers. Theor. Appl. Genet. 123: 77–93. Barnett, F. L., and R. F. Carver, 1967 Meiosis and pollen stainability in switchgrass, Panicum virgatum L. Crop Sci. 7: 301–304. Beckmann, J. S., and M. Soller, 1983 Restriction fragment length polymorphisms in genetic improvement: methodologies, mapping and costs. Theor. Appl. Genet. 67: 35–43. Beldade, P., S. V. Saenko, N. Pul, and A. D. Long, 2009 A gene-based linkage map for Bicyclus anynana butterflies allows for a comprehensive analysis of synteny with the lepidopteran reference genome. PLoS Genet. 5: e1000366. Blanco, A., R. Simeone, A. Cenci, A. Gadaleta, O. A. Tanzarella et al., 2004 Extension of the “Messapia x dicoccoides” linkage map of Triticum turgidum (L.). Thell. Cell Mol. Biol. Lett. 9: 529–541. Blasi, P., S. Blanc, S. Wiedemann-Merdinoglu, E. Prado, E. H. Rühl et al., 2011 Construction of a reference linkage map of Vitis amurensis and genetic mapping of Rpv8, a locus conferring resistance to grapevine downy mildew. Theor. Appl. Genet. 123: 43–53. Broquet, T., and E. Petit, 2004 Quantifying genotyping errors in noninvasive population genetics. Mol. Ecol. 13: 3601–3608. Brutnell, T. P., L. Wang, K. Swartwood, A. Goldschmidt, D. Jackson et al., 2010 Setaria viridis: a model for C4 photosynthesis. Plant Cell 22: 2537–2544. Cai, H. W., N. Yuyama, H. Tamaki, and A. Yoshizawa, 2003 Isolation and characterization of simple sequence repeat markers in the hexaploid forage grass timothy (Phleum pretense L.). Theor. Appl. Genet. 107: 1337– 1349. Cai, H. W., M. Inoue, N. Yuyama, W. Takahashi, M. Hirata et al., 2005 Isolation, characterization and mapping of simple sequence repeat markers in zoysiagrass (Zoysia spp.). Theor. Appl. Genet. 112: 158–166. Carbonell, E. A., M. J. Asins, M. Baselga, E. Balansard, and T. M. Gerig, 1993 Power studies in the estimation of genetic parameters of quantitative trait loci for backcross and doubled haploid populations. Theor. Appl. Genet. 86: 411–416. Causse, M. A., T. M. Fulton, Y. G. Cho, S. N. Ahn, J. Chunwongse et al., 1994 Saturated molecular map of the rice genome based on an interspecific backcross population. Genetics 138: 1251–1274. Charlesworth, D., and J. H. Willis, 2009 The genetics of inbreeding depression. Nat. Rev. Genet. 10: 783–796. Costich, D. E., B. Friebe, M. J. Sheehan, M. C. Casler, and E. S. Buckler, 2010 Genome-size variation in switchgrass (Panicum virgatum): flow cytometry and cytology reveal rampant aneuploidy. The Plant Genome 3: 130–141. Devaux, P., A. Kilian, and A. Kleinhofs, 1995 Comparative mapping of the barley genome with male and female recombination-derived, doubled haploid populations. Mol. Gen. Genet. 249: 600–608. Devos, K. M., and M. D. Gale, 1997 Comparative genetics in the grasses. Plant Mol. Biol. 35: 3–15. Devos, K. M., and M. D. Gale, 2000 Genome relationships: the grass model in current research. Plant Cell 12: 637–646. Doust, A. N., E. A. Kellogg, K. M. Devos, and J. F. Bennetzen, 2009 Foxtail millet, a sequence driven grass model system. Plant Physiol. 149: 137–141. Doyle, J. J., and J. K. Doyle, 1990 Isolation of plant DNA from fresh tissue. Focus 12: 13–15. Gale, M. D., and K. M. Devos, 1998 Plant comparative genetics after 10 years. Science 282: 656–659. Graner, A., A. Jahoor, J. Schondelmaier, H. Siedler, K. Pillen et al., 1991 Construction of an RFLP map of barley. Theor. Appl. Genet. 83: 250–256. Gunter, L. E., G. A. Tuskan, and S. D. Wullschleger, 1996 Diversity among populations of switchgrass based on RAPD markers. Crop Sci. 36: 1017– 1022. Hitchcock, A. S., and A. Chase, 1951 Manual of the Grasses of the United States. United States Department of Agriculture. Miscellaneous Publication No. 200. U.S. Government Printing Office, Washington.
Hirata, M., H. W. Cai, M. Inoue, N. Yuyama, Y. Miura et al., 2006 Development of simple sequence repeat (SSR) markers and construction of an SSR-based linkage map in Italian ryegrass (Lolium multiflorum Lam.). Theor. Appl. Genet. 113: 270–279. Hoarau, J. Y., B. Offmann, A. D’Hont, A. M. Risterucci, D. Roques et al., 2001 Genetic dissection of a modern sugarcane cultivar (Saccharum spp.). I. Genome mapping with AFLP markers. Theor. Appl. Genet. 103: 84–97. Hopkins, A. A., C. M. Taliaferro, C. D. Murphy, and D. Christian, 1996 Chromosome number and nuclear DNA content of several switchgrass populations. Crop Sci. 36: 1192–1195. Jansen, J., A. G. De Jong, and J. W. Van Ooijen, 2001 Constructing dense genetic linkage maps. Theor. Appl. Genet. 102: 1113–1122. Jenczewski, E., M. Gherandi, I. Bonnin, J. M. Prosperi, I. Oliveri et al., 1997 Insight on segregation distortions in two intraspecific crosses between annual species of Medicago (Leguminosae). Theor. Appl. Genet. 94: 682–691. Jia, X., Z. Zhang, Y. Liu, C. Zhang, Y. Shi et al., 2009 Development and genetic mapping of SSR markers in foxtail millet. [Setaria italica (L.) P. Beauv.] Theor. Appl. Genet. 118: 821–829. Johnson, P. C. D., and D. T. Haydon, 2007 Maximum-likelihood estimation of allelic dropout and false allele error rates from microsatellite genotypes in the absence of reference data. Genetics 175: 827–842. Jones, E. S., M. P. Dupal, R. Kolliker, M. C. Drayton, and J. W. Forster, 2001 Development and characterization of simple sequence repeat (SSR) markers for perennial ryegrass (Lolium perenne L.). Theor. Appl. Genet. 102: 405–415. Jung, S., A. Abbott, C. Jesudurai, J. Tomkins, and D. Main, 2005 Frequency, type, distribution and annotation of simple sequence repeats in Rosaceae ESTs. Funct. Integr. Genomics 5: 136–143. Kashi, Y., D. King, and M. Soller, 1997 Simple sequence repeats as a source of quantitative genetic variation. Trends Genet. 13: 74–78. Kosambi, D. D., 1944 The estimation of map distances from recombination values. Ann. Eugen. 12: 172–175. La Rota, M., R. V. Kantety, J. K. Yu, and M. E. Sorrells, 2005 Nonrandom distribution and frequencies of genomic and EST-derived microsatellite markers in rice, wheat, and barley. BMC Genomics 6: 23. Li, P., and T. P. Brutnell, 2011 Setaria viridis and Setaria italica, model genetic systems for the Panicoid grasses. J. Exp. Bot. 62: 3031–3037. Lichten, M., and A. S. Goldman, 1995 Meiotic recombination hotspots. Annu. Rev. Genet. 29: 423–444. Liu, L. L., and Y. Q. Wu, 2011 Identification of a selfing compatible genotype and mode of inheritance in switchgrass. Bioenergy Res. (in press) DOI: 10.1007/S12155-011-9173-z Lu, H., J. Romero-Severson, and R. Bernardo, 2002 Chromosomal regions associated with segregation distortion in maize. Theor. Appl. Genet. 105: 622–628. Lyttle, T. W., 1991 Segregation distorters. Annu. Rev. Genet. 25: 511–557. Martinez-Reyna, J. M., K. P. Vogel, C. Caha, and D. J. Lee, 2001 Meiotic stability, chloroplast DNA polymorphisms, and morphological traits of upland · lowland switchgrass reciprocal hybrids. Crop Sci. 41: 1579–1583. Martinez-Reyna, J. M., and K. P. Vogel, 2002 Incompatibility systems in switchgrass. Crop Sci. 42: 1800–1805. McLaughlin, S. B., and L. A. Kszos, 2005 Development of switchgrass (Panicum virgatum) as a bioenergy feedstock in the United States. Biomass Bioenergy 28: 515–535. Missaoui, A. M., A. H. Paterson, and J. H. Bouton, 2005 Investigation of genomic organization in switchgrass (Panicum virgatum L.) using DNA markers. Theor. Appl. Genet. 110: 1372–1383. Missaoui, A. M., A. H. Paterson, and J. H. Bouton, 2006 Molecular markers for the classification of switchgrass (Panicum virgatum L.) germplasm and to assess genetic diversity in three synthetic switchgrass populations. Genet. Resour. Crop Evol. 53: 1291–1302. Morgante, M., and A. M. Olivieri, 1993 PCR-amplified microsatellites as markers in plant genetics. Plant J. 3: 175–182. Morgante, M., M. Hanafey, and W. Powell, 2002 Microsatellites are preferentially associated with non-repetitive DNA in plant genomes. Nat. Genet. 30: 194–200.
Narasimhamoorthy, B., M. C. Saha, B. Swaller, and J. H. Bouton, 2008 Genetic diversity in switchgrass collections assessed by EST-SSR markers. Bioenergy Res. 1: 136–146. Okada, M., C. Lanzatella, M. C. Saha, J. Bouton, R. Wu et al., 2010 Complete switchgrass genetic maps reveal subgenome collinearity, preferential pairing and multilocus interactions. Genetics 185: 745–760. Paterson, A. H., T. H. Lan, K. P. Reischmann, C. Chang, Y. R. Lin et al., 1996 Toward a unified genetic map of higher plants, transcending the monocot-dicot divergence. Nat. Genet. 14: 380–382. Pinto, L. R., K. M. Oliveira, T. Marconi, A. A. F. Garcia, E. C. Ulian et al., 2006 Characterization of novel sugarcane expressed sequence tag microsatellites and their comparison with genomic SSRs. Plant Breed. 125: 378–384. Pompanon, F., A. Bonin, E. Bellemain, and P. Taberlet, 2005 Genotyping errors: causes, consequences and solutions. Nat. Rev. Genet. 6: 847–859. Porter, C. L., 1966 An analysis of variation between upland and lowland switchgrass, Panicum virgatum L., in central Oklahoma. Ecology 47: 980–992. Preacher, K. J., 2001 Calculation for the chi-square test: an interactive calculation tool for chi-square tests of goodness of fit and independence [Computer software]. Available at http://quantpsy.org. Qu, L., and J. F. Hancock, 2001 Detecting and mapping repulsion-phase linkage in polyploids with polysomic inheritance. Theor. Appl. Genet. 103: 136–143. Quarrie, S. A., A. Steed, C. Calestani, A. Semikhodskii, C. Lebreton et al., 2005 A high-density genetic map of hexaploid wheat (Triticum aestivum L.) from the cross Chinese Spring · SQ1 and its use to compare QTLs for grain yield across a range of environments. Theor. Appl. Genet. 110: 865–880. Remington, D. L., R. W. Whetten, B. H. Liu, and D. M. O’Malley, 1999 Construction of an AFLP genetic map with nearly complete genome coverage in Pinus taeda. Theor. Appl. Genet. 98: 1279–1292. Röder, M. S., V. Korzun, K. Wandehake, J. Planschke, M. H. Tixier et al., 1998a A microsatellite map of wheat. Genetics 149: 2007–2023. Röder, M. S., V. Korzun, B. S. Gill, and M. W. Ganal, 1998b The physical mapping of microsatellite markers in wheat. Genome 41: 278–283. Saha, M. C., R. Mian, J. C. Zwonitzer, K. Chekhovskiy, and A. A. Hopkins, 2005 An SSR- and AFLP-based genetic linkage map of tall fescue (Festuca arundinacea Schreb.). Theor. Appl. Genet. 110: 323–336. Saha, M. C., J. D. Cooper, M. A. Rouf Mian, K. Chekhovskiy, and G. D. May, 2006 Tall fescue genomic SSR markers: development and transferability across multiple grass species. Theor. Appl. Genet. 113: 1449–1458. Saski, C. A., Z. Li, F. A. Feltus, and H. Luo, 2011 New genomic resources for switchgrass: a BAC library and comparative analysis of because genomic regions harboring bioenergy traits. BMC Genomics 12: 369. Schmer, M. R., R. B. Mitchell, and R. K. Perrin, 2008 Net energy of cellulosic ethanol from switchgrass. Proc. Nat. Acad. Sci. USA 1050: 464–469. Semagn, K., Å. Bjørnstad, and Y. Xu, 2010 The genetic dissection of quantitative traits in crops. Electron. J. Biotechnol. 13: 1–45. Stam, P., 1993 Construction of integrated genetic linkage maps by means of a new computer package: JOINMAP. Plant J. 3: 739–744. Talbert, L. E., D. H. Timothy, J. C. Burns, J. O. Rawlings, and R. H. Moll, 1983 Estimates of genetic parameters in switchgrass. Crop Sci. 23: 725–728. Taliaferro, C. M., K. P. Vogel, J. H. Bouton, S. B. McLaughlin, and G. A. Tuskan, 1999 Reproductive characteristics and breeding improvement potential of switchgrass, pp. 147–153 in Biomass, a Growth Opportunity in Green Energy and Value-added Products—Proceedings of the 4th Biomass Conference of the Americas, edited by R. Overend and E. Chornet. Elsevier Sciences, Oxford, UK. Tobias, C., P. Twigg, D. Hayden, K. Vogel, R. Mitchell et al., 2005 Analysis of expressed sequence tags and the identification of associated short tandem repeats in switchgrass. Theor. Appl. Genet. 111: 956–964. Tobias, C. M., D. M. Hyden, P. Twigg, and G. Sarath, 2006 Genic microsatellite markers derived from EST sequences of switchgrass (Panicum virgatum L.). Mol. Ecol. Notes 6: 185–187. Tobias, C. M., G. Sarath, P. Twigg, E. Lindquist, J. Pangilinan et al., 2008 Comparative genomics in switchgrass using 61,585 high-quality expressed sequence tags. Plant Genome 1: 2.
Volume 2 March 2012 |
Genetic Linkage Map of Switchgrass |
369
U.S. Department of Energy, 2011 U.S. Billion-Ton Update: Biomass Supply for a Bioenergy and Bioproducts Industry, led by R. D. Perlack and B. J. Stokes. ORNL/TM-2011/224. Oak Ridge National Laboratory, Oak Ridge, TN. Van Ooijen, J. W., 2006 JoinMap 4, Software for the Calculation of Genetic Linkage Maps in Experimental Populations. Kyazma BV, Wageningen, The Netherlands. Varshney, R. K., A. Graner, and M. E. Sorrells, 2005 Genic microsatellite markers in plants: features and applications. Trends Biotechnol. 23: 48–55. Vogel, K. P., and J. F. Pedersen, 1993 Breeding systems for cross-pollinated perennial grasses. Plant Breed. Rev. 11: 251–274. Vogel, K. P., G. Sarath, A. J. Saathoff, and R. B. Mitchell, 2011 Switchgrass, pp. 341–380 in Energy Crops, edited by N. Halford and A. Karp. The Royal Society of Chemistry, Cambridge, UK. Wang, Y. W., T. D. Samuels, and Y. Q. Wu, 2011 Development of 1,030 genomic SSR markers in switchgrass. Theor. Appl. Genet. 122: 677–686. Wendel, J. F., M. D. Edwards, and C. W. Stuber, 1987 Evidence for multilocus genetic control of preferential fertilization in maize. Heredity 58: 297–302. Wolfe, K. H., 2001 Yesterday’s polyploidization and mystery of diploidization. Nat. Rev. Genet. 2: 333–341. Wu, K. K., W. Burnquist, M. E. Sorrells, T. L. Tew, P. H. Moore et al., 1992 The detection and estimation of linkage in polyploids using singledose restriction fragments. Theor. Appl. Genet. 83: 294–300.
370 |
L. Liu et al.
Wu, R., C. X. Ma, I. Painter, and Z. B. Zeng, 2002 Simultaneous maximum likelihood estimation of linkage and linkage phases in outcrossing species. Popul Biol. 61: 349–363. Wu, Y., and Y. Huang, 2006 An SSR genetic map of Sorghum bicolor (L.) Moench and its comparison to a published genetic map. Genome 50: 84–89. Xu, Y., L. Zhu, J. Xiao, N. Huang, and S. R. McCouch, 1997 Chromosomal regions associated with segregation distortion of molecular markers in F2, backcross, doubled haploid and recombinant inbred populations of rice (Oryza sativa L.). Mol. Gen. Genet. 253: 535–545. Young, H. A., B. J. Hernlem, A. L. Anderton, C. Lanzatella-Craig, and C. M. Tobias, 2010 Dihaploid stocks for switchgrass isolated by a screening approach. BioEnergy Res. 3: 305–313. Zalapa, J. E., D. L. Price, S. M. Kaeppler, C. M. Tobias, M. Okada et al., 2011 Hierarchical classification of switchgrass genotypes using SSR and chloroplast sequences: ecotypes, ploidies, gene pools, and cultivars. Theor. Appl. Genet. 122: 805–817. Zhang, Y., J. E. Zalapa, A. R. Jakubowski, D. L. Price, A. Acharya et al., 2011 Post-glacial evolution of Panicum virgatum: centers of diversity and gene pools revealed by SSR markers and cpDNA sequences. Genetica 139: 933–948.
Communicating editor: K. Dawe