Int J Technol Des Educ (2007) 17:55–73 DOI 10.1007/s10798-006-9007-z ORIGINAL PAPER
A learning methodology using Matlab/Simulink for undergraduate electrical engineering courses attending to learner satisfaction outcomes Mario J. Dura´n Æ Sergio Gallardo Æ Sergio L. Toral Rocı´o Martı´nez-Torres Æ Federico J. Barrero
Received: 12 January 2006 / Accepted: 5 July 2006 / Published online: 4 January 2007 Ó Springer Science+Business Media B.V. 2006
Abstract Learner-centred approaches follow the prevailing tendency in modern University reforms which are primarily concerned about ‘‘how people learn’’. The methodologies can be learner-centred in the sense of placing the student as the main actor of the teaching–learning process by increasing his interactivity and participation, but also considering what is relevant for the student by measuring the learner satisfaction. In order to promote both aspects, this paper proposes a synchronous software-based active methodology that makes use of the simulations to show a virtual scenario to the students and challenge them to predict and discuss the evolution of the scenario. The proposed methodology improves the visual interface, promotes discussion both among students and with the teacher in a brainstorming stage and shows real-world examples. This software-based methodology has been implemented into an Electric Machinery course at the University of Seville (Spain), and the evaluation has been carried out considering both the affective and cognitive domains. Principal components analysis proves to be useful to highlight the dimensions with a higher influence on learner satisfaction and the affective and cognitive results confirm the successful implementation of the proposal. Keywords Educational technology Æ Electrical engineering Æ Electric machines Æ Learner satisfaction and software-based methodology Abbreviations EHEA European higher education area IE Industrial engineering
M. J. Dura´n (&) Æ S. Gallardo Æ S. L. Toral Æ F. J. Barrero Electrical Engineering Department, University of Seville, Camino de los Descubrimientos S7N, Seville 41092, Spain e-mail:
[email protected] R. Martı´nez-Torres Business Administration and Marketing Department, University of Seville, Avda San Francisco Javier S/N, Seville 41005, Spain
123
56
CE CON UI EOU EAM UPI PE S SBM
Int J Technol Des Educ (2007) 17:55–73
Chemical engineering Content User interface Ease of use Enthusiasm and motivation User participation and initiative Previous experience Satisfaction Software-based methodology
Introduction The notion of learner-centred education has been in existence for a long time (Alfassi, 2004; Jones & Compton, 1998). Nevertheless, it is recently that this concept is re-emerging due to reforms that are to be implemented in 2010 in the European countries (inside the European higher education area, EHEA). Learner-centred practices move the focus from the teacher to the student, paying more attention to the learning performance rather than the instruction methodology. Instruction based on learner-centred framework provides opportunities for learners to draw on their own experiences and interpretations of the learning process (Kathy, 2004; Said, 2005; Wagner & McCombs, 1995). These practices regard learning as a life-long process rather than as a process which takes place only through youth-adulthood, which follows the trend of the majority of current Higher Education reforms (Joint Declaration of the European Ministers of Education, 1999; Toral et al., in press). According to this approach, learning is viewed as a natural and constructive process. Furthermore, if the learning is more meaningful and relevant to the student, the teaching efficiency is also increased. This is particularly important in subjects with a high load of practical works (where the skills and abilities of learners should be improved), especially when the students get involved in the learning process assuming responsibilities (Lambert & McCombs, 1998). Learner-centred methodologies usually place the student as the main actor of the teaching–learning process by increasing his interactivity and participation, proposing activities where the teacher acts as a guide in the students’ constructive process. However, the teaching process should be centred not only on the learners’ activities, but also on the learner satisfaction considering what is relevant for the student. In fact, learner satisfaction becomes a more general concept which includes interactivity and participation as one of the aspects of satisfaction. From this approach, the learner satisfaction measurement is the evaluation function that guides a closed-loop process (shown in Fig. 1) of educational innovation and improvement. The starting point for the present proposal is to improve the learner satisfaction by implementing a novel methodology in a subject called ‘‘Electric machines and installations’’, at the University of Seville, Spain. This subject embraces an area of knowledge that presents well-known difficulties in undergraduate level courses (Ayasun & Nwankpa, 2005; Daniels & Shaffer, 1998; Domnisoru, 2005; Drofenik & Kolar, 2002; Jurado, Acero, Carpio, & Castro, 2000; McInerny, Stern, & Haskew, 1999; Nehrir, Fatehi, & Gerez, 1995; Nigim & Delyser, 2001). The
123
Int J Technol Des Educ (2007) 17:55–73
57
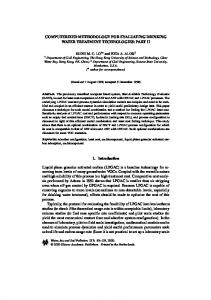
Fig. 1 Mechanism of teaching methodology improvement
students have usually problems to get a clear picture of the main concepts when traditional teaching methodologies (based on theoretical chalk-and-board lectures) and laboratory sessions (based on hands on instruction) are implemented. The technical and mathematical content is high and students are prone to concentrate only in variables and expressions and forget about the main concepts and physical principles. The experience of several authors indicates that students generally have difficulty when they come to the laboratory to carry out the experiments even though the corresponding theory has been extensively covered in the classroom section with a detailed handbook describing laboratory facilities and the procedure of the experiments (Ayasun & Nwankpa, 2005; Striegel & Rover, 2002). Additionally, students’ capability for thinking, analyse and solve problems is frequently ignored in conventional teaching leading to low degree of motivation and interaction. Therefore, the initial aim was to improve existing difficulties increasing the learning satisfaction (Fig. 1) with no additional time, spatial or economic resources for the sake of general applicability of the methodology. The implemented methodology is software-based and uses Matlab/Simulink software package to create virtual scenarios from real-world situations. The novel structure presents higher practical content and improved interface, inside an active methodology that is also synchronous, favouring the interaction and teacher feedback (Powers, Burrows, & Powers, 2001). The analysis of the results obtained with the new approach fully confirms the improvement both on the learner satisfaction by enhancing the most relevant dimensions and in the affective and cognitive domains. A detailed description of the proposed software-based methodology (SBM in what follows and in Fig. 1) is included in the first section, while the description of the implementation course and groups is exposed in the second section. Third section deals with the methods of data collection and analysis, and the results are presented in the fifth section both for the affective and cognitive domains. Finally, the dis-
123
58
Int J Technol Des Educ (2007) 17:55–73
cussion and most relevant conclusions are exposed in the sixth and seventh sections, respectively.
Description of the proposed methodology The starting premise for the educational innovation is the improvement of the theoretical explanations considering the dimensions with a high influence on learner satisfaction, as shown in Fig. 1. Additional restrictions are the proposal of a new methodology without the need of additional spatial, time or economic resources. In this way the proposed methodology can be a useful tool for any subject regardless of the existing resources. On the one hand the dimension regarding ‘‘content’’ can be enhanced by including more practical and real-world situations. On the other hand, the dimensions regarding ‘‘ease of use’’ and ‘‘user interface’’ can be enhanced by improving the way in which the content is presented to the students, searching for a friendly and simple interface. Based on these considerations, a novel software-based methodology (SBM) is designed to achieve learner satisfaction, using virtual scenarios for the theoretical explanation inside an interactive methodology. The proposal follows a SBM in theoretical classes, accordance with practical lessons based in project-based methodologies (Helle, Tynja¨la¨, & Olkinuora, 2006). The idea is to bring up a real situation and simulate it, creating a virtual scenario from a real-world experience. The inclusion of scenarios based on selected real-world examples improves the content by linking the theoretical concepts with the practical applications. These scenarios are simulated with Matlab/Simulink including photographs of real elements to enhance the interface. The insertion of these virtual scenarios (confined to the theoretical lessons) allows the students to visualize both the physical elements (e.g. multi-meter, induction machine) and the evolution of the most relevant variables, as a previous training for lab sessions. The following steps are followed in the proposed methodology: 1. Brief explanation of the chapter structure. Presentation of the chapter’s content, contextualizing the problem and explaining the importance of the topic and the industrial applications. 2. Presentation of the scenario. A real-world situation is presented and the evolution of the scenario is presented as a challenge to be solved after the explanation of the chapter. 3. Explanation of the main concepts of the chapter. The main theoretical explanation is provided as a necessary condition to understand the proposed scenario. 4. Challenge the students to predict the scenario evolution. Once the students know the fundamentals, it is the time to challenge them to predict what is going to occur in the proposed scenario. 5. Brainstorming and collection of ideas. The students discuss in groups about evolution of the proposed scenario. The teacher mixes with the students and solves the doubts that may arise, guiding the learner’s discussion. At the end of this discussion, the ideas from the different groups are collected and commented. 6. Simulation visualization. It is not the teacher but the simulations that show the students if their predictions were correct or not. The visual aid eases the understanding of the physical meaning of some phenomena.
123
Int J Technol Des Educ (2007) 17:55–73
59
7. Discussion and theoretical explanation. Finally, the collected ideas are contrasted with the simulation results, emphasizing the main conclusions and reviewing the theoretical explanation of the phenomena showed in the simulation stage. Different scenarios can be proposed in the same chapter designing each one to explain certain parts of the chapter. Consequently, the whole process can be repeated as many times as necessary to improve the understanding of different concepts previously established. This SBM integrates the simulations inside the lecturing, making the designed scenario the centre of the gravity of the chapter. Furthermore, the simulations are not used just as demonstrations, but are included inside a methodology that promotes students’ interactivity and participation. As a case example, the educational innovation has been applied in the chapter regarding the induction motor which usually presents problems already described in ‘‘Introduction’’. Following the previously presented steps, the chapter is introduced emphasizing the similarity with the previously explained transformer chapter, pointing out the practical importance and real applications of the induction motor. Then, the real scenario of an induction machine which is connected to the mains with no load, assuming negligible friction, can be presented as the first scenario (the real situation is shown in Fig. 2a). This scenario is designed to explain the principles of operation of the induction machine and is presented to the students before the explanation of some basic concepts (e.g. motor slip, equivalent circuit). Then students are challenged to think about what is going to occur in the proposed scenario with the motor speed, rotor currents, electrical torque, stator currents and the rest of relevant variables. In this stage, the students start to discuss the problem and the teacher goes down the platform and mixes with the students, easing the breakage of the teacher-centred concept and providing some clues to the students depending on the direction of the discussion. It must be noted that the group size and length of the theoretical lessons are restricted and remains the same than in traditional teaching (it would need degree re-structuring). The students can discuss in groups at this stage instead of facing the blackboard during the whole class. With the proposed methodology the interaction, both among the students and with the teacher, is increased compared to
Fig. 2 Real scenario of a machine connected to the mains with (b) and without (a) load torque applied to the shaft
123
60
Int J Technol Des Educ (2007) 17:55–73
traditional methodology. The real experience shows a high activity and enthusiasm in the students during this brainstorming stage which is completed when all points of view are finally collected. Once the students have had the opportunity of thinking and predicting the behaviour of the machine in the presented scenario, the simulation is run with the screen divided in several scopes, allowing the visualization of the most relevant variables. Although the course just covers steady-state equations, the motor is simulated in the time domain so that the students can also visualize the transients properly. The scenario is simulated using Matlab/Simulink, as shown in Fig. 3, with ideal sinusoidal voltage source to emulate the mains and zero load torque and friction coefficient. The motor model has been masked, and a photograph has been placed on it for didactic reasons. All the time-domain equations are inside the motor model block. The simulation provides a visual aid that is fundamental to understand several concepts. They have the chance to see, as shown in Fig. 4, how the rotor currents decrease gradually to zero and the machine reaches the synchronous speed due to the presented scenario with no friction or load. After the visualization of the simulation, the results are compared with the students’ predictions and the explanation of some phenomena is made, reinforcing relevant concepts. For example, the students are asked for the explanation of the high value of stator currents in the connection to the mains (this is a phenomenon which is not usually predicted in the brainstorming stage). The theoretical explanation is carried out showing the relation with the equivalent circuit and with the fact that the slip is still one because the motor is at standstill (Chapman, 2005). Once the simulation results have been analysed and discussed, another scenario or a change in the former one is proposed. The students are asked to evaluate the behaviour of the system in the new scenario. For instance, what happens if a load (e.g. a water pump) is connected to the shaft and a torque is applied to the induction machine. This scenario is useful to explain the induction motor torque characteristic and the stability of the machine. In this moment, the seven steps previously commented are repeated again presenting new concepts and reinforcing the ones explained in the previous scenario. In this second scenario the students can visualize how the rotor currents appear to provide the necessary electrical torque or realize that the motor speed is reduced and the slip is increased.
INDUCTION MOTOR Stator voltage (V) 60/(2*pi)
Va w Vb
In1
Induction motor speed (rpm) & field pulsation
is ir
Vc In2
Te omega2
Load torque (Nm)
Stator currents (A) Rotor currents (A)
Time-domain three-phase InductionMotor Model Electrical torque & Load torque (Nm)
Fig. 3 Matlab/Simulink scheme of the simulated machine for the first scenario
123
150 100 50 0 -50 -100 -150 -200 0
0.02 0.04 0.06 0.08
0.1
61
3500 3000 2500 2000 1500 1000 500 0 0
1
Time (s)
2
3
4
5
Electricaland load torque ( Nm)
Stator voltage (V)
200
Motor andfield speed (rpm)
Int J Technol Des Educ (2007) 17:55–73
6 5 4 3 2 1 0 -1 0
1
8
2
3
4
5
4
5
Time (s)
Time (s) 10
1
4 2 0 -2 -4 -6 -8
0.8
5
Slip
Stator currents(A)
Rotor currents (A)
6
0
-5
1
2
3
Time (s)
4
5
0.4 0.2
-10 0
0.6
0 0
1
2
3
4
5
Time (s)
0
1
2
3
Time (s)
Fig. 4 Simulated results of relevant variables for two proposed scenarios
Apart from the explanation of several concepts, the proposed methodology can be used to enhance the students’ attitude and understanding of the laboratory sessions if the proposed scenario is similar to the real situation in the lab. It would be ideal to develop this methodology inside the lab so that theoretical, simulated and practical parts are explained simultaneously. However, this not possible due to the number of students attending the course and so the simulations serve as an intermediate step between the theory and the experimental part of the subject. This practical part allows ‘‘hands-on’’ work and a final contact with the real elements previously introduced in the virtual scenarios. Additionally, the students have the chance to contrast the simulated and experimental results, which is of great formative value.
Description of the implementation course and groups The present methodology has been implemented in a subject named ‘‘Electrical Machines and Installations’’ which is lectured both in the third course of Industrial Engineering (IE) degree and in the fourth course of Chemical Engineering (CE) degree at the University of Seville, Spain. The experience has been carried out in the CE group, which is considered as the experimental group, while the IE students form the control group. Both groups have a similar background and the content and methodology in both courses is the same. Inside the experimental group, part of the subject regarding the transformer (so-called part 1) has been lectured with traditional teaching while another part of the subject concerned with the induction motor (so-called part 2) is lectured with the proposed SBM. The results from parts 1 and 2
123
62
Int J Technol Des Educ (2007) 17:55–73
are called pre- and post-implementation cases, and their results are obtained with the same students, teacher, background and spatial and time resources. Consequently, it is only the methodology and the content that changes from cases 1 to 2. Inside control group the structure of the subject (content, traditional methodology, material resources, subject planning and evaluation) is the same than in the experimental group but the teacher and group’s natures changes compared to the experimental group. The average number of students attending the subject is around 250 considering both IE and CE students. The subject has 6 credits, including 8 h of practical lessons and 52 h of theoretical lessons, which are lectured on the evenings for CE students and in the morning for IE students during the same semester. The aim of the subject is to provide a clear picture of relevant parts of the electrical system, and so both electrical machines and installations are placed inside the curriculum of the same subject. The idea for the IE degree is to introduce the students into the main concepts that will be detailed and reinforced in several and more specific subjects if they finally select the Electrical Engineering speciality. In the case of the CE degree, the objective is to provide the basic concepts and tools for students that will not have any additional contact with electrical engineering subjects. Because of the previous reasons, the different topics are not studied in depth but trying to provide the student with the following concepts: 1. General description of the power system. The main ideas of generation, transmission and distribution are explained, providing the students a brief picture of the present state and the different components of the system. 2. Electrical machines. In this part of the subject the transformer and the induction machines are studied because of the importance in the transmission and consumption of the electric energy. Both machines are studied showing constructive aspects, principle of operation, steady-state equations and equivalent circuits, no-load and short-circuit tests and calculation of the machine performance based on the previously developed models. 3. Installations. Once the machine’s part of the subject is covered, the calculation of cables and the modes of operation of usual protections for distribution networks are explained. Emphasis is made in the main concepts of the different criteria for the selection of cables and protections and real but simple calculations are explained using manufacturer’s data. 4. In the last part of the subject basic concepts about reactive power compensation and electric fares are explained. At the end of the subject the students are prepared to solve basic problems that include the transformation centre, the distribution cables and different over-current protections and the induction machine at the end of the energy chain. The practical part of the subject includes the following practices: 1. Transformer and induction motor lab practice. A distribution transformer is shown to the students indicating the different parts already studied in the theoretical part. No-load and short circuit tests are carried out with a mono-phase transformer and the operation principle of induction machines is shown (creation of Tesla’s field).
123
Int J Technol Des Educ (2007) 17:55–73
63
2. Real problems related with induction machine application. The students are trained to handle manufacturer data and solve a real application of an induction machine driving a water pump. 3. Calculation of an installation. The calculation of the different elements of an installation are done both theoretically and using commercial software from well-know electrical companies. The teaching methodology used for the theoretical lessons is mainly based on chalk-and-board explanations using slides that show all the information at the same time. Each chapter is divided in theory and problems which are explained sequentially, following a traditional teacher-centred methodology. Although some efforts were made to increase the students motivation and understanding by bringing real elements (small machines, cables, fuses, etc.), contextualizing the problems and pointing out the importance of the different elements, the applied methodology continuous presenting some of the problems already described (Ayasun & Nwankpa, 2005; Daniels & Shaffer, 1998), related to the students’ attitude and understanding. The evaluation of the subject is the same for both IE and CE students and it is based on the lab reports and on a final exam that includes a theoretical part (test and short questions) and two problems. This evaluation method is the common procedure in present engineering subjects, and also follows a traditional pattern that will also need to change in the near future to fit the EHEA requirements.
Method of data collection and analysis Methods of data collection In order to obtain information in the affective and cognitive domains, both a questionnaire and a test were designed and distributed among the students enrolled in the Electrical Machines and Installations courses (both in IE and CE groups). The questionnaire consisted of 39 questions/items (items in what follows) which should be scored using 1–7 Likert type scale (1 = strongly disagree, 7 = strongly agree). All of them are frequently reported in the literature (Toral, Barrero, Martı´nez-Torres, Gallardo, & Lillo, 2005; Wang, 2003). On the other hand, a cognitive test was also distributed to the same students including five questions associated to five different parts of the theoretical explanations. Both the questionnaire and the cognitive test were distributed in the control and experimental groups in the next class after the end of the chapter explanation. Special emphasis was made in the voluntary and anonymous nature of the test and in the fact that it did not affect at all the final score of the subject. Once the test where given to the students, the teacher went out of the class so that the students felt free to answer sincerely. They finally collected all the tests and left them in the table. Affective dimension analysis The affective dimension analysis is carried out considering the results from the distributed questionnaire and enables the teacher to measure the learner satisfaction using principal components analysis (Rencher, 2002). Traditionally, the user satisfaction measurement has been used to assess information and management systems,
123
64
Int J Technol Des Educ (2007) 17:55–73
including classroom teaching in traditional educational contexts (Doll, Raghunathan, Lim, & Gupta, 1995; McHaney, Hightower, & Pearson, 2002; McHaney, Hightower, & White, 1999; Wang, 2003). This measurement cannot be evaluated using a single-item scale, such as global satisfaction, and it should incorporate different aspects of electronic-learner (e-learner) satisfaction to become a useful diagnosis instrument. This is carried out implementing principal component analysis and following the steps listed below: 1. 2. 3. 4.
Select the learner satisfaction dimensions (based on previous experience). Verify the questionnaire reliability (considering the Cronbach’s alpha index). Obtain the correlation of principal components of each dimension. Identify the most relevant dimensions to achieve learner satisfaction.
It must be noted that the analysis of the affective domain is carried out considering only the experimental group both with traditional and proposed teaching. The reason is that the internal variations in the group can be neglected since both in the pre and post case the background, group’s nature, teacher and spatial and time resources remain the same, so that the subsequently improvements can be associated to the proposed methodology. This is confirmed since the pre- and post-tests in the control group show differences below 3% in the mean value for all dimensions. Cognitive dimension analysis Although the methodology was designed based on the affective domain analysis through learning satisfaction measurement (as shown in Fig. 1), it is likely to obtain a cognitive achievement associated to the affective domain improvement. Consequently, a test was designed to evaluate this cognitive domain based on representative questions of the different parts of the theoretical explanation (constructive aspects, principle of operation, equivalent circuits, transformer regulation/power and torque in IM and transformers in parallel/IM starting). The questions were taken form real exams and were passed to the students just in the next class after the end of the chapter, so that the results show what could be grasped just during the classes. The authors made an effort to create similar questions for both chapters, with a similar structure and difficulty. Nevertheless, there are important differences compared to the affective domain case that makes cognitive evaluation a difficult task. First of all, the creation of the cognitive test is itself a challenge, and it is complex to achieve equal difficulty in two different tests. Furthermore, the difficulty of different chapters is inherently different. Second, the cognitive level of two groups of students can also be different. In order to make a scientific analysis for the cognitive evaluation, the relevant variables have been adimensionalized to obtain a proper comparison. The results from the experimental and control groups are denoted with ‘‘E’’ and ‘‘C’’ subscripts, and the chapter with traditional and proposed teaching methodology are termed ‘‘1’’ and ‘‘2’’, respectively. Four results can be examined, so-called RC1, RC2, RE1 and RE2. According to this nomenclature, the difference between the two groups can be obtained from the ratio: Rg ¼
123
RE1 RC1
ð1Þ
Int J Technol Des Educ (2007) 17:55–73
65
where the chosen chapter has been the transformer, since the same methodology was implemented in both experimental and control groups. If the difference between the two chapters is to be established, the following ratio can be defined: Rimp ¼
RE2 RE1
ð2Þ
where the experimental group has been considered because it is the group with a change in the methodology in chapters 1 and 2. Additionally, the difference in the control group can also be defined as Rcont ¼
RC2 RC1
ð3Þ
This parameter was very close to one (maximum difference of 3%) in the affective domain case as previously exposed, but will present important differences in the cognitive domain as it will be shown later on. Finally, since there are always differences both in the groups and chapters, the improvement of the proposed methodology can be properly calculated using the following adimensional parameter: RT ¼
Rimp RE2 RC1 ¼ Rcont RE1 RC2
ð4Þ
which is robust to the changes in the group’s nature or chapter difficulty.
Results of the new teaching methodology Affective dimension results This section exposes the affective dimension results both for the pre- and postimplementation questionnaires. They are summarized in the same table separating the results with a line, always indicating the pre-test results in the first place and the post-test results in the second place (i.e. in the format ‘‘pre|post’’). As a first step in the analysis, different dimensions must be theoretically and operationally defined to assess the extent and specific nature of learner satisfaction. According to (Wang, 2003), learner satisfaction is stimulated by several focal aspects, such as content, learner interface, learning community and personalization. In (Doll & Torkzadeh, 1988; Doll, Xia, & Torkzadeh, 1994), an instrument for measuring end-user computing satisfaction was proposed. They developed an instrument that consisted of four dimensions: ease of use, content, accuracy, format and timeliness. In some other studies new dimensions were added. For instance, assessment centred instruction was highlighted in (Greenberg, Delgutte, & Gray, 2003). This dimension includes opportunities for both formative and summative assessment, allowing students to reflect on what they already know, to receive feedback, to try again after appropriate review, and to demonstrate their understanding of the material. Overall responsibility and user control were considered in
123
66
Int J Technol Des Educ (2007) 17:55–73
Table 1 Influencing dimensions on learner satisfaction Content User interface User participation and initiative
Enthusiasm and motivation Previous experience Ease of use
(Bagchi, Kanungo, & Dasgupta, 2003) as a measurement of user participation and involvement. Finally, interactivity has also been claimed as an important dimension of user satisfaction (Kettanurak, Ramamurthy, & Haseman, 2001; Khalifa & Lam, 2002). According to these prior studies, the dimensions in Table 1 have been considered to assess the influence on learner satisfaction dimension, and a survey based on these dimensions has been applied to the subject already described in the previous section. Once the dimensions are determined, the next step is to verify the questionnaire reliability to guarantee that the proposed set of items always provide consistent and reliable responses, even if they were replaced with other similar questions. Cronbach’s alpha index (a reliability index associated with the variation accounted for by Table 2 Validated survey based on the learner satisfaction dimensions for the pre- and postimplementation test including only the items which provide consistent responses Dimension (reliability) Content (0.8282|0.8078)
Item (correlation item-dimension)
I1 I2 I3
User interface (0.7495|0.7031)
I4
I5
Ease of use (0.7175|0.8142)
I6 I7 I8
Enthusiasm and motivation (0.8294|0.8798)
I9 I10 I11
User participation and initiative (0.7571|0.8740)
I12 I13
Previous experience (0.7449|0.7431)
I14 I15
Satisfaction (0.6946|0.7614)
I16
I17
123
My understanding level after the work is good (0.5879|0.5792) The material needed for the work is clear and sufficient (0.8018|0.7143) The delivered material for the work is useful for learning the concepts related to this work (0.6866|0.6934) The available tools and resources for implementing the practical work are appropriate for the successful implementation of the required work (0.5994|0.5422) Learning performance is improved due to the variety of equipments and devices used during the required work (0.5994|0.5422) The work can be easily performed (0.6320|0.8035) The required knowledge for the work implementation is adapted to the students’ formative level (0.6514|0.7458) Time supplied for implementing the work is appropriated (0.3830|0.4851) The motivation infused by the instructors to learn the material is high (0.7353|0.6646) I enjoy during the work implementation (0.8154|0.8050) The realization of the work is a motivating experience (0.5405|0.8478) I participate every time is possible (0.6092|0.7762) I assume responsibilities in the assembly and test of the work (0.6092|0.7762) The work always improves my learning performance (0.5934|0.5912) The quality of the similar work realized in the past was high (0.5934|0.5912) Overall, I consider the implementation of this work a positive experience for improving my learning performance (0.5321|0.6147) The available material for the work are good (0.5321|0.6147)
Int J Technol Des Educ (2007) 17:55–73
67
the true score of the ‘‘underlying dimension’’ which shows how well a set of items measures a single latent dimension) was used. This coefficient ranges from 0 to 1. The higher the score is, the more reliable the generated scale is. A value above 0.7 is an acceptable reliability coefficient, although lower thresholds are sometimes used in the literature (Chin, 1998). As a result of the reliability analysis, 22 items of the original questionnaire were rejected (those that more negatively affect the Cronbach’s alpha value of the underlying dimension). Table 2 shows the final questionnaire formed by the 17 items that passed the reliability analysis, both for the pre- and post-implementation results. The values of alpha are under the dimension between brackets and the inter-item correlations associated to each item, are shown in Table 2. The number of students who answered the questionnaire was around 85 (with a slight difference in the pre- and post-test), and the mean and standard deviation for the results obtained in the experimental group both in the pre- and post-test are exposed in Table 3, together with the increment in the mean value. It can be noted that the increment is positive in 14 of 17 items, showing a good acceptance of the proposed methodology. Furthermore, only one item (I8) has a negative value above 1.5%. These items should be considered as an input in the closed-loop scheme in Fig. 1. In order to compare the mean values obtained with traditional and proposed methodology, Wilcoxon’s matched pairs test has been used. The strength of this test relies on the fact that it is non-parametric, i.e. no assumption is made about any particular kind of distribution of the samples. Results are detailed in Table 4. The ‘‘Asymp. Sig. (2-tailed)’’ is larger than 0.05 for items I6, I7, I14 and I15. In those items the null hypothesis can not be rejected. However, for the rest of the items (the most important ones in order to evaluate the effectiveness of the proposed teaching methodology) it is less than 0.05 and the differences in the mean value are significant, so the null hypothesis can be rejected. In order to analyse the improvements in terms of dimensions instead of items, the information exposed in Table 3 can be mapped to obtain the results in each of the dimensions exposed in Table 1. These results are summarized in Table 5. Table 3 Mean value and standard deviation for the selected 17 items in pre- and postimplementation
I1 I2 I3 I4 I5 I6 I7 I8 I9 I10 I11 I12 I13 I14 I15 I16 I17
Mean (traditional|proposed)
SD (traditional|proposed)
3.87|4.19 3.26|3.84 3.46|3.71 4.17|4.64 3.24|4.48 4.0|4.43 3.78|3.73 5.04|4.6 4.34|4.53 3.65|3.94 3.75|4.03 3.21|3.5 2.87|3.3 5.56|5.48 4.73|5.1 5.6|5.28 4.12|4.12
1.58|1.06 1.59|1.61 1.3|1.35 1.61|1.46 1.44|1.63 1.65|1.18 1.75|1.37 1.11|1.45 1.9|1.66 1.52|1.53 1.8|1.62 1.62|1.47 1.36|1.25 1.36|1.11 1.62|1.08 1.22|1.16 1.36|1.48
Mean increment (%) 8.27 17.8 7.23 11.27 38.27 10.75 – 1.3 – 8.7 4.38 7.95 7.4 9.1 15 – 1.4 7.83 5.7 0
123
68
Int J Technol Des Educ (2007) 17:55–73
Table 4 Wilcoxon signed ranks test Z I1 I2 I3 I4 I5 I6 I7 I8 I9 I10 I11 I12 I13 I14 I15 I16 I17
– – – – – – – – – – – – – – – – –
a
Based on positive ranks
b
Based on negative ranks
Asymp. Sig. (2-tailed) 2.851a 3.672a 2.298a 4.313a 2.738a 0.491a 1.117b 2.008a 4.241a 2.854a 3.960a 2.283a 2.257b 1.712a 1.584a 2.157a 1.957a
0.004 0.000 0.022 0.000 0.006 0.623 0.264 0.045 0.000 0.004 0.000 0.022 0.024 0.087 0.113 0.031 0.050
Table 5 Learner satisfaction evolution with the proposed teaching methodology
Traditional (1–7) Proposed (1–7) Increment (%)
CON
UI
EOU
EAM
UPI
PE
4.08 4.57 12
4.26 5.5 29
4.88 5.07 4
4.77 5.13 7.5
2.79 3.47 24
4.52 4.7 4
However, the information included in Tables 3 and 5 provide information related to each item or dimension, but not about the degree in which an item or a dimension influences the learning satisfaction. This is of great importance for curriculum redesign since it allows understanding which dimensions should be reinforced. In order to do this, multivariate statistics provides a useful tool when variables are coupled. One of the difficulties inherent in multivariable statistics is the problem of visualizing multidimensionality to understand the data set by considering the group of variables together, rather than focusing on just one variable at a time. Fortunately, in data sets with many variables, groups of variables often move together. One reason for this is that more than one variable may measure the same driving Table 6 Correlations of principal components of each dimension CON
UI
EOU
CON 1.00 0.74| – 0.61 0.45|0.69 UI 0.74| – 0.61 1.00 0.38| – 0.52 EOU 0.45|0.69 0.38| – 0.52 1.00 EAM – 0.62|0.36 – 0.46| – 0.41 – 0.41|0.59 UPI 0.25|0.53 0.16| – 0.18 0.31|0.35 PE 0.03|0.31 0.16| – 0.34 – 0.25|0.31 S – 0.51|0.66 – 0.49|0.59 – 0.33|0.45
123
EAM
UPI
PE
S
– 0.62|0.36 0.25|0.53 0.03|0.31 – 0.51|0.66 – 0.46| – 0.41 0.16| – 0.18 0.16| – 0.34 – 0.49|0.59 – 0.41|0.59 0.31|0.35 – 0.25|0.31 – 0.33|0.45 1.00 – 0.46|0.26 0.24|0.68 0.28|0.25 – 0.46|0.26 1.00 – 0.16|0.28 0.01|0.25 0.24|0.68 – 0.16|0.28 1.00 0.12|0.12 0.28|0.25 0.01|0.12 0.12|0.16 1.00
Int J Technol Des Educ (2007) 17:55–73
69
principle, governing the behaviour of the system. In many systems there are only a few of such driving forces. Principal components analysis is a quantitative and rigorous method for achieving this simplification (Rencher, 2002). The method generates a new set of variables, called principal components. Each principal component is a linear combination of the original variables. All the principal components are orthogonal to each other so that there is no redundant information. The principal components as a whole form an orthogonal basis for the data space. Applying principal component analysis to the set of collected data, it is possible to reduce the number of variables used to represent the dimensions. Using the reduced data set represented by each principal component, the correlations of these principal components with the learner satisfaction can be evaluated. These correlations, shown in Table 6, can be used to hypothesize the relationships among dimensions, showing those ones with a significant influence on the learner satisfaction. Cognitive dimension results In the qualitative test shown in Table 2, the affective domain was measured showing a good acceptance of the proposed methodology, especially in the dimensions with a higher influence on learner satisfaction. Now the quantitative test can determine if the improvement in the affective dimensions has also an influence in the cognitive domain. The tests were passed to the same groups than the qualitative tests; the results are shown in Table 7 and Fig. 5. Table 7 provides information about the different aspect that are measured in the cognitive test, but it is of great interest to obtain the adimensional parameter presented in the previous section in order to obtain representative and robust results. These results are exposed in Table 8.
Discussion The proposed SBM aims to increase the students’ interactivity and participation and improve the dimensions with a higher influence on the learner satisfaction. The improvements in the affective domain are likely to entail benefits in the cognitive dimensions and so both domains are explored. Regarding the affective domain, the dimensions with a higher influence on learner satisfaction have been selected and shown in Table 1. The influence of each Table 7 Results of the quantitative test
Constructive aspects Principle of operation Equivalent circuit TF regulation/IM power and torque TF in parallel/IM starting Total score
Test E1
Test E2
Test C1
Test C2
0.76 0.64 0.52 0.23 0.58 0.55
0.65 0.7 0.6 0.45 0.45 0.57
0.75 0.33 0.38 0.29 0.5 0.45
0.41 0.5 0.45 0.37 0.29 0.4
123
70
Int J Technol Des Educ (2007) 17:55–73
0.8 0.7 0.6 0.5 0.4 0.3 0.2 0.1 0
Test E1
Test E2
Test C1
Test C2
Constructive aspects
Principle of operation
Equivalent TF regulation / TF in parallel / Total score circuit IM power and IM starting torque
Fig. 5 Quantitative test results for the different items
Table 8 Adimensional parameters of the quantitative test
Constructive aspects Principle of operation Equivalent circuit TF regulation/IM power and torque TF in parallel/IM starting Total score
Rg
Rimp
Rcont
RT
1.01 1.94 1.37 0.79 1.29 1.22
0.85 1.094 1.15 1.957 0.776 1.04
0.55 1.5 1.185 1.276 0.58 0.89
1.56 0.73 0.974 1.534 1.34 1.166
dimension is evaluated through a qualitative questionnaire shown in Table 2, that has filtered the items with proper reliability (based on Cronbach’s alpha index). The results are shown both for pre- and post-implementation cases in the experimental group, corroborating the validity of the selected items for the questionnaire. In order to determine the dimensions with a higher influence on learner satisfaction (to assure that the obtained improvements have a real influence in the students), it is necessary to consider Table 6 that shows the relationship among dimensions and the influence of these dimensions on the satisfaction (last row and column of the table). It can be concluded that ‘‘content’’, ‘‘user interface’’ and ‘‘ease of use’’ dimensions have a significant influence on learner satisfaction (it makes no difference to be a positive or a negative correlation, as principal component analysis is performing a linear transformation in the data space). The determination of these dimensions is of great importance not only to evaluate the obtained improvements but also to guide in the curriculum design continuous process shown in Fig. 1. Apart from the dimensions with a higher influence on learner satisfaction, it is necessary to determine the improvements obtained with the proposed methodology. The mean value and standard deviation of the final 17 items are shown in Table 3 for both pre- and post-implementation cases showing a good acceptance of the proposed methodology in general terms. In order to evaluate the improvement in the different dimensions obtained with the principal components analysis (instead of considering only the items), Table 5 shows the mean value of the items (scored from 1 to 7) included in each dimension. The results are shown both for the traditional teaching and for the proposed methodology, showing the increment in the percentage value of the principal components analysis dimensions. The increment is positive for all different dimensions, showing a good acceptance of the educational innovation. The dimensions regarding ‘‘content’’ and ‘‘user interface’’, targeted as two of the most
123
Int J Technol Des Educ (2007) 17:55–73
71
influencing points in Table 5, obtain an improvement of 12% and 29%, respectively. Furthermore, the improvement obtained for these dimensions is significative as it can be observed from the results of the Wilcoxon’s matched pairs test in Table 4. Although statistical analysis does not provide cause relations (results must be filled with meaning), it is likely that these improvements are due to the inclusion of realworld examples in the scenarios, and because of the enhanced interface and visual aid provided by the simulations. Since these dimensions are among the most influencing ones (Table 6), the obtained improvement verifies the adequacy of the proposal to get an increased learner satisfaction. Another dimension with a noticeable improvement is ‘‘user participation and initiative’’ (24%), result of the use of interactive methodologies (both between students and with the teacher) while discussing the proposed scenarios. This point is of great importance since the starting value is the lowest (2.79) of all dimensions (the other dimensions are all over 4), probably result of the traditional teacher-centred methodology. This confirms the success of the active methodology and has a high formative value, since it promotes, apart from technical learning, the development of cross-capacities that are fundamental for engineers. Finally, the other dimensions obtain a lower (but positive) improvement, showing an increase in the enthusiasm and motivation of the students. As far as cognitive domain is concerned, the results of the cognitive test are shown in Table 7 and Fig. 5, but it is not straightforward to compare the results and extract proper conclusions since the improvements in the experimental group can be due to he proposed methodology but also to other factors such as different difficulty in the chapters or in the test. Consequently, these results are transformed into adimensional parameters shown in Table 8. From the values obtained for the adimensional parameter Rimp, one can realize that the results improve in three from the five questions of the quantitative test, obtaining worse results for the questions related to the constructive aspects and the transformer in parallel or induction machine starting. Nevertheless, the difficulty of the questions is not the same as it can be noticed from the results of parameter Rcont. With the same methodology in the two chapters, the results for the control group show that some questions were more difficult in the second test and some of them were easier for the students. It is of interest that the same questions that show low values for Rimp (first and fifth questions), obtain even worse results in the control group, and the final value of RT for these questions is over one showing and improvement in the cognitive domain. The final values for RT show that the improvement is not achieved in the second question, while the results are nearly neutral for the third question. The other three questions show an improvement in the understanding of these concepts reaching values over 1.5. The mean value of RT is finally 1.166, showing a global improvement in the understanding of the main concepts of the chapter.
Conclusions Both traditional learning performance and the adaptation to the next educational space (EHEA), suggest the need for educational innovation. The novel methodology proposed in this work is not defined a priori, but is the result of a closed-loop process where the analysis of the subject is a previous step to the design of the new strategies.
123
72
Int J Technol Des Educ (2007) 17:55–73
The novel software-based teaching methodology proposes the inclusion of realworld examples and applications with an improved interface. This is carried out using Matlab/Simulink-based virtual scenarios that emulate the real case providing a visual aid of both the real elements and the evolution of the main variables. This tool is used following an interactive methodology that promotes the discussion and brainstorming both among students and with the educator. Furthermore, the proposed methodology proves to be easy to develop and implement without deep changes in the curriculum and without any financial support. It does not require additional credits or material/spatial resources and it is a synchronous methodology favouring the feedback and interaction. The proposal has been evaluated both in the cognitive and affective domains. Regarding affective domain, a measurement technique based on principal component analysis has been presented and has proved to be reliable, checking the Cronbach’s alpha index to obtain representative results. Furthermore, the analysis of the traditional subject provides the different dimensions and their influence on the learner satisfaction. The consistency of this analysis is corroborated since the posttest results highlight the same relevant dimensions than the pre-test results. Comparative analysis from the results before and after the inclusion of the novel methodology verifies the good acceptance of the methodology, obtaining an improvement in all different dimensions and especially in dimensions that previously proved to have a great influence on students’ satisfaction. This improvement can be attributed to the inclusion of real examples and the use of simulations shown in real-time during the lecture. Moreover, the participation and initiative, that showed very low values in traditional teaching, is promoted with the present proposal. It can be noted that the interaction is eased with the present methodology, reinforcing crosscapacities that have a great formative value for the student. For the cognitive evaluation, an adimensional technique is presented that aims to be robust against changes in the group’s nature or content difficulty. The results show that the increased satisfaction leads to a global improvement in the cognitive domain, confirming the successful implementation of the methodology in the University of Seville, Spain.
References Alfassi, M. (2004). Effects of a learner-centred environment on the academic competence and motivation of students at risk. Learning Environments Research, 7, 1–22 Ayasun, S., & Nwankpa, C. O. (2005). Induction motor tests using MATLAB/Simulink and their integration into undergraduate electric machinery courses. IEEE Transactions on Education, 48, 37–46 Bagchi, S., Kanungo, S., & Dasgupta, S. (2003). Modeling use of enterprise resource planning systems: A path analytic study. European Journal of Information Systems, 12, 142–158 Chapman, S. J. (2005). Electric machinery fundamentals. McGraw-Hill Chin, W. W. (1998). The partial least squares approach for structural equation modelling. In G. A. Marcoulides (Ed.), Modern methods for business research. Mahwah, NJ: Erlbaum, pp. 295–336 Daniels, M. W., & Shaffer, R. A. (1998). Re-inventing the electrical machines curriculum. IEEE Transactions on Education, 41, 92–100 Doll, W. J., Raghunathan, T. S., Lim, J. U., & Gupta, Y. P. (1995). A confirmatory factor analysis of the user information satisfaction instrument. Information Systems Research, 6(2), :177–189 Doll, W. J., & Torkzadeh, G. (1998). The measurement of end-user computing satisfaction. MIS Quarterly, 12(2), 259–274
123
Int J Technol Des Educ (2007) 17:55–73
73
Doll, W. J., Xia, W., & Torkzadeh, G. (1994). A confirmatory factor analysis of the end-user computing satisfaction instrument. MIS Quarterly, 18(4), 453–461 Domnisoru, C. (2005). Using MATHCAD in teaching power engineering. IEEE Transactions on Education, 48(1), 157–161 Drofenik, U., & Kolar, J. W. (2002). Modern and intuitive way of teaching space vector calculus and PWM in an undergraduate course. Proceedings of Power Conversion Conference, 1, 305–310 Greenberg, J. E., Delgutte, B., & Gray, M. L. (2003). Hands-on learning in biomedical signal processing, IEEE Engineering in Medicine and Biology Magazine, 71–79 Helle, L., Tynja¨la¨, P., & Olkinuora, E. (2006). Project-based learning in post-secondary education—theory, practice and rubber sling shots. Higher Education, 51, 287–314, Springer Joint Declaration of the European Ministers of Education (1999). The european higher education area—Bologna declaration, Bologna, June 19, 1999 Jones, A., & Compton, V. (1998). Towards a model for teacher development in technology education: From research to practice. International Journal of Technology and Design Education, 8, 51–65 Jurado, F., Acero, N., Carpio, J., & Castro, M. (2000). Using various computer tools in electrical transients studies’’, 30th annual frontiers in education conference, 2000. FIE 2000. 2: F4E/17F4E/22 Kathy, L. S. (2004). Learner-centered principles in teacher-centered practices? Teaching and Teacher Education, 20, 833–846 Kettanurak, V., Ramamurthy, K., & Haseman, W. D. (2001). User attitude as a mediator of learning performance improvement in an interactive multimedia environment: An empirical investigation of the degree of interactivity and learning styles. International Journal of Human-Computer Studies, 54, 541–583 Khalifa, M., & Lam, R. (2002). Web-based learning: Effects on learning process and outcome, IEEE Transactions on Education, 45 Lambert, N. M., & McCombs, B. L. (1998). Introduction: Learner-centered schools and classrooms as a direction for school reform. In N. M. Lambert, & B. L. McCombs (Eds.), How students learn: Reforming schools through learner centered education (pp. 1–22). Washington, DC: American Psychological Association McHaney, R., Hightower, R., & Pearson, J. (2002). A validation of the end-user computing satisfaction instrument in Taiwan. Information and Management, 39(6), 503–511 McHaney, R., Hightower, R., & White, D. (1999). EUCS test–retest reliability in representational model decision support systems. Information and Management, 36(2), 109–119 McInerny, S. A., Stern, H. P., & Haskew, T. A. (1999). Applications of dynamic data analysis: A multidisciplinary laboratory course. IEEE Transactions on Education, 42, 276–280 Nehrir, M. H., Fatehi, F., & Gerez, V. (1995). Computer modeling for enhancing instruction of electric machinery. IEEE Transactions on Education, 38, 166–170 Nigim, K. A., & DeLyser, R. R. (2001). Using MathCad in understanding the induction motor characteristics. IEEE Transactions on Education, 44, 165–169 Powers, J., Burrows, J., & Powers, S. (2001). Using the case method in distributed environments opportunities and challenges. 17th annual conference on distance teaching and learning Rencher, A. C. (2002). Methods of multivariate analysis, Wiley series in probability and statistics, (2nd ed.). John Wiley and Sons Said, H. (2005). Learner-centered web-based instruction in software engineering. IEEE Transactions on Education, 48, 99–104 Striegel, A., & Rover, D. T. (2002). Enhancing student learning in an introductory embedded systems laboratory, 32th annual frontiers in education conference, 2002, FIE 2002, 1: T1D-7-T1D-12 Toral, S. L., Barrero, F., Martı´nez-Torres, M. R., Gallardo, S., & Lillo, J. (2005). Implementation of a web-based educational tool for digital signal processing teaching using the technological acceptance model. IEEE Transactions on Education, 48, 632–641 Toral, S. L., Martı´nez-Torres, M. R., Barrero, F., Gallardo, S., Vargas, E., & Gonza´lez, V. (in press). Planning a master’s level curriculum according to career space recommendations using concept mapping techniques. International Journal of Technology and Design Education Wagner, E. D., & McCombs, B. L. (1995) Learner centered psychological principles in practice: designs for distance education. Educational Technology, 35(2), 32–35 Wang, Y. (2003). Assessment of learner satisfaction with asynchronous electronic learning systems. Information ad Management, 41, 75–86
123