A LogP Extension for Modeling Tree Aggregation Networks Taylor Groves, Samuel K. Gutierrez, and Dorian Arnold Department of Computer Science University of New Mexico Albuquerque, NM, USA tgroves, samuel,
[email protected]
Abstract—As high-performance systems continue to expand in power and size , scalable communication and data transfer is necessary to facilitate next generation monitoring and analysis. Many popular frameworks such as MapReduce, MPI and MRNet utilize scalable reduction operations to fulfill the performance requirements of a large distributed system. The structures to handle these aggregations may simply consist of a single level with children reporting directly to the parent node, or it may be layered to create a large tree with varying breadth and height. Despite their common-place, the techniques for modeling these Tree Aggregation Networks (TANs) are lacking. This paper addresses this need by introducing a novel extension of the LogP framework for Tree Aggregation Networks. Our TAN model adheres to the simplicity of the LogP model, but utilizes structural insights to provide a simple yet precise performance estimate. Additionally, our model makes no assumptions of the underlying NIC transfer mechanisms or uniformity of tree breadth, making it suitable for a wide range of environments. To evaluate our TAN model, we compare it against the traditional LogP model for predicting the performance of the Multicast Reduction Network (MRNet) framework. Keywords-performance modeling; LogP; trees; reduction; collective communications; TAN; MRNet;
I. I NTRODUCTION Distributed systems continue to grow in size and complexity – the largest systems now containing upwards of 3 million cores and tens of thousands of nodes [1]. With so many application processes interacting simultaneously, monitoring and analysis frameworks require structured methods of communication, such as the reduction operations seen in MapReduce [2], MRNet [3], and MPI. Internally, these reduction operations can be thought of as trees, transforming data as it progresses from leaf nodes to a root node. We refer to such networks as tree aggregation networks (TAN). For our purposes, a TAN is a reduction tree such that a set of leaf nodes are connected to a root node directly or indirectly via a set of optional internal nodes, where these internal nodes perform partial reductions. As these aggregation networks become more commonplace, several questions arise including “How can we precisely model the TAN performance?” and “How can we design topologies that promote efficient operations for a given set of leaf nodes?” The primary goal of this paper is to introduce a new performance model for tree aggregation networks. However,
this work makes several contributions by providing: • • •
A novel extension of LogP for non-uniform tree aggregation networks with or without contention A framework (MRNetBench) for deriving model parameters for MRNet A case study for a TAN performance model on a real system
When developing a performance model it is important to find a balance between the accuracy of the model and its ease of use. Our approach for a TAN performance model is one that focuses on four characteristics: • •
•
Accuracy - Our model closely matches the performance seen on real machines. Generality - The parameters of our model are representative of the important underlying hardware characteristics, yet are simple enough that the model translates across multiple architectures and applications. Compositional - Our model is compositional in nature. Developed from the ground up, its constituent parts can be dissected at any level.
Some of the characteristics above may conflict (such as Accuracy and Generality), but a well developed model will find the right compromise between these characteristics. In many ways, the canonical LogP [4] model strives for similar goals and we use it as the foundation of our TAN model, such that latency, overhead, gap and the number of processing units all are incorporated into this work. However, our work expands on the basic LogP parameters, adding height and fanout as additional parameters. Unlike the LogP model, we recognize the significance of contention that is inherent to reduction operations and account for this when calculating overhead. In the next section, we discuss background and related work. In Section III, we describe the model in detail and discuss the significance each parameter. Aftewards, we describe how the parameter values are derived in Section IV. This is followed by Section V, in which we present a comparison of our model, the LogP model and the observed performance of MRNet, the TAN prototype we use in this study. Finally, we conclude the paper in Section VI and highlight future work.
II. R ELATED W ORK A. Performance Models In 1993, LogP was introduced as a framework for building accurate models of parallel computations [4]. The work focused on the most significant parameters that could be used to deliver a model that could reveal important bottlenecks without making the analysis of interesting problems intractable. Four parameters were introduced in the original model: latency, overhead, gap and processing units. The work has since become the foundation for many other models of parallel computation. Several notable extensions of the LogP model have been introduced throughout later years. In the LogGP model [5], Alexandrov et al. introduce an additional parameter which better models long messages. This has been followed by other works [6], [7] that examine how as message size changes, communication protocols may switch to create different performance classifications. The LoGPC [8] and LoPC [9] extensions both incorporate the effects of contention, though LoGPC focuses on network contention, while LoPC incorporates contention in the message processing facilities. The LoPC model includes the effect of message processing overhead, however it assumes an underlying queue handles the messages. With this assumption, Little’s Result, Bard’s Approximation and Mean Value Analysis are used to approximate queue length and time to handle a message. Our model differs from LoPC by making no assumption about the underlying protocols or NIC transfer method. More recently Hoefler, et al. [10] introduced the LogGOP model which has two important distinctions from the previous models. The first is that the model keeps CPU overhead and network gap separate, to model potential communication/computation overlap. The other extension of LogGOP is that overhead is measured as a per-byte cost rather than a constant cost. The main distinctions between the TAN model and previous models is that the TAN model is flexible enough to represent the effects of contention and that it is tailored to accurately represent the structural characteristics of trees. While this work doesn’t model the effects of varying message sizes for gap, or overhead, the TAN model could easily be extended in a manner similar to previous work to support these ideas. III. M ODEL A. Architectural Assumptions Our TAN model represents systems which have a one to one mapping of physical nodes to tree processes. While, a single TAN process per node is generally conservative of current architectures, extending our model to multicore/multi-process architectures would requires collecting model parameters in two groups, one for inter-node modeling and one for intra-node modeling. With this adjustment,
the model would remain mostly unchanged. We reserve such an extension for future work. Another constraint of our TANs is that a process does not fulfill multiple roles within the topology. For example, a back-end or leaf process may not transition to a front-end or root process after pushing its data into the network. While there exists models and workload optimizations for this type of network [11], it is beyond the scope of our current work. Furthermore, there are scenarios, such as a pipelined workflows, where this assumption of static roles makes the most sense. A final assumption of our model is that the architecture is uniform across the nodes of a system. For example, if one node in the system has a message co-processor, all the nodes in the system have a message co-processor. This enables our model to derive the performance characteristics for the entire system by sampling the performance of a subset. In most high performance systems, this is a reasonable expectation. Despite these constraints, our model relaxes several assumptions of previous models. We do not make any assumption about the topology of the TAN, such that our model handles both simple and complex trees including those of non-uniform fan-out. Additionally our model is able to capture contention in message processing overhead as well as in the interconnect. Another feature of the TAN model is that it does not make any assumptions of the underlying NIC transfer method, whereas several previous models are forced to assume an interrupt driven, RDMA or polling mechanism. B. Model Parameters These four parameters are included in most LogP based performance models, though they have been slightly modified to better represent TANs and the effects of contention. L: latency is measured as an median of the time or cycles taken to send a message from a source processor to target processor. o(x): message processing overhead is a period of time which a processor is working to transmit or receive a message with respect to the fanout of that node (x). In the absence of a dedicated communication processor, work cannot be done by the processor during this transmission or receipt. g: the gap is defined as the minimum interval between sending or receiving consecutive messages by a processor. Gap is the reciprocal of bandwidth, such that g = 1/bandwidth. P: is defined in our work as the number of processes. This is not an explicit parameter of our model but is incorporated by taking the height and fanout of the tree into account. In the original LogP paper [4], latency is defined as the upper bound on latency, or delay, incurred in communicating a message containing a word or (or small number of words) from its source module to its target module. We differ from
70000 60000
Time to completion (us)
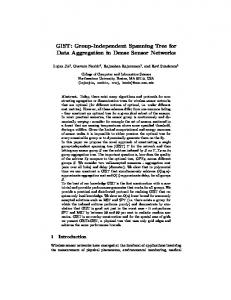
LogP by utilizing the average rather than an absolute upper bound. We found on real world machines, that the upper bound did not properly represent typical performance. Real world techniques for measuring latency, are often effected by noise such as congestion, changes in route, connection establishment protocols, hardware affinity, or DNS lookups. While, network jitter is visible in our work, we save exploring it in depth for future work. Particularly, with regards to reduction operations, we found network jitter to be more important at lower fanout and less important at higher fanout. For the systems we used, at low fanout network jitter is responsible for an error of ± 4 percent of the overall model while at high fanout, where communication overhead is greater, this error becomes an order of magnitude less significant. The authors of LogP state that they expect overhead costs will disappear as architectures improve. While this has become true of some current architectures [12] and workloads, in our environment message processing overhead was the largest contributor to performance costs. Furthermore, we include results in Figure 1, showing that while modern communications methods may have little overhead in the absence of contention, message processing overhead grows to become the dominating factor in communication performance as the number of participants increases. Specifically, Figure 1 shows the time it takes to complete N-to-1 communication operations over Infiniband, for three varying packet size of 1KB, 12KB, and 131KB as we increase the value of N. Five runs of these experiments were performed using Netgauge [13] on the Cab cluster (whose technical specifications are outlined below). Because the latency in an N-to-1 operation occurs in parallel, we can attribute the increase in cost to message processing overhead contention. This figure shows how performance cost is minuscule when reduction operation contains a low number of participants, but as the number of participants grow, message processing overhead becomes a non-trivial cost. We have elected to ignore network gap in Section IV, since overhead is a significantly larger cost. If a user wishes to distinguish between gap and overhead, this could be easily accomplished in a manner similar to previous LogP models. Another difference between our parameters and that of LogP is that we model overhead as a function of fanout (x). This enables us to model the effects of contention, whereas the original LogP model cannot. Similar to LogP, we do not explore how varying message size effects the performance of our model. If we elected to do so, extending the model in a manner similar to [5]–[7] would be applicable. Additionally, by keeping the message sizes at 1 KB, we stay well under the maximum throughput of the system. We leverage the structural properties of TANs by incorporating two additional parameters to the LogP model: y: the height is denoted by an implicit variable y, which represents number of hops needed to tra-
Time to complete an N-to-1 communication (Netgauge) 1024(B) 12288(B) 131072(B)
1024(B) 12288(B) 131072(B)
50000 40000 30000 20000 10000 00
10
20
30
N
40
50
60
70
Figure 1. We compare the cost of N-to-1 communication operations for varying packet sizes over Infiniband. It is clear that contention becomes the bottle-neck in communication costs as the number of participants increase.
verse the tree from the farthest leaf to the root node. x: the fanout is denoted by the variable x which is a measure of the number of children directly linked to a parent node. Height is implicitly built into our model by its recursive structure. This is discussed further in in Section III-C. Fanout is explicitly built into the TAN model, denoted as (x) at each level of the tree. In later sections it will become apparent how we derive the function o(x). C. The TAN Model The composite model is given as follows: Ti = L + o(x + 1) + g + max(Tchild ), (i ∈ N,
i 6= leaf )
(1)
Tleaf = C In this model Ti is the time to process the wave up to node i ∈ N, i 6= leaf . Tchild represents the time to process the wave for a child of i. Tleaf represents our base case in our recursive model, with the parameter C representing constant ”one-time” costs. These are costs that only occur once for a given tree, independent of height or fanout. This model is applied recursively to give an accurate estimation of performance. Pipelining, or steady state throughput simplifies the model in that one-time costs can be ignored and we can remove the recursive structure from the model above. Assuming a sufficiently large number of waves, the height of the tree is amortized and the model becomes: T = L + max(oi (x + 1)) + g, i ∈ N
(2)
To determine the time taken to process w waves (for a sufficiently large w), we simply multiply our model by w. For
the scope of this paper we evaluate non-pipelined workflows and include the pipelined model variant for completeness’ sake.
100 Histogram of Latency on the Cab Cluster 80
To test the performance prediction of the TAN model, we generate model parameter values for latency, communication overhead, and application overhead on the Cab cluster at Lawrence Livermore National Labs. We do this through a 3 stage processes where we first measure latency using Netgauge framework. Second, we model the performance of our communication framework, the Multicast Reduction Network (MRNet) [3] , using an application we developed, called MRNetBench. The following subsections provide and in depth discussion of the methodology and reasoning used to generate our model parameter values. Throughout the course of this paper, unless stated explicitly, the unit of measurement is seconds. We include all the parameter values from our experiments in Table I. The Cab cluster at Lawrence Livermore is 1,200 node cluster, where each node consists of a 16-core Intel Xeon E5-2670. Each node has 32 GB of memory and runs the TOSS 2.0 operating system. The entire cluster is connected via a InfiniBand QDR (QLogic) interconnect. The scale of our experiments is limited to 256 nodes, this being the maximum allocation allowed without special reservation or administrative processes for releasing acquired data. While larger trees are interesting, they consist of compositions of smaller trees. For instance 2 million nodes leaf nodes might consist of three levels of nodes with 128 fanout. While we leave large scale runs to future work, our model is a constructive one, such that there are no technical hurdles to applying the model to these scales.
Bin size
IV. D ETERMINING PARAMETER VALUES OF THE MODEL
60 40 20 040
60
80
100 120 140 Latency (us)
160
180
Figure 2. Histogram of 500 latency samples using two hosts on the Cab Cluster. A single outlier of 672 microseconds was removed for the presentation of this figure.
Cab contains two sockets. From this sample the maximum, average, minimum and standard deviation for latency was 0.672, 0.098, 0.059, and 0.030 ms, respectively. Even though reduction operations rely on the slowest participant for performance, 0.672 ms was not representative of typical network performance. Because of this, we assign L, in our model, the value representing the average latency. On Cab this value was 0.098 ms. For our set of experiments the gap of the system is ignored. We can ignore the cost of g in our system because the cost of communication overhead is significantly more expensive, especially as contention increases with fanout of the tree.
A. Determining latency
B. Determining communication overhead
In order to generate the latency values for the TAN model, we need to perform a small set of experiments using Netgauge. Netgauge an open source framework for implementing network benchmarks. The Netgauge framework offers a wide variety of communication patterns and protocols and has been used in a large number of publications for determining network performance. We calculate latency characteristics of the system by selecting 2 nodes at random. For this pair of nodes, we run Netgauge using the distt mode and TCP over IB protocol. We use the TCP over IB protocol because this is representative of the applications we use for validation. Netgauge samples the round trip time 500 times between the two nodes. In Figure 2, a histogram of the latency shows that the distribution is clearly bimodal. One possible reason for this bimodal behavior could be the selection of the core/socket to process incoming and outgoing packets relative to the core utilized by the application. This behavior has been observed in previous work [14], [15] and is further supported by the fact that
After the value of latency is determined we must determine the value of communications overhead. For the purposes of this research, we will be using MRNet as our communications framework. MRNet is a software overlay network which provides multicast and reduction communications for parallel and distributed systems. To evaluate the performance of MRnet we developed a MRNet benchmarking application – MRNetBench. MRNetBench was designed to enable researchers to test aspects of performance for a wide variety of TAN topologies and filters. The application allows the user to specify the packet size, filter duration, frequency, and synchronization mode. Filter duration is approximated by performing k iterations of matrix multiplication repeatedly until the specified duration has been reached. For our experiments we utilize an empty MRNetBench filter so that we can isolate the communication overhead and latency costs. Additionally, MRNetBench provides 3 modes of operation: synchronous, timed, and number of waves. In synchronous mode, the root and leaf processes
are synchronized using NTP so that leaf processes send a communication wave to the root process simultaneously. In the timed mode there is an initial synchronization, but subsequent waves are sent without explicit synchronization attempts. Waves continue to be pushed through the system according to the specified frequency for the duration of the timer. In number of waves mode, the root node requests the leaves to initiate an aggregate communication and records the round trip time required. MRNetBench is a relatively simple application in practice, but it is an example of the type of framework necessary for deriving parameters for LogP based models. When measuring the time it takes to complete a aggregate communication, there are two possible approaches. The first approach is to use properly synchronized clocks to schedule the communication operation in the near future and then take the difference from the end and start times (MRNetBench synchronous mode). The advantage of this method is that the leaf nodes initiate the communication simultaneously. The downside to this approach is that it relies heavily on the synchronization of each participant’s clocks. The second approach is to initiate the aggregation from the root node and record the round trip time (MRNetBench number of waves mode). This approach benefits from relying on only a single clock, but it includes the additional latency and communication overhead costs which must be subtracted. We tried both methods and found that the method utilizing round trip time and relying on a single clock had significantly less noise. The noise from the synchronized approach was so significant that even with the extra latency and overhead costs, the round trip approach resulted in a faster recorded time. For these reasons, we measure a communication operation using the round trip time approach. In order to account for the extra latency and overhead costs associated with the round trip approach, we make the assumption the scatter and reduction operation are symmetrical and divide the round trip time result by two. The cost of communication overhead is determined through two sets of experiments: chain and N-to-1. These runs measure the time to process a wave for an increasing height and fanout, respectively. The purpose of the chain experiments is to derive per-level and any one-time costs in the model, y and C respectively. N-to-1 experiments utilize data from the chain experiments and then perform regression analysis to derive remaining coefficients for the communications overhead function. In both runs, leaf nodes send 11 waves of reduction operations. We discard the first wave because the performance is an order of magnitude worse due to bootstrapping costs that are not a part of this model. The following two subsections describe each experiment and how we combine them into a communications overhead function. 1) The Chain Experiment: In this experiment, we use MRNet to measure the time it takes to process a wave as we increase tree depth. The tree is a chain topology, such that
Figure 3.
Illustration of a ”chain” topology.
each node has a single child. An example of this topology is seen in Figure 3. We limited the height to 32, since a binary tree of height 30 represents over 1 billion processes. In practice, a TAN topology would likely not exceed a height of 30 on even the largest systems. In MRNet we set timers to record the time a communication operation begins at the leaf node and ends at the root node. This is collected 10 times at each depth from a height of 1, to a height of 32. After we collect this information, we use our previously determined value for L and multiply it by the depth of the tree. This is essentially the number of hops times the latency. We then subtract this value from each respective data point. Because there are two overhead operations at each level (one send and one receive), we divide each value by 2 so that we are left with just the communication overhead cost. By performing a simple regression analysis on the data of Figure 4, we are able to derive a per-level overhead, and any one-time costs. This analysis generates the value of b in the function y = a + bx. Our simple linear regression provided an estimate of y =4.93×10⁻⁵ x seconds and a value of 0 for a, with a coefficient of determination R2 = 0.89 for the linear regression. We believe this value of R2 is sufficient for our model, but in future work we will explore more accurate methods of representing latency and system noise. If the coefficient a had mapped to a value greater than 0, we would have assigned this to the one-time cost C in the model. We label the value which we derived for b as a perlevel communication overhead, and incorporate it the subsection that follows. 2) The N-to-1 Experiment: The goal of this second experiment is to isolate and extract the communication overhead with respect to the fanout (x) of a root node. This is
0.0040
Communication overhead in a N-deep chain (MRNet)
0.0035
Communication overhead (s)
0.006
Communication overhead (s)
0.0030 0.0025
0.005
0.004
0.0020
0.003
0.0015
0.0010 0.0005 0.00000
Communication overhead in an N-to-1 tree (MRNet)
0.007
0.002 0.001
5
10
15
N
20
25
30
35
Figure 4. Time taken to process a single wave in a chain topology over an increasing number of internal tree processes.
0.0000
20
40
60
N
80
100
120
140
Figure 6. Communication overhead (MRNet) for a single wave in a N-to-1 topology over an increasing number of leaf processes. Table I M ODEL PARAMETER VALUES ( S ) L oMRNet g C
Figure 5.
Illustration of a ”N-to-1” topology.
accomplished by measuring the time it takes to process a wave in a N-to-1 topology as we increase the value of N. An N-to-1 topology is a tree which consists of only a root and leaf nodes such that the leaves are directly connected to the tree root. An example can be seen in Figure 5. First we subtract the latency and a single per-level overhead cost (leaf node send) from the data. Then, similar to the chain experiment, we perform a regression analysis on data seen in Figure 6. When comparing the results to a linear, logarithmic and quadratic fit, the best fit for this data was a quadratic fit. By finding the best fit for the equation, y = bx + cx2 , we are simply deriving the cost of overhead relative to the fanout of the topology. the value derived for the coefficients b and c are 7.83×10⁻⁷ and 1.57×10⁻⁷ seconds, respectively. The coefficient of determination, R2 for this experiment was 0.90. Following this second analysis, we have all the coefficients necessary to fully model the communication overhead of our model. The values derived for these coefficients and the one time overhead, are all combined in Table I as oMRNet . If the data from the N-to-
9.8×10⁻⁵ 4.93×10⁻⁵ + 7.83×10⁻⁷ (x) + 1.57×10⁻⁷ (x2 ) N/A N/A
1 experiment had been linear, logarithmic or exponential, the same process would apply, with the least significant coefficient being populated by values derived for latency and per-level overhead. In conclusion to this section we include all the parameters of our TAN model into Table I. These parameter values are specific to the Cab cluster, such that if we desired to model an additional system, we would need to derive that system’s parameter values as well. V. C OMPLEX T OPOLOGY VALIDATION In order to evaluate the performance of our model, we compare the accuracy of the TAN model and the original LogP model for the MRNet framework. The purpose of these experiments is to show the accuracy of the TAN model for predicting communication performance and to evaluate when the TAN model may be beneficial in lieu of the traditional LogP approach. The only difference between the parameters values of the LogP Model and the TAN model in our experiments is the calculation of message processing overhead. In the case of LogP, we assign the overhead the value derived from the chain experiments, whereas in the TAN model, overhead is represented by a more complex function. In these validation experiments, we tested the performance of two sets of topologies. The first set of topologies consist of trees with 32 leaf nodes and a varying internal structure. Specifically, the four trees in
0.0020 0.0015 0.0010 0.0005 0.0000
el -lev o w t 32-
mia bino 2 3
l
bina 32-
ry
to 32-
-1
0.014 Time to complete a communication (s)
Time to complete a communication (s)
0.0035 Evaluation of TAN communication model (32 leaves) Observed TAN 0.0030 LogP 0.0025
Evaluation of TAN communication model (128 leaves) Observed TAN LogP
0.012 0.010 0.008 0.006 0.004 0.002 0.000
el
-lev
-two 128
-b 128
ial
inom
-b 128
y
inar
1 -to-
128
Figure 7. Time to process a single communication wave for 4 varying topologies, each with 32 leaf nodes.
Figure 8. Time to process a single communication wave for 4 varying topologies, each with 128 leaf nodes.
this set are: an unbalanced two-level tree, such that the root node has 6 children, of which have either 5 or 6 leaf nodes as children, a binomial tree, a binary tree, and a N-to-1 tree. The second set of topologies consist of trees with 128 leaf nodes and an internal structure similar to the first set. Specifically, the four trees in this set are: an unbalanced twolevel tree, such that the root node has 11 children, of which have either 11 or 12 leaf nodes as children. a binomial tree, a binary tree, and a N-to-1 tree. These topologies are representative of tall/thin (binary), short/fat (n-to-1), balanced (2-level), and skewed (binomial) configurations. Our choice in this variety demonstrates the models applicability to a range of configurations. In both sets of experiments we take the average of 10 runs for each topology to represent the observed performance.
contention becomes more significant as fanout increases, the TAN model provides a better estimate than LogP and matches the observed performance with greater precision than that of the experiments involving 32 leaf nodes. Of the TANs tested with 128 leaves, the two level topology significantly outperforms all other topologies. These experiments validate the accuracy of the TAN model and show how it can facilitate the design of efficient topologies. In the context of analyzing application performance, the power of the LogP model is the flexibility it provides, so that communication overheads may be separated from application overheads. The TAN model still provides this important functionality, but additionally allows the performance to be further deconstructed, so that topology effectiveness can be evaluated on a per-level basis even for topologies with non-uniform branching. This flexibility facilitates efficient topology design, scheduling of workflows, and the resolution of localized bottlenecks.
A. Evaluation of Communication Modeling. In Figure 7 and Figure 8, we compare performance of complex topologies without considering application overhead. In Figure 7, the best results for the TAN model were achieved predicting shallow trees. This is not surprising, given the relatively high value for the coefficient of determination for the experiments that generated the values for message processing overhead. LogP’s best case match of observed performance was for the binary tree. This is because a binary tree is the topology most similar to a chain topology and it is the topology that experiences the least amount of contention for message processing. That being said, the TAN model provides a closer approximation of the observed performance in every single case. Of the TANs tested with 32 leaves, the best performing were the two level and the 32-to-1 topologies. In the experiments with 128 leaf nodes we begin to see the cases where the TAN model really shines. Because
VI. C ONCLUSION AND F UTURE W ORK In this work we have extended the LogP model by introducing the TAN model. This model considers the affects that contention may have on performance and provides a fine grained approach for predicting the performance of reduction operations in tree aggregation networks. In order to test our approach we developed a benchmarking tool (MRNetBench) for the MRNet framework. We then used this tool to show how model parameters could be extracted from a simple set of two experiments. Our model shows a significant improvement in performance prediction versus the standard LogP model for all of the topologies tested. Furthermore, this paper provides insight about the performance of reduction operations at a scale of 256 nodes of the Cab cluster at Lawrence Livermore National Labs.
In future work we would like to improve the accuracy of our model, particularly for topologies of depth. We believe this can be accomplished by performing a in depth study of latency variation and network jitter, so that we may more accurately represent it in our model. Future work will also examine the performance effects of having more than one TAN process per physical node. An additional objective is incorporating our model and the MRNet framework with power or performance monitoring systems, to build efficient data distribution topologies at scale. R EFERENCES [1] Top500, “Top 500 http://www.top500.org/, 2015.
supercomputer
sites,”
[2] J. Dean and S. Ghemawat, “Mapreduce: simplified data processing on large clusters,” Commun. ACM, vol. 51, no. 1, pp. 107–113, Jan. 2008. [Online]. Available: http://doi.acm.org/10.1145/1327452.1327492 [3] P. C. Roth, D. C. Arnold, and B. P. Miller, “Mrnet: A software-based multicast/reduction network for scalable tools,” in Proceedings of the 2003 ACM/IEEE conference on Supercomputing, ser. SC ’03. New York, NY, USA: ACM, 2003, pp. 21–. [Online]. Available: http://doi.acm.org/10.1145/1048935.1050172 [4] D. Culler, R. Karp, D. Patterson, A. Sahay, K. E. Schauser, E. Santos, R. Subramonian, and T. von Eicken, “Logp: towards a realistic model of parallel computation,” in Proceedings of the fourth ACM SIGPLAN symposium on Principles and practice of parallel programming, ser. PPOPP ’93. New York, NY, USA: ACM, 1993, pp. 1–12. [Online]. Available: http://doi.acm.org/10.1145/155332.155333
[8] C. A. Moritz and M. I. Frank, “Logpc: modeling network contention in message-passing programs,” in Proceedings of the 1998 ACM SIGMETRICS joint international conference on Measurement and modeling of computer systems, ser. SIGMETRICS ’98/PERFORMANCE ’98. New York, NY, USA: ACM, 1998, pp. 254–263. [Online]. Available: http://doi.acm.org/10.1145/277851.277933 [9] M. I. Frank, A. Agarwal, and M. K. Vernon, “Lopc: Modeling contention in parallel algorithms,” in Proc. of the SIXTH ACM SIGPLAN Symposium on Principles and Practice of Parallel Programming, Las Vegas, 1997, pp. 276–287. [10] T. Hoefler, T. Schneider, and A. Lumsdaine, “Loggopsim: simulating large-scale applications in the loggops model,” in Proceedings of the 19th ACM International Symposium on High Performance Distributed Computing, ser. HPDC ’10. New York, NY, USA: ACM, 2010, pp. 597–604. [Online]. Available: http://doi.acm.org/10.1145/1851476.1851564 [11] A. Legrand, L. Marchal, and Y. Robert, “Optimizing the steady-state throughput of scatter and reduce operations on heterogeneous platforms,” in Parallel and Distributed Processing Symposium, 2004. Proceedings. 18th International, april 2004, p. 176. [12] T. Hoefler, T. Mehlan, F. Mietke, and W. Rehm, “Logfp a model for small messages in infiniband,” in Parallel and Distributed Processing Symposium, 2006. IPDPS 2006. 20th International, april 2006, p. 6 pp. [13] T. Hoefler, T. Mehlan, A. Lumsdaine, and W. Rehm, “Netgauge: A network performance measurement framework,” in High Performance Computing and Communications. Springer, 2007, pp. 659–671.
[5] A. Alexandrov, M. F. Ionescu, K. E. Schauser, and C. Scheiman, “Loggp: incorporating long messages into the logp model–one step closer towards a realistic model for parallel computation,” in Proceedings of the seventh annual ACM symposium on Parallel algorithms and architectures, ser. SPAA ’95. New York, NY, USA: ACM, 1995, pp. 95–105. [Online]. Available: http://doi.acm.org/10.1145/215399.215427
[14] N. Hanford, V. Ahuja, M. Balman, M. K. Farrens, D. Ghosal, E. Pouyoul, and B. Tierney, “Characterizing the impact of end-system affinities on the end-to-end performance of high-speed flows,” in Proceedings of the Third International Workshop on Network-Aware Data Management, ser. NDM ’13. New York, NY, USA: ACM, 2013, pp. 1:1–1:10. [Online]. Available: http://doi.acm.org/10.1145/2534695.2534697
[6] A. Lastovetsky and M. O’Flynn, “A performance model of many-to-one collective communications for parallel computing,” in Parallel and Distributed Processing Symposium, 2007. IPDPS 2007. IEEE International, march 2007, pp. 1 –8.
[15] A. Pesterev, J. Strauss, N. Zeldovich, and R. T. Morris, “Improving network connection locality on multicore systems,” in Proceedings of the 7th ACM European Conference on Computer Systems, ser. EuroSys ’12. New York, NY, USA: ACM, 2012, pp. 337–350. [Online]. Available: http://doi.acm.org/10.1145/2168836.2168870
[7] F. Ino, N. Fujimoto, and K. Hagihara, “Loggps: a parallel computational model for synchronization analysis,” in Proceedings of the eighth ACM SIGPLAN symposium on Principles and practices of parallel programming, ser. PPoPP ’01. New York, NY, USA: ACM, 2001, pp. 133–142. [Online]. Available: http://doi.acm.org/10.1145/379539.379592
[16] T. Kielmann, H. E. Bal, and K. Verstoep, “Fast measurement of logp parameters for message passing platforms,” in Parallel and Distributed Processing. Springer, 2000, pp. 1176–1183.