A Method for Scheduling Integrated Transit Service Mark Hickman Department of Civil Engineering and Engineering Mechanics The University of Arizona P.O. Box 210072 Tucson, AZ 85721- 0072 USA
number of transfers. Using this information, the proposed technique determines which trips are eligible for integrated service using the passenger level- of-service constraints. A schedule is then created for both the passenger trips and the vehicle trips, so that the to tal cost of service is minimized. The method is illustrated using a case study of transit service in Houston, Texas, showing the possible cost advantages and changes in passenger level of service with integrated service. The contributions of the research include: (i) a new heuristic for scheduling integrated transit trips that accommodates both passenger and vehicle scheduling objectives; and, (ii) an illustrated method for evaluating the operating cost and passenger level-of -service implications of integr ated transit service. Keywords: Public transit scheduling; integrated transit service; coordinated transit service; demand-responsive service
Phone: (520) 626-9420 E-mail:
[email protected]
Introduction Kelly Blume Kittelson and Associates 610 SW Adler, Suite 700 Portland, OR 97205 Phone: (503) 228-5230 E-mail:
[email protected]
In the United States, many transit agencies are considering integrating their demand-responsive service with traditional fixed-route service. In some cases, it may be advantageous to the transit agency or to the passenger to coordinate traditional demand-responsive transit service with fixed -route service. The demand-responsive service connects passengers from their origin to the fixed route service and (or) from the fixed route service to their final destination. The integrated transit service problem is to schedule both passenger trips (or itineraries) and vehicle trips for this service. In considering the literature, this research proposes a scheduling method that explicitly incorporates both transit agency cost and passenger level of service. More specifically, the model assumes: (i) a fixed -route bus schedule; (ii) desired passenger pick-up and drop-off points; (iii) time window constraints for passenger pick-ups, drop-offs, and transfers; and (iv) passenger level of service constraints, including maximum travel times and
In the United States, many transit agencies have been considering integrating their demand-responsive service with traditional fixed-route service. In some cases, it may be advantageous to the transit agency or to the passenger to coordinate traditional demand-responsive transit service with fixed-route service. The demand-responsive service connects passengers from their origin to the fixed route service and (or) from the fixed route service to their final destination. Using this concept, transit agencies can extend demand-responsive service into lowdensity markets or may substitute demand-responsive se rvice for fixed -route service. In these cases, operating costs may be reduced, and the level of service to passengers may increase by providing door-t o- door service. In other situations, longer trip lengths and growing patronage for demand-responsive service may lead a transit agency to consider providing at least part of the trip on fixed-route service, thereby reducing operating costs. The integrated transit service problem is to schedule transit trips that may be carried by some combination of demand- r e sponsive and fixed -route transit service. Both passenger trips (or itineraries) and vehicle trips must be scheduled. Past research on this problem includes the work of Wilson et al. (1976) and Liaw et al. (1996). The work of Wilson et al. examines scheduling of integrated service where several demand-responsive services operate in different geographic zones that are connected by a fixed- route service. The problem is formulated with a passenger utility function as its objective, subject to various level- of -service constraints. Operator costs are not included directly in the model. To schedule passenger and vehicle trips, a trip insertion heuristic is used. Somewhat in contrast, the work of Liaw et al. (1996) examines scheduling of integrated service using operating cost as the objective function. The problem is formulated using hard time window constraints, but no other passenger level- of-service measures
are included in the model. An on-line heuristic is used to generate passenger itineraries, and the passe nger and vehicle trips are further refined using simulated annealing. In considering this literature, what is still lacking is a scheduling method that includes both the passenger and operator objectives. To this end, this research explicitly incorporates both transit agency cost and passenger level of service directly in the model. From the transit agency’s perspective, the goal in scheduling vehicle trips is to minimize the total cost of service. On the other hand, passengers desire a high level of service; e.g., minimizing travel time, transfer time, and the number of transfers. To balance agency and passenger objectives, this research introduces a heuristic to schedule integrated trips that minimizes transit agency cost, subject to passenger level-of- s e rvice constraints. In the model formulation, the following elements are given: (i) a fixed-route bus schedule; (ii) desired passenger pick- up and drop-off points; (iii) time window constraints for passenger pick-ups, drop- offs, and transfers; and (iv) passenger level of service constraints, including maximum travel times and number of transfers. Using this information, the proposed technique determines which trips are eligible for integrated service using the passenger level- of-service constraints. A schedule is then created for both the passenger trips and the vehicle trips in the integrated service, so that the total cost of service is minimized. This paper describes and illustrates a proposed two-stage heuristic to solve the integrated service scheduling problem. In the following section, this two-stage heuristic is described. In the third section, the proposed heuristic is used to illustrate the possible advantages of integrated service through an illustration of transit service in Houston, Texas. The case study is used to identify the potential cost and level of service implications for a transit agency considering shifting portions of some demand- responsive trips to the fixed- route service. The final section presents conclusions on the value of this scheduling method.
The Scheduling Heuristic Overview Development of an integrated transit service schedule comprises two main tasks: scheduling passenger trips and scheduling vehicle trips. In the scheduling of passenger trips, an itinerary is developed for each integrated service request in which: 1. A paratransit vehicle may pick up the passenger from his/her origin and “feed” him/her to an appropriate fixed-route stop.
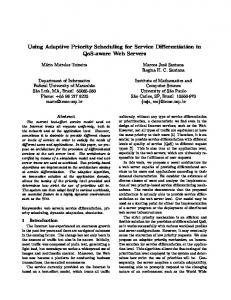
2. A fixed-route vehicle will then pick the passenger up and transport him/her to another fixed-route stop. 3. A second paratransit vehicle may carry the passenger from the second fixed route stop to the door of his/her destination. One or more of the paratransit “legs” may be excluded, and multiple itineraries are possible for a single request. Figure 1 conceptually illustrates the scheduling of a single passenger’s request where two transfers must be made.
Fixed Route 1 Paratransit Leg Paratransit Leg
Destination
Origin
Fixed Route 2
requested origin and destination major time point (possible transfer point)
Figure 1. An Integrated Transit Trip The proposed approach decomposes this problem into two parts. First, one must find a feasible passenger itinerary, connecting the passenger’s origin with the passenger’s destination with transit service that maximizes the passenger’s level of service. If such a passenger itinerary can be found that meets these level- ofservice requirements, the passenger’s trip is scheduled. Second, the paratransit trip legs must be added to a vehicle’s schedule. This is done through existing vehicle routing heuristics for paratransit service. Through this decomposition, it is believed that this technique improves upon that of Liaw et al. (1996) by explicitly considering the passenger’s level of service. It also improves upon the technique of Wilson et al. (1976) by explicitly incorporating operating costs into the scheduling process. The following (typical) inputs for these two scheduling tasks are assumed: the location of the passengers’ pickup and dropoff points;
the passenger’s requested times, and associated time windows, in which pickups and dropoffs must occur;
Select a trip request and calculate the O-D distance
the location of fixed-route stops; the schedules of all fixed-route vehicles; the accessibility level of all fixed-route vehicles and transfer points; the time windows in which paratransit vehicles are permitted to meet fixed route vehicles at transfer points; vehicle capacities; passenger loading and unloading times; the distance between stops; and, minimum passenger level of service standards. The tasks of passenger scheduling and vehicle scheduling are then performed sequentially. Typically, the passenger itinerary will be scheduled on-line, so that the itinerary can be relayed directly to the passenger when they are requesting a trip. The vehicle trip scheduling can be done off-line, once all passenger trips are scheduled. The following sections describe the passenger and vehicle scheduling methods, respectively.
Passenger Itinerary Development In the first stage, the potential passenger trip from the origin to the fixed route, on the fixed route, and from the fixed route to the destination is scheduled. The itinerary development process is summarized in Figure 2. To develop an integrated itinerary, a passenger is selected and his/her requested times and locations are identified. The Euclidean distance between the origin and destination is calculated. This distance must exceed some specified minimum distance; this screening is done to eliminate an inconvenient pair of transfers for very short trips, particularly when the paratransit legs of the integrated trip together form a very high percentage of the total origin-t o-destination (O -D) distance. The distance between the origin and destination can also be used to estimate the passenger’s expected travel time for a direct paratransit trip. Also, the maximum allowable ride time for each passenger can be calculated as an incremental percentage above the expected travel time (e.g., 50% higher).
Does O-D distance exceed the minimum?
NO
YES
Set loading / unloading time, restrict transfer points based on passenger type
Identify possible transfer points near O and D
Identify fixed routes serving transfer points
Do any common routes serve both O and D?
NO
YES
Calculate shortest path with time windows, using fixed-route schedules
Is the time on shortest path acceptable?
NO
Serve trip using demandresponsive service
YES
Schedule vehicle trip
Figure 2. Passenger Itinerary Heuristic
The passenger’s disability is then noted and used to set values for loading and unloading time and to restrict possible transfer points. This will tailor itineraries to the specific needs of the passengers. A wheelchair -bound rider, for example, will require more time to enter and exit the vehicle than an ambulatory passenger might. Based on the passenger’s origin and destination, and any accessibility requirements, possible transfer points to the fixed route network must be identified. These should be less than some maximum distance from the origin or destination; in this way one may screen out trips where the fixed- route segment accounts for only a small percentage of the trip. The transfer points should also be farther than some minimum distance because, for the agency and for other passengers, it would be impractical to schedule a paratransit vehicle for a trip that is too short. Rather, such a request would be served directly by paratransit or by a single -transfer trip. To minimize passenger inconvenience, no more than two transfers are allowed, and so only two transfer points need to be identified. The proposed method is a variation of that proposed by Liaw et al. (1996). One may construct circles geographically about both the rider’s origin and destination and identify transfer points within these circles along a common fixed route. This technique can be used to identify any fixed routes that serve the origin or destination directly (i.e., within a very small walking distance), hence requiring only one or no paratransit legs. In contrast to Liaw’s method, however, it seems that integrated trips with two paratransit legs have a minimum, as well as a maximum, radius (i.e., a ring). The distance between a passenger’s origin and destination, for example, may be long enough that the passenger cannot make the trip without assistance but short enough that a single paratransit trip would be less expensive for the agency than a combination of paratransit and fixed- route trips. If served with a single paratransit vehicle and no fixed-route transfers, the passenger would not experience the onerousness of transfers or waiting at a fixed-route stop, and other passengers would not be unduly penalized by the need to schedule an additional integrated trip. Specifying a practical minimum distance between the origin and destination therefore improves passenger level of service for short trips and mitigates overall system scheduling inflexibility. Figure 3 illustrates the proximity circles and the paratransit and fixed-route trips that might serve a single request. Possible paratransit connections are denoted with capital letters; these only connect the origin and destination to points within the proximity circle. One integrated transit trip might be Origin → C → F → Destination , v i a Fixed Route 2.
Fixed Route 1
D
E Destination
B
A
Origin
F
C Fixed Route 2
requested origin and destination major time point (possible transfer point)
Figure 3. Possible Integrated Transit Itineraries for a Single Request
It is reasonable to expect that circles of different sizes will have different effects on the capabilities and cost-effectiveness of the integrated transit system. For example, large circles will include more fixed routes but may also require longer paratransit trips. At the same time, the more distant an origin and destination, the longer the paratransit trip legs can be without seeming an inefficient connection. Setting circle size at a percentage of the distance between a given origin and destination is one method for taking total travel distance into consideration. This percentage can be set at different levels for a given transit system and a sensitivity analysis performed to determine what radius provides a reasonable screening of itineraries. After potential transfer points have been identified, common routes that connect the origin and destination must be found. This is accomplished through an explicit matching of fixed routes associated with major time points near both the origin and destination. If the time points near the origin and destination are not connected by a common route, then the trip request is served entirely with paratransit. With the resulting sub-network of feasible paratransit legs and fixed -route services, feasible itineraries are constructed. Essentially, this involves solving a shortest path problem with time windows (Desrochers and Soumis, 1988) on this sub-network. For this, time windows at the origin, destination, and transfer points are used. Also, the published fixed-route schedule is used to estimate available time windows at transfer points; passengers must be picked up or dropped off within the time windows during which the transit vehicle is expected. Currently,
the shortest path is generated by full enumeration (the size of the sub -networks are generally not too large). If the passenger has specified an appointment time at the destination, a backwards pass through the network is performed. If, instead, a departure time from the origin is specified, a forward pass through the network is performed. For each such itinerary, a passenger’s level-of -service measure must be evaluated; a “generalized time” calculates the sum of waiting, travel, and transfer time along each path. The waiting and transfer times can be estimated from the associated tim e windows; the fixed-route schedules give an estimate of travel times on the fixed-route service; and, a straight- line distance divided by an average vehicle speed is used to estimate in- vehicle travel times for the paratransit trips. It is also possible that different weights can be applied to these different components of travel time (e.g., if transfer time is more onerous than other types of time). In the example, a transfer “penalty” equivalent to 5 minutes of travel time is added. The path with the minimum generalized time is then compared to the generalized time of a direct paratransit trip (the baseline). The approach in the case study assumes that the existing paratransit service is the “default” or “baseline” service, should it prove infeasible o r not cost- effective to serve the trip with the integrated service. In this case, the cost-effectiveness of full paratransit service is compared with the integrated transit trip. [One could just as easily define the default as fixed-route service, in order to examine the cost -effectiveness of paratransit “feeder” service. While not described in this paper, such a technique involves only minor modification of the proposed method.] The passenger trip is accepted if the generalized time is not more than the maximum allowable trip time. As one might expect, however, varying the maximum allowable trip time may have considerable impact on the likely number of passengers served with the integrated service.
naturally follows the original work by Wilson et al. (1976). Also, given the large number of potential trips (over 3500 per day), and the existence of a reasonably good paratransit vehicle schedule, a mini- clustering and column generation technique (Ioachim et al., 1995) is also possible. For the case study, Houston METRO has provided an existing vehicle schedule that was created by their paratransit trip scheduling software. This provided a set of trip requests, locations, and time windows for these trips. It also provided “baseline” vehicle assignments of all the passenger trips. Rather than re-scheduling all 3500 trips, the existing passenger trips we r e separated into two groups: those that could use the integrated service and those that could not. The potential integrated service trips may be removed from the existing vehicle schedules. This creates a subset of all passenger trips that are eligible for r e- scheduling. Using the technique of Jaw et al. (1986), the rescheduled trips may be re-inserted into the vehicle trip schedules based on a minimum cost insertion. In some cases, however, this re-insertion is not desirable because of the ensuing geographic dispersion of vehicle trip segments. Rather, the remaining trips (those not eligible for integrated service) may be left as “clusters” of consecutive passenger trips served by a given vehicle, in the spirit of the “mini- clusters” described by Ioachim et al. (1995). These existing clusters can then be combined with the new integrated trip legs; i.e., there will be new trip “clusters” defined as the union of: (1) the individual integrated service trip “legs” (zero to two per integrated passenger trip); and, (2) the remaining “clusters” of consecutive trips served completely by door- t o-door paratransit service. At this point, these miniclusters can be optimized using the column generation technique of Ioachim et al. (1995). Greater detail on this technique is described in a separate report (Hickman and Blume, 2000).
Vehicle Trip Scheduling In the Houston case study to be described later, it was not necessary to go to the detail of a full vehicle schedule. Rather, the results of the passenger trip scheduling technique were sufficient to evaluate the feasibility and potential advantages of the integrated service scheme. Below, an outline of the approach to completing the vehicle trip scheduling task is given; this is an area of ongoing research. Once an integrated trip has been accepted, the vehicle trips from the origin to the fixed route and from the fixed route to the d estination are added to a traditional paratransit vehicle routing and scheduling problem. While there are now a large number of heuristics that can be used for paratransit vehicle routing and scheduling, two were identified for use in this research. The first is a vehicle trip insertion heuristic (Jaw et al., 1986); this method is an updated technique that
Case Study Background The proposed scheduling heuristic is illustrated using the existing transit service in Houston, Texas. The transit agency in Houston (METRO) operates 94 fixed routes and a demand-responsive service for over 1750 passenger round trips per day, or about 3500 one-way trips per day. Much of the demand-responsive service is oriented to passengers qualifying under the Americans with Disabilities Act (ADA) of 1990, which specifies particular paratransit service requirements for these patrons. In this regard, 53% of METRO’s demand-responsive passengers are
ambulatory -impaired, and hence are really not eligible for integrated transit service as a result of METRO’s own level-of -se rvice requirements. This is because there are still fixed-route stops and vehicles that are not fully equipped for ADA service.
Eligible passengers. Only those passengers with no ambulatory impairments were considered eligible for an integrated trip. This corresponds to METRO’s desire to serve these trips with the highest level of service, giving these passengers additional attention.
Because of a large service area (1400 sq km), trip lengths for the paratransit service average 13.3 km. Trip lengths over 40 km are not uncommon. With the requirments of the ADA, METRO is experiencing rapid growth in demand for the demand-responsive service, and is considering integrated service. Yet, METRO experiences greater costs for demand-responsive service ($10.28 per passenger trip, or $0.77 per passenger-km) than for fixed -route service ($2.24 per passenger trip, or $0.27 per passenger-km). As a result, there is reason to believe that the substitution of fixed- route service for part of the demand- responsive service may r e sult in cost savings to the agency.
Minimum integrated trip length. The passe nger’s origin and destination must be at least 3 mi (4.8 km) apart in order to be considered for an integrated trip. Shorter trips are likely more easily served simply through a direct paratransit trip. Longer minimums may also be considered; this is an area for further sensitivity analysis. The 3 mi restriction eliminates another 6% of the trips from consideration, with only 40% of trips (about 1400 of 3500) being eligible on the basis of having an ambulatory passenger with a sufficient trip length.
The primary questions to explore included: − What number and percentage of trips could be served by integrated service?
Average paratransit vehicle speed. This was set based on the distance between the passenger’s origin and destination, and the value does not include intermediate stops. Distance-based values were provided by Houston METRO and ranged between 24 and 66 km/h for trip lengths up to and exceeding 32 km.
− What impacts might be expected for passenger level of service, for eligible passengers?
Origin and destination time windows. 1 5- minute time windows were used for the pick-up at the origin and the drop -off at the passenger’s destination.
− What potential cost savings might be realized?
Maximum waiting time at a fixed -route stop. Ideally, the paratransit vehicle would arrive at the transfer point at the same time as the fixed- route bus. However, to allow some flexibility in scheduling, a maximum waiting time for the paratransit passenger was set to five minutes. In other words, when dropping off a p assenger, a paratransit vehicle could arrive to a fixed-route time point up to five minutes before the scheduled arrival of the fixed- route vehicle. Also, when picking up a passenger, a paratransit vehicle could arrive up to five minutes after the schedule d arrival time of the fixed-route vehicle.
For the purposes of this feasibility study, only the proposed passenger scheduling heuristic is applied. The passenger scheduling heuristic gives an initial estimate of the potential number of passengers served, the passenger level of service, and an upper bound on the potential reductions in paratransit vehicle kilometers and hours that might be possible under the integrated service strategy. The cost savings to the agency could be estimated based on the potential reduction in vehicle-km or vehicle-hours traveled. Assuming a constant utilization rate of vehicles, an upper bound on the cost savings is estimated as the total paratransit vehicle distance saved in the passenger itinerary, multiplied by the average paratransit cost per passenger -km. That is, the estimate of the cost savings is equal to the cost per passenger-km, multiplied by the difference in distance of the direct trip versus the sum of the new paratransit “legs.”
Application This case study explores the possible cost advantages and changes in passenger level of service with integrated service. Using the proposed scheduling method, the integrated service is compared with the existing fully demand -responsive service, using performance measures of the total number and percentage of trips served, the passenger level of service (travel time and transfers), and the potential agency cost savings. Global parameters and assumptions for this case study included the following:
Maximum ride time . METROLift limits the amount of time that a rider spends on a vehicle to values that vary with the distance between the origin and destination. These values range from 30 minutes to 120 minutes for trips up to and exceeding 48 km. Radius of proximity circles about origin and destination. A preliminary value of 30 percent of the distance between the origin and destination was selected. This was used to identify potential transfer points to the fixed-route system. Also, a minimum radius of 0.25 miles (0.4 km) was specified as the minimum distance eligible for a paratransit trip. Increasing this value would have the effect of reducing the number of integrated trips. Finally, for a direct connection to a fixedroute bus stop, a maximum walking distance of 0.1 mi (160 m) was used to restrict eligible fixed-route stops. Penalty factors. It was also assumed that a penalty of 5 minutes of travel time would be applied for each transfer. With two transfers, a total of 10 minutes is added.
Example
Full Analysis
Consider the following example trip for scheduling under the passenger itinerary heuristic. A fully ambulatory customer wishes to travel from their origin (home) to their destination (a doctor’s office), a tota l (Euclidean) distance of 14.2 km. The passenger requests to leave home at 8:20 a.m., with 15-minute time windows on either side.
As a case study, the passenger scheduling heuristic was applied to a representative day of service at Houston METRO. The input to the heuristic was the existing schedule of trips, as output from the METROLift scheduling software. On the given day, a total of 3589 one-way passenger trips were taken on METROLift. Of those trips, 924, or about 26%, could be accommodated using the integrated service. This was a much higher percentage than originally anticipated. Of the trips that were not covered, 1925 (53%) were not covered due to passenger disability (e.g., a wheelchair prohibited the trip), 217 trips were too short for our heuristic (under 4.8 km or 3 mi total length), 312 trips could not be served by a single fixed route, and 211 could not meet the maximum travel time constraint. It is interesting that the trip length and total travel time constraints, while important, had a more modest effect in reducing the number of trips served.
To begin, an initial screening of potential fixed -route stops indicated that none were within 0.1 miles (0.16 km) of the origin or destination. Second, “rings” around the origin and destination were generated from a radius of 0.4 km to 30% of the total O-D distance (4.25 km). From these rings, there were 6 timepoints near the origin and 365 timepoints near the destination (the destination is in a dense downtown area). These points have 5 routes in common. With the current METRO operating parameters, the 14.2 km trip has a maximum allowable ride time of 59 minutes. Because a pick-up time is specified, the shortest path with time windows is determined using a forward pass in the network, from the origin to the destination. For this trip, the shortest travel time on the integrated service is 32 minutes (excluding the transfer penalties), comprised of two paratransit legs and a fixed-route leg: − 3 min paratransit trip from the origin to a local transit center 0.6 miles away, traveling at an average of 15 mph (1.0 km at 24 km/h); − 5 min total waiting time (one -half of the 5 -minute time window at each fixed route stop); − 20 min on the fixed-route bus; and, − 4 min paratransit trip from the second stop to the destination 0.8 miles away, averaging 15 mph (1.3 km at 24 km/h). The pick-up at the origin is scheduled for 8:08 a.m. with a fixed- route segment from 8:13 to 8:33. The final drop-off at th e destination is scheduled for 8:40. Finally, for the level-of- service comparison, an additional 10 minutes is added as a transfer penalty (2 transfers at 5 min/transfer) to obtain a total time of 42 min. As for the passenger level of service, the integrated trip described above can be compared with the “baseline” paratransit schedule. Interestingly, in this case, the scheduling software at METRO scheduled this passenger’s trip for 43 minutes, which is longer than the direct trip due to an intermediate stop. As a result, even with the 10 minute transfer penalty, this particular integrated trip provides the passenger with a slightly better level of service. From the operator’s viewpoint, the trip is also beneficial, in that the total paratransit trip distance has been cut from 14.2 km (direct) to 2.3 km (for two legs), or a savings of 11.9 km.
As for the overall passenger level of service, 39% of the trips on the integrated service actually provided a shorter travel time than that produced by METRO’s scheduling software. Yet, 61% will be slightly worse off. This comparison includes a 10-minute total transfer penalty. Graphically, this result is illustrated in Figure 4, using a histogram of the time savings comparing the integrated trip versus the existing scheduled trip. The skew of this histogram to the left indicates that there are a number of passengers who would realize slight increases in travel time with the integrated service. However, the long tail to the right indicates that many passengers would realize substantial savings. The effect of this long tail is evidenced in the mean of the distribution, which is +3 minutes (i.e., an average 3 min advantage for the integrated trip versus the existing schedule). Time savings appears to be more substantial for shorter trips where ride sharing occurs. In these cases, the integrated trip results in a less circuitous trip, and the passenger experiences a net time savings. Longer trips, on the other hand, are less likely to have time advantages for the integrated trip. With an extensive freeway network, the assumed demand-responsive vehicle speeds are much higher than the fixed-route service for these long trips. These passenger level-of- service results occurred using the (typical) 10-minute total penalty for transfering. As one might expect, the percentage of trips with improved service drops rather sharply as the assumed transfer penalty increases. A 10- minute penalty per transfer (20 min total) reduces the advantage to at most 21% of trips, and a 15-minute penalty per transfer (30 min total) reduces the potential advantage to at most 6.5% of trips. Hence, the potential passenger levelof-service impacts are likely to be very sensitive to the assumed transfer penalty.
Conclusions
90
This paper has described and illustrated a method for scheduling passenger and vehicle trips in an integrated transit service. It is suggested that the proposed twostage heuristic for scheduling these trips allows more direct consideration of both passenger level-of -service characteristics and transit agency operating costs. Further sensitivity analysis is warranted on the proposed method. It appears that the potential cost savings and passenger level of service are sensitive to the parameters of (1) standards of passenger eligibility for the service; (2) the minimum and maximum passenger trip lengths for paratransit trip “legs”; and, (3) the assumed penalty for passenger transfers. Also, a full implementation with a vehicle scheduling heuristic is also warranted to obtain more detailed estimates of vehicle costs.
80 70
# of Obs (n=706)
60 50 40 30 20 10
90 10 0
70 80
50 60
30 40
0
10 20
-2 0 -1 0
-4 0 -3 0
-6 0 -5 0
-8 0 -7 0
-1 00 -9 0
0
Minutes of Time Savings
Figure 4: Histogram of Travel Time Difference, Existing – Integrated Service Finally, the potential cost advantages for METRO are stated in terms of the potential reduction in passenger-km of travel. When compared with the Euclidean distance, the integrated service reduces the total passenger- km of travel by 7380 km (4584 mi). This amounts to approximately 15% of the total passenger-km of travel at METROLift. At an average cost of $0.77 per passenger-km, the total cost savings has an upper bound of approximately $5682. This equates to about 15% of the daily operating cost of $36,000 at METROLift. At the same time, one notes that this over-states the potential cost savings, since vehicle costs are likely to be highly non-linear with the costs per passenger-km. That is to say, the percentage reduction in passenger-km, particularly for trips w h ere rides are shared, likely overstates the proportional reduction in vehicle -km. It is necessary to input the new integrated service trip legs through the vehicle scheduling heuristic to get a more accurate estimate of the vehicle operating cost savings. Several additional issues are also noted here. From the perspective of the proposed methodology, the computational time of the passenger scheduling heuristic appears to be sensitive to: (1) minimum and maximum trip lengths for paratransit trip legs, whic h in turn defines the allowable search area for fixed-route time points; and, (2) the manner in which fixed-route schedules are stored and coded. These factors contribute significantly to the computation of shortest paths.
From the Houston case study, the number of eligible trips where fixed-route substitution is possible appears to be substantial. About 26% of the trips served by the existing demand-responsive service are eligible for the integrated service, upon consideration of the passenger disability, minimum trip lengths, maximum travel times, and the need for a single fixed route. Interestingly, a substantial minority (39%) of passengers will achieve travel time savings with the integrated service, when compared with the existing service. However, this result is heavily dependent on the assumed penalty to passengers for making transfers to and from the fixed-route service. Finally, preliminary indications are that the cost savings for integrated service can be bounded at about 15% of the total operating cost. However, the actual cost savings are likely to be lower. Obviously, the next step in this evaluation is to compare these reductions in costs against the potential for degradation of the passenger level of service. Interestingly, some passengers will be made better off with the integrated service, because the existing baseline service has circuitous vehicle trips. However, the majority of passengers experience some degradation in the level of service, with longer total travel time (although still within stated maximum travel times). These increases in passenger travel times must then be balanced against the potential cost savings. Of course, cost and passenger travel time are not the only factors one might consider in deciding to implement such an integrated service, but the proposed method does allow evaluation of the cost and level-of -service implications. At the same time, potential increases in travel times, the effects of the requirement to transfer, and the resulting comfort and safety of passengers, must also be considered before such an integrated service is offered.
Bibliography Desrochers, M. and F. Soumis (1988). A Generalized Permanent Labelling Algorithm for the Shortest Path Problem with Time Windows. INFOR, Vol. 26, No. 3, pp. 191-212. Ioachim, I., J. Desrosiers, Y. Dumas, M. Solomon, and D. Villeneuve (1995). A Request Clustering Algorithm for Door-to -Door Handicapped Transportation. Transportation Science, V ol. 29, No. 1, pp. 63-78. Hickman, M. and K. Blume (2000). Methods for Scheduling Integrated Transit Service: Survey of Current Methods and a New Heuristic. Draft Report for the Southwest Region University Transportation Center. Texas A&M University System, College Station, TX. Liaw, C., C.C. White, and J. Bander (1996). A Decision Support System for the Bimodal D i a l- a -Ride Problem. IEEE Transactions on Systems, Man, and Cybernetics - Part A: Systems and Humans, Vol. 26, No. 5, pp. 552-565. Jaw, J., A. R. Odoni, H. N. Psaraftis, and N. H. M. Wilson (1986). A Heuristic Algorithm for the Multi-Vehicle Advance Request Dial-a- Ride Problem with Time Windows. Transportation Research, Part B, Vol. 20B, No. 3, pp. 243-257. Wilson, N.H.M., R.W. Weissburg, and J. Ha user (1976). Advanced Dial-a-ride Algorithms Research Project: Final Report. Massachusetts Institute of Technology, Cambridge, MA.