causes catastrophic injury or whether it is simply associated with the injury has been ongoing for almost two decades. Within the rollover environment,.
A METHOD TO EVALUATE DYNAMIC vs. RESIDUAL ROOF RAIL DEFORMATION IN DOLLY ROLLOVER TESTS John E. Cochran. Jr. Auburn University United States Martha W. Bidez University of Alabama at Birmingham United States Dottie King Three Sigma, Inc. United States Paper Number 05-0378 ABSTRACT
INTRODUCTION
The purpose of this study was to develop the analytical methodology to evaluate the dynamic versus residual roof deformation characteristics of a compact SUV subjected to SAE J2114 dolly rollover tests. Two FMVSS 208 dolly rollover tests with instrumented, restrained driver side Hybrid III dummies were evaluated during the first driver’s side roof rail ground strike. Kinematic targets were mounted on the driver dummy head and tracked via onboard cameras as a means of visual validation of roof rail deformation (assuming rail-to-dummy head contact). Test instrumentation included: accelerometers at the vehicle center of gravity (CG), roof rail, pillars and rocker panel, lap and shoulder belt load transducers, triaxial accelerometers at the center of gravity of the head, chest and pelvis of the dummies and six-axis force (and moment) transducers in the neck of the dummy. All data was recorded consistent with SAE J211-1 recommendations
Rollovers present a high degree of risk to occupants as evidenced by the fact that rollovers have a higher fatality rate than other kinds of crashes. Of the nearly 11 million passenger car, SUV, pickup and van crashes in 2002, only 3% involved a rollover. However, rollovers accounted for nearly 33 out of every 100 deaths from passenger vehicle crashes. This is an astonishingly high figure. In 2002 alone, more than 10,000 consumers died in rollover crashes. (NHTSA, 2003) An even higher number of consumers were critically injured in rollovers, which translates into hundreds of millions of dollars of unnecessary health care costs on society in general.
Vehicle angular velocity and attitude were estimated using the data from multiple accelerometers, which correlated well with the test video. The accelerometer data indicate that the driver roof rail dynamic deformation was significantly greater than the residual deformation to which the roof rail rebounded following loss of ground contact. The dynamic deformation was of such magnitude that the rail intruded into the driver’s occupant survival space. A spike in driver dummy head acceleration was observed immediately following the acceleration pulse that caused the rail intrusion The presence of significant dynamic roof rail deformation is new and important quantitative information that should be added to the body of knowledge surrounding reconsideration of FMVSS 216 and catastrophic injury prevention in rollover crashes.
A debate between safety professionals and industry representatives over whether roof crush causes catastrophic injury or whether it is simply associated with the injury has been ongoing for almost two decades. Within the rollover environment, the dynamic motion of a vehicle’s roof rail at first ground strike, prior to the effects of multiple ground strikes and cumulative structural damage, provides an opportunity to study its influence on dummy kinematics and injury measures. During the nine month interval from December 9, 1998 to August 11, 1999, Ford Motor Company sponsored a number of J2114 dolly rollover tests of Explorer vehicles at Autoliv ASP (Auburn Hills, MI). The structures of the SUVs were instrumented with accelerometers at the vehicle’s center of gravity and all pillars, roof rails and rocker panels. Two fully instrumented Hybrid III 50th percentile male dummies were three-point restrained in the driver and right front passenger seating positions. A total of 118-127 channels of data as well as external and internal video footage were collected for each test. In 2003, the full raw data set was made available for our review and analysis in litigation involving
Cochran 1
consumers injured in rollover crashes involving Ford SUVs. An overview of the data was presented to NHTSA by representatives of Ford on March 5, 2004, and publicly posted in the docket (NHTSA-19995572-61) on April 13, 2004. Ford’s public presentation of the Autoliv data was, to the best of our knowledge, Ford’s first public release of the test data, which fortunately allowed the scientific community public access to information that had previously been kept confidential. The purpose of this study was to develop the analytical methodology to evaluate the dynamic versus residual roof deformation characteristics in the Autoliv SUV dolly rollover tests using accelerometers mounted at the vehicle center of gravity (CG), roof rail, pillars and rocker panel. Dynamic neck loads of a lap-shoulder restrained Hybrid III 50th percentile male driver dummy were compared to the driver rail acceleration profile during the first driver’s side roof rail ground strike. Kinematic targets mounted on the driver dummy head and tracked via onboard cameras provided a means of visual validation of the mathematical estimations of rail displacement. All sensor data was recorded and filtered consistent with SAE J211-1 recommendations. Constitutive equations were derived to properly process the accelerometer output data into acceptable forms for testing for both mathematical reliability and biomechanical engineering validity related to occupant protection in rollovers. The equations used in this study describe a deformable body that is undergoing general translational and rotation motion as well as deformation. Six degrees of freedom are required for general translation and rotation and typically utilize a large number of degrees of freedom are needed to model deformation. However, because we are concerned, at the present time, with processing data from accelerometers fixed to various points on the vehicle, we did not, for the purposes of this study, need to consider the number of degrees of freedom used to model the deformation. We only needed to model the part of the acceleration due to the deformation appropriately. Hence, we developed kinematic equations for the relative motion of each sensor with respect to a common point for which we know the acceleration. Since these equations contain angular velocity and angular acceleration of the vehicle, we considered the problem of determining its rotational motion from the available data.
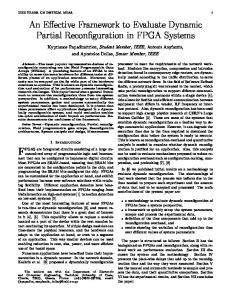
Kinematics In Figure 1, the OXEYEZE system is an “Earth-fixed” coordinate system which is fixed in location and r orientation. The vector R C from O to C, the original center of mass of the vehicle, and the vector r r7 locates a sensor denoted as “7” in the earth-fixed coordinate system. In the rollover tests, sensor S7 is a two-axis accelerometer at the B-pillar on the driver’s side. The acceleration measured by sensor S7 is equal to the acceleration of the center of mass, C, of the vehicle, plus the acceleration of S7 relative to C, i.e., the acceleration due to rotation of the vehicle about C and the acceleration due to localized rail/pillar deformation. This may be expressed mathematically as
r r r A S7 = A C + A S7/C
(1)
r r r where A S7 , A C , and AS7/C are the accelerations of S7, C, and S7 with respect to C, respectively. It follows from (1) that the acceleration of S7 with respect to C is r r r A S7 / C = AS7 − A C
(2)
Since part of the acceleration of the sensors with respect to the center of gravity is due to the rotation of the vehicle, the angular velocity and angular acceleration of the vehicle-fixed axes must be used. Two methods were utilized in this investigation to determine the angular velocity, both with and without the use of a rollover sensor. If very good estimates of the angular velocity can be obtained then the vehicle’s attitude may be obtained by numerical integration. Also, the parts of the accelerations of the sensors with respect to the center of gravity that are due to the rotation of the vehicle may be removed from equations like Eq. (2) and the part of the acceleration due only to deformation integrated to get deformation rates and displacements. Because each sensor has its own coordinate system, if the deformations are extreme (e.g. significant roof crush into the occupant survival space), then some method must be devised to account for the rotation of individual sensors.
Cochran 2
Y
Z z7 ZE
r r7
r RC
C
O
y7 S7 &P7
x7 S11
X
YE XE Figure 1. Earth-Fixed, Vehicle-Fixed, and Sensor Coordinate Systems. r If the components of AS7/C in the CXYZ system are used to calculate velocity and position, then the results should not contain the principal terms due to the translation of the center of mass of the vehicle. However, the rotation of the vehicle must still be properly included. r By definition, the acceleration AS7/C is the second r time derivative of r7 . The latter may be written (See, for example, Meriam, 1971.) as
r r r r A S7/C = δ 2 r7 / δt 2 + 2 ω x δr7 / δt r r r v r + ω x (ω x r7 ) + ω x r7
(3)
r where ω is the angular velocity of the CXYZ r coordinate system and the derivative δ r j / δt of a r vector r j indicates the time derivative of that vector as seen in the rotating (vehicle-fixed) system CXYZ. r The quantity δ 2 r7 / δt 2 is the relative acceleration (acceleration as viewed by an occupant of the vehicle as he/she rotates with the vehicle-fixed CXYZ system) due to the deformation of the vehicle’s structure at point P7 to which the sensor S7 is r attached. Now, r7 may be written as
r r r7 = r70
r + δr7
(4)
r ˆ is the where r70 = X 70 Iˆ + Y70 Jˆ + Z 70 K position vector of point P7 on the driver’s roof rail/B-pillar in the vehicle-fixed CXYZ system when there is no deformation of the roof rail and r ˆ is the displacement δr7 = δX 7 Iˆ + δY7 Jˆ + δZ 7 K of P7 due to local deformation (“crush”) of the roof rail/B-pillar.
δZ 7 are related by the fundamental mode shapes of the structure. In the present case of a compact SUV, the deformation is a combination of elastic and plastic, dynamic and residual deformation types. An approach in which the displacements and are first considered to be δX 7 , δY7 , δZ 7 independent and then the rotation of the sensor is estimated on the basis of the translation of the sensor appears to be reasonable. Thus, assuming that there is little rotation of the vehicle’s structure at P7 due to deformation, we may write r && Iˆ + δY && Jˆ + δZ && K ˆ δ 2 r7 / δt 2 = δX 7 7 7
(5)
r
If the angular velocity ω and, hence, the angular
r
& , as functions of time are available acceleration ω from an angular velocity transducer and, if S7 and S11 are triaxial accelerometers, then estimates of δX7, δY7, and δZ7 may be obtained from r r r r r r δ 2 r7 / δt 2 = − 2 ω x δr7 / δt − ω x (ω x r7 ) r v& r − ω xr + A 7
(6)
S7/C
Or, in matrix form for sensor Sj, ~ r& − ω ~ ω ~ r + ~r ω &r&j = − 2 ω j j j & + A Sj − A C
(7)
where ⎡X j0 ⎢ r j = ⎢Y j0 ⎢ ⎣⎢ Z j0
⎡ 0 ⎢ ~ ω = ⎢ ωz ⎢ − ωy ⎣
+ δX j ⎤ ⎥ + δYj ⎥ ⎥ + δZ j ⎥⎦
⎡ω x ⎤ ⎢ ⎥ , ω = ⎢ω y ⎥ , ⎢ω ⎥ ⎣ z⎦
− ωz
ωy ⎤ ⎥ − ωx ⎥ 0 ⎥⎦
0 ωx
and ⎡ 0 − ( Z j0 + δZ j ) (Y j0 + δY j ) ⎢ ~ 0 − (X j0 + δX j ) rj = ⎢ ( Z j0 + δZ j ) ⎢ 0 ⎢⎣− (Y j0 + δY j ) (X j0 + δX j )
In most structures, under elastic deformation conditions, the displacements δX 7 , δY7 , and
Cochran 3
⎤ ⎥ ⎥ ⎥ ⎥⎦
In Eq. (7), A C contains the components of the acceleration of the center of mass measured in the CXYZ system, while A Sj contains the components 2000
1000
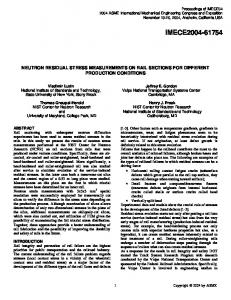
Rotational Motion and Center of Gravity Position Rotational Motion Obtained from Accelerometer Data The data taken during Autoliv’s Test B190042 include three-dimensional acceleration data from an accelerometer at the Visteon Fleet Roll Sensor, Autoliv Reference No. S1 [Ref. 1, page 18]. This additional data provides the relative acceleration of a third point in the vehicle that can be used to estimate the angular velocity and attitude of the vehicle. In the “vehicle-fixed” coordinate system, the sensor locations are identified by the respective position vectors of S1 (Visteon Fleet Roll Sensor, C.G.), S4 (Driver Rocker Panel Accelerometer at the B-pillar, DRPBP), and S9 (Passenger Rocker Panel Accelerometer at the B-pillar, PRPBP), which are r ˆ mm (8a) R1 = 1635.00 Iˆ G − 59.90 Jˆ G + 961.00 K G r ˆ mm (8b) R 4 = 2802.90 Iˆ G − 768.10 Jˆ G + 762.30 K G r ˆ mm (8c) R 9 = 2833.70 Iˆ G − 716.40 Jˆ G + 750.70 K G
Similarly, the global position vector of the center of gravity is r ˆ mm (9) R C.G. = 2073.10 Iˆ G − 24.50 Jˆ G + 975.00 K G
These points are shown in Figure 2.
C.G. DRBP PRBP DRPBP PRPBP VISTEON
1500
Z (cm)
of the acceleration of sensor Sj measured in the Sjxjyjzj system. If there is relative rotation of these coordinate systems, then we must, of course, consider that if it is necessary.
500
0 1000 500
4000 3500
0 Y (cm)
3000 2500
-500 2000 -1000
X (cm)
1500
Figure 2. Six Sensor Locations for Autoliv Test B190042 The positions of the accelerometers with respect to the C.G. are r ˆ mm r1 = − 438.10 Iˆ − 35.40 Jˆ + 14.00 K
(10a)
r ˆ mm (10b) r4 = 729.80 Iˆ − 743.60 Jˆ − 212.70 K r ˆ mm (10c) r9 = 760.60 Iˆ + 740.90 Jˆ − 224.30 K
We can use the matrix form of the relative accelerations from the three accelerometers, ~ r& − ω ~ ω ~ r + ~r ω &r&j = − 2 ω j j j &
(11)
+ A Sj − A C , j = 1, 4, 9
and assume that the structural deformation is zero at each of the accelerometers to get ~ ω ~ r + A & = −ω − ~rj ω j Sj/C , j = 1,4,9
(12)
&, We have nine equations from which we can find ω ~ but because of the skew-symmetry of the rj , we have only six independent ones. Still these are more than & so we use a weighted least we need to find, ω squares approach. We pre-multiply the jth equation by ~ rj W j , where W j is a constant, diagonal, 3x3 weighting matrix, and add the results to get ~ Iω ~ +~ & =−ω Iω r1 W1 A S1/C + ~ r4 W4 A S 4 /C ~ + r W A 9
9
(13)
S 9 /C
Cochran 4
In Eq. (13),
300
I = −~ r1 W1 ~ r1 − ~ r4 W4 ~ r4 − ~ r9 W9 ~ r9
(14)
By using the weighting matrices ⎡1 / 2 W1 = ⎢⎢0 ⎢⎣0
0 1/ 2 0
0 1/ 2 0
Phi Theta Psi
150
100
50
0 ⎤ 0 ⎥⎥ 1 / 2⎥⎦
0
(15a)
-50
0
200
400
600 Time (msec)
800
1000
1200
Figure 4. Estimated Euler Angles - No Roll Rate Sensor Data (Autoliv Test B190042)
and
⎡1 / 2 W4 = W9 = ⎢0 ⎢ ⎢⎣0
200
Euler Angles (deg)
is analogous to the inertia matrix of a rigid body and the sensor terms are analogous to torques.
250
0 ⎤ 0 ⎥ ⎥ 1 / 2⎥⎦
(15b)
we obtained the time histories for the Test B190042 angular velocity components and Euler angles of the vehicle shown in Figures 3 and 4. The weights are somewhat arbitrary, but the sum should be 1. The Visteon accelerometer output was weighted more heavily than that of the other two sensors because such weighting gives better results for pitch and yaw. Note that because the vehicle Z-axis is initially directed upward and the X-axis is rearward, a positive pitch angle puts the nose of the vehicle higher and a positive yaw angle means that the nose of the vehicle has rotated towards the left from the viewpoint of a driver. A positive roll angle is initially a rotation of the driver’s side of the vehicle toward the ground. 400
Wx Wy Wz
350
Rotational Motion Obtained by Including the Systron Roll Rate Sensor Data The data collected during Test B190042 included the output from the Systron Donner Roll Rate Sensor. Assuming that the “roll rate data” is actually the angular velocity about the X-axis of the vehicle, it may be used as the X-component of angular velocity in our estimate of angular velocity and the other two components may be obtained as indicated above. Figures 5 and 6 show the resulting time histories of the angular velocity components and the Euler angles. Note that the agreement between the time histories of the X-components of the angular velocity shown in Figure 3 and Figure 5 is very good except for the oscillatory content in ω x in Figure 5. Because the rate data was used directly to obtain Figure 5, the ω x time history shown there still has considerable oscillatory content. On the other hand, the ω x plot in Figure 3, which was obtained by integrating the accelerometer outputs after they have been filtered (60 Hz), does not have the high frequency content. 400 Wx Wy Wz
350 250
300
Angular Velocity Components (deg/sec)
Angular Velocity Components (deg/sec)
300
200
150
100
50
0
-50
250
200
150
100
50
0 -100
0
200
400
600 Time (msec)
800
1000
1200
Figure 3. Estimated Angular Velocity Components – No Roll Rate Sensor Data (Autoliv Test B190042)
-50
-100
0
200
400
600 Time (msec)
800
1000
1200
Figure 5. Angular Velocity Components Including Systron Roll Rate Sensor Data
Cochran 5
not due to the crushing, then the part of r δ2r7 / δt 2 due to deformation is
The results for the Euler angles that were obtained using the four accelerometers (CG, DRPBP, PRPBP, and VISTEON) and the Systron Donner Roll Rate Sensor are presented in Figure 6. Note that the assumption was made that the Systron Donner sensor measures the angular velocity about the X-axis, not the time rate of change of the Euler angle φ (Phi).
r r r δ 2 r7 / δt 2 deformation ≅ A S7 (t) − A C (t ) r r − [ A S7 (t start ) − A C (t start ) ]
Equation (16) may be integrated component by component if both sides are written in terms of unit vectors fixed in CXYZ. Figure 8 shows the results for the roof rail/B-pillar deflection/crush using this method. Thus, the direct integration of acceleration data provides meaningful results, if the data is chosen properly.
300
Phi Theta Psi 250
Euler Angles (deg)
200
150
600
100
50
0
200
400
600 Time (msec)
800
1000
Figure 6. Estimated Euler Angles Including Systron Roll Rate Sensor Data.
1200
Angular Velocity Components (deg/sec)
400
0
-50
(16)
Wx Wy Wz
200
0
-200
-400
Analysis of Data from B190043 -600
Although it is SAE recommended procedure, it appears that in at least one Autoliv test (B190043) no angular velocity data was collected. Also, the accelerometer S7 provided only Y- and Zaccelerations in both Autoliv tests. The angular velocity, however, may be estimated in a test not providing angular velocity sensor data, by using the vehicle CG accelerometer (S11) and any two triaxial accelerometers that are positioned such that the three are not collinear (as described infra). Figure 7 presents such an estimate obtained using sensors S4 and S9. These two are not collinear with C. The estimates of angular velocity components are similar to those in the Controlled Rollover Impact System (CRIS) study. (Carter, 2002) However, shortly after 500 ms some large changes in acceleration occur and when used in the equation for B-pillar deformations, the values for angular velocity components seem to be too large. Fortunately, there is another way to estimate the dynamic crush using Eq. (7). The terms due to angular velocity in Eq. (6) are fairly constant just before the acceleration in the B-pillar becomes very large. Thus, if the value of the righthand side of Eq. (6) at time tstart before the large r acceleration pulse is used as the part of δ2r7 / δt 2
0
100
200
300 Time (msec)
400
500
600
Figure 7. Angular Velocity Estimated from Accelerometer Data (Autoliv Test B190043) The methodology described here can be used to obtain estimates of the dynamic motion when good estimates of the angular velocity of the vehicle are known from angular velocity transducers. Even without angular velocity data, dynamic crush can be estimated through judicious use of the accelerometer data by subtracting the more constant terms due to angular velocity. The estimates of 9 inches in Ydynamic deformation and -3.5 inches in Z-dynamic deformation shown in Figure 8 are based on integrating the differential accelerations of the Bpillar over 200 ms. As shown in Figure 9, the integration of the differential accelerations starting at 500 ms actually produces a larger Y-dynamic deformation result of 10.5 inches and a slightly smaller magnitude negative Z-value of about -2 inches. These estimates compared well to the photogrammetric measurement of lateral roof deformation from the test video. Using the shorter period of time when the B-pillar was experiencing very high acceleration probably yields the better estimate. Since the Z-deformation is small, it
Cochran 6
appears that the sensor rotated very little with respect to the vehicle-fixed coordinate system. Of course, the data obtained in this manner provides a snapshot of the change in the deformation at a given time, and not the total crush time history. Since we are concerned with the relative motion of the parts of the vehicle, particularly with respect to restrained occupants, such results are very important.
Y-deformation Z-deformation
8 Y- & Z-deformations from Filtered Accelerations Minus Their Values at t = 400 ms (in)
REFERENCES Autoliv, ASP, “Final Report of SAE J2114 Rollover Crash Testing on Ford Explorer, Test Number B190043”, Autoliv ASP Automotive Technical Center, 1320 Pacific Drive, Auburn Hills, MI 48326.
10
Brogan, W. L., Modern Control Theory, Quantum Publishers, Inc., New York, 1974, p. 92.
6
4
Carter, J. W., Habberstad, J. L., Croteau J., “A Comparison of the Controlled Rollover Impact System (CRIS) with the J2114 Rollover Dolly,” SAE Paper No. 2002-01-0694, Reprinted From: Advances in Safety Test Methodology (SP–1664), SAE 2002 World Congress, Detroit, Michigan, March 4-7, 2002.
2
0
-2
-4 400
420
440
460
480
500
520
540
560
580
600
Time (ms)
Figure 8. B-pillar Dynamic Deformations Integration Start at 400 ms. (Autoliv Test B190043)
Y-deformation Z-deformation
10
8
6
Henry, M. E., “Virtual Simulation of a Pickup Truck Rollover Test using the Nonlinear Finite Element Code PAM-CRASH,” Pennsylvania State University, May 2003.
4
2
0
-2
-4 500
Fitz-Coy, N. G., and Cochran, J. E., Jr., Space Station/Shuttle Orbiter Dynamics During Docking, AAS 85-402, presented at the AAS/AIAA Astrodynamics Specialists Conference, Vail, Colorado, August 12-15, 1985. Cochran, J. E., Jr., Cheng, Y-M, Bigelow, S., Sandidge, D., and Benner, J., “Multiple Body Missile Launcher Simulation,” AAIA Paper 94-345, presented at the AIAA Atmospheric Flight Mechanics Conference, Scottsdale, AZ, August 1-3, 1994.
12
Y- & Z-deformations from Filtered Accelerations Minus Their Values at t = 500 ms (in)
rollovers. The method has been implemented in the analysis of catastrophic injuries predicted by restrained driver and passenger dummies in FMVSS 208 dolly rollover tests (refer to the authors’ submission to Docket No. NHTSA-1999-5572).
510
520
530
540
550 Time (ms)
560
570
580
590
600
Figure 9. Y- and Z-deformations of the B-pillar Integration Start at 500 ms (Autoliv Test B190043) CONCLUSIONS A method has been developed for properly processing the SUV roof rail accelerometer output data into acceptable forms for testing for both mathematical reliability and biomechanical engineering validity related to occupant protection in
Mechanical Simulation Corporation, see www.carsim.com. Meriam, J. L., Dynamics, Second Edition, John Wiley & Sons, Inc., New York, 1971, Chapter 2, Chapter 7. NHTSA, http://www.nhtsa.dot.gov/cars/problems/Rollover/cha racteristics fatalities.htm. November 24, 2003
Cochran 7