A Neural-Networks-Based Approach for Ontology Alignment B. Bagheri Hariri
H. Abolhassani
H. Sayyadi
Semantic Web Research Laboratory Computer Engineering Department Sharif University of Technology, Tehran, Iran
Semantic Web Research Laboratory Computer Engineering Department Sharif University of Technology, Tehran, Iran
Semantic Web Research Laboratory Computer Engineering Department Sharif University of Technology, Tehran, Iran
[email protected]
[email protected]
[email protected]
Abstract— Ontologies are key elements in the Semantic Web for providing formal definitions of concepts and relationships. Such definitions are needed to have data that could be understood and reasoned upon by machines as well as humans. However, because of the possibility of having many Ontologies in the web, alignment – which aims providing mappings across them – is a necessary operation. Many metrics have been defined for ontology alignment. The so-called simple metrics use linguistic or structural features of Ontological concepts to create mappings. Compound metrics, on the other hand, combine some of the simple metrics to have a better results. This paper reports our new method for compound metric creation. It is based on a supervised learning approach in data mining where a training set is used to create a neural network model, performs sensitivity analysis on it to select appropriate metrics among a set of existing ones, and finally constructs a neural network model to combine the result metrics into a compound one. Empirical results of applying it on a set of Ontologies is also shown in this paper.
I. I NTRODUCTION Semantic Web is said to be the next generation of Web where contents can be understood by machines as well as human 1 . Ontology layer is the central layer in the proposed architecture for web where upper layers (i.e. logic, rules and trust) are dependent on it. An Ontology provides a shared vocabulary so that two agents can understand what is communicated. However, by design, web is decentralized. This means that it is unrealistic to expect to have a single Ontology that all parties are agreed upon. On the other hands, many entities in different Ontologies may refer to a single concept. To provide inter-operability therefore it is needed to be able to find such relationships between entities of different Ontologies. Such relationships are formally represented as Mappings. Mappings are used in the Ontology Alignment task to provide final conclusion of relationships between entities in different Ontologies. Many ideas have been reported to create mappings and it is customary to define some similarity or distance metrics to provide necessary information for mapping creations [1]. A Similarity σ : O × O → R is a function from a pair of entities to a real number expressing the similarity between two objects such that: 1 Wrote by Tim Berners-Lee, James Hendler and Ora Lassila in their Scientific American article ”The Semantic Web”
∀x, y ∈ O, σ(x, y) ≥ 0 ∀x ∈ O, ∀y, z ∈ O, σ(x, x) ≥ σ(y, z) ∀x, y ∈ O, σ(x, y) = σ(y, x)
(positiveness) (maximality) (symmetry)
Of popular metrics we can mention Edit Distance [2], measuring String Similarity between entities under consideration, Resnik Similarity [3] and Upward Cotopic distance [4] that measures Linguistic and Structural similarities and distances. These are referred to as simple metrics. Another developed idea is to combine metrics and create a new compound metric with the hope that there would be possible to create better mappings. The goal of the paper is to present an approach for selecting appropriate metrics for aligning ontologies, from many available metrics. This problem is reformulated as a feature selection problem, where the metrics are seen as features of a data set for predicting if any two terms in an ontology can be mapped to each other or not. The inherent feature selection capabilities of neural networks are exploited. After selection of a number of metrics they are weighted and used in a compound one. Therefore there are two main tasks in creating a compound metric. One is the selection of appropriate metrics for combination and the other is the selection of appropriate weights. In this paper we use Neural Networks to solve both of these problems. The rest of this article is organized as follows. In section II, a review of related works is given. Our proposed method for metrics selection and metrics combination is explained in Section III and Section IV shows evaluations on it. Section V is a conclusion discussing about the advantages and disadvantages of the proposed method. II. R ELATED W ORKS In this section at first related works for evaluation and comparison of metrics is explained. Then a review on famous works for compound metrics creation is discussed. A. Comparison of Metrics To show the effectiveness of a metric and compare it to others it is customary to develop a framework in which
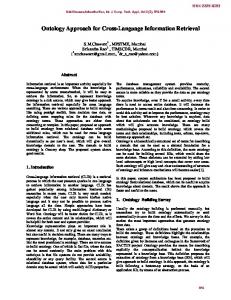
the metric is implemented. Then a test set is applied on the framework and the mappings that are created by the metrics are calculated. After interpretation of the results, some measurements are done. Figure 1 shows this process. The upper rectangle in this figure shows a simplified Ontology alignment framework. The aim is to show the problem current evaluation methods. As is clear in the figure, customary evaluation methods uses already known mappings to judge about the results of a method after applying Aggregate Results and Interpretation Results operations.
0
Pn
0
i=1
∀x, x ∈ O, δ(x, x ) =
delta(x, x0 )p p
(4)
In which δ(xi , x0i ) is the dissimilarity of the pair of objects along the ith dimension. Therefore having a set of distance metrics we can combine them this way to a compound distance metric. Another approach is to use the weighted sum [1] between two such objects: 0
0
∀x, x ∈ O, δ(x, x ) =
n X
wi × δ(xi , x0i )
(5)
i=1
Also we can consider the weighted product as below: ∀x, x0 ∈ O, δ(x, x0 ) =
n Y
δ(xi , x0i )λi
(6)
i=1
Fig. 1.
Traditional approach to metrics evaluations
Many of the algorithms and articles in Ontology Alignment context uses Precision and Recall or their harmonic mean, referred to as F-Measure, to evaluate the performance of a method [5]. Also in some articles, they are used to evaluate alignment metrics [6]. In such methods after aggregation of results attained from different metrics, and extraction of mappings - based on one of the methods mentioned in [1] the resulting mappings are compared with actual results. Then Precision and Recall values are computed as below: P recision =
T rue F ound M appings All F ound M appings
(1)
T rue F ound M appings (2) All Existing M appings Accuracy is another measure defined for this purpose. It is proposed for evaluation of automatic ontology alignment [7]. This quality metric is based upon user efforts needed to transform a match result obtained automatically into the intended result. This value can be represented as a combination of Precision and Recall: Recall =
1 Accuracy = Recall × (2 − ) P recision B. Compound Metric Creation
(3)
In this section we briefly review famous works for compound metric creation. Let O be a set of objects which can be analyzed in n dimensions. Here each dimension represents a metric. Then the Minkowski distance [1] between two such objects is:
There is also Learning based methods. In this group of methods, using machine learning techniques, some coefficients for weighted combination of metrics are attained. Optimal weights in such methods are calculated by defining or proposing some specific measures and applying them on a series of test sets - an ontology couple with actual mappings between their elements. One of such methods is Glue [8]. Glue use machine learning techniques to find mappings. It first applies statistical analysis to the available data. Then generates a similarity matrix, based on the probability distributions, for the data considered and use ”constraint relaxation” in order to obtain an alignment from the similarity. In [1] they use a set of basic similarity measures and classifiers each operating on different schema element characteristics. These classifiers provide local scores which are linearly combined to give a global score for each possible tag. The final decision corresponds to the mediated tag with the highest score. Combining the different scores is a key idea in their approach. The work closest to ours is probably that of Marc Ehrig et al. [9]. In APFEL weights for each feature is calculated using Decision Trees. The user only has to provide some ontologies with known correct alignments. The learned decision tree is then used for aggregation and interpretation of the similarities. III. N EURAL N ETWORKS Our proposed method for metric evaluation, as well as compound metric creation is based on Neural Networks. This section explains the details of the method. A. Metrics Evaluations by Neural Networks To use Precision, Recall, F-measure and Accuracy for metric evaluation, it is necessary to perform mapping extraction. Such a task depends on the definition of a Threshold value, as well as the approach for extracting, and some other pre-defined constraints. Such dependencies results in in-appropriateness of current evaluation methods. We propose a new method for evaluation of metrics and creating a compound metric from some of them without any
need to the mapping extraction phase. Like other learningbased methods, it needs an initial training phase, in which an ontology pair with actual mappings in them is fed in the algorithm. A few metrics, along with their associated category are also considered. A category represents metrics which share similar processing behaviors. For example, each of String Metrics, Linguistic Metrics, Structural Metrics and so on are considered as a category. Our proposed algorithm selects one metric from each category. Therefore, if it is intended to be used on a specific metric, we can define a new category and introduce the metric as its mere member so far. Our aim behind defining categories and assigning metrics to them is that, in combining metrics, usually String and Linguistic based metrics are more influential than others, and, therefore if we don’t use such a categorization, and apply the algorithm on a set of un-categorized metrics, most of the selected ones are linguistic-based, and which results in a lower performance and flexibility of algorithm on different inputs. Having metrics and their associated categories, the algorithm selects the best metric from each category and proposes an appropriate method to aggregate them. To do this a data mining approach is considered. Therefore, we need to formulate the problem in a way that a Data Mining algorithm can be applied on. For this purpose we operate as mentioned in the following sections. One of the customary problems in Data Mining area is to create a model for calculating values of a variable named as Target Variable based on the values of some other variables referred to as Predictors. In supervised-based learning methods, having a suitable training set, the model is constructed. Various approaches have been developed in this regard. The one which is used in this paper for the Ontology Alignment problem is based on neural networks. The idea stems from the fact that in Ontology Alignment we have a number of measures acting as predictors, and the goal is to find their importance or effects on the target variable – which turns out to be the actual mappings across ontologies. Such an interpretation reduces the alignment metric evaluation problem to a data mining one. The detail of the approach is as follows: For a pair of Ontologies, a table is created with cells showing values of a certain (set of) comparison metric(s), of an entity from the first ontology to an entity from the second. For each pair of elements across the ontologies, and for each metric for finding mappings, we associate a number which is the predicate of that metric on the similarity (or distance) between the pair. We present this in a table rows of which stand for the pairs, while its columns stand for the metrics. There is a further column in this table which shows whether or not there exists a mapping between the pair in the real world. The cells of this final column will be either 0 or 1, based on the existence of such a mapping. All of such tables are aggregated in a single table. In this final table the column representing actual mapping value between a pair of entities is considered as the target variable and the rest of columns are predictors. The problem now is a typical data mining and then we can apply classic data mining
techniques to solve it. Fig. 2 shows the process. In this figure the proposed method is shown. In it, Similarity Measures represents metrics being used. Also Real Mappings are actual mappings between entities of input Ontologies which are obtained from train set. The middle table is constructed as explained before in which m1 , m2 and m3 are values from different metrics and the last column, real, is the actual mapping between two entities. Neural Networks, C5.0 and Cart are models which are used to find the most influential measures. Right oval shows the results obtained from different models with numbers showing the priority value of each metric. As suggested in the figure we can apply any
Fig. 2.
Formulation of the problem as a Data Mining problem
learning based model like Neural Networks [10], C5.0 and CART [11] decision trees. However in our experiments neural network model has shown the better response and therefore we explain its results in this paper. Figure. 3 shows a sample neural network model for this problem. Inputs to the network are values of metrics (for example M1, M2 and M3 in the Fig. 2). The output of the network having the real values in each row of the able neural network training is done to find appropriate weights. A Neural Network consists of a layered, feed forward, completely connected network of artificial neurons, or nodes. The neural network is composed of two or more layers, although most networks consist of three layers: an input layer, a hidden layer, and an output layer. There may be more than one hidden layer, although most networks contain only one, which is sufficient for most purposes. Fig. 3 shows a Neural Network with three layers. Each connection between nodes has a weight (e.g., W1A ) associated with it. At initialization, the weights are randomly assigned to values between 0 and 1.
Fig. 3.
A Simple Neural Network Model
After the training is complete a Sensitivity Analysis [10] is done. In it ,with varying the values of input variables in the
acceptable interval, the output variation is measured. With the interpretation of the output variation it is possible to recognize most influential input variable. To do it, at first the average value for each input variable is given to the model and the output of the model is measured. Then Sensitivity Analysis for each variable is done separately. For this purpose, the values of all variables except one in consideration are kept constant (their average value) and the model’s response for minimum and maximum values of the variable in consideration are calculated. This process is repeated for all variables and then the variables with higher influence on variance of output are selected as most influential variables. For our problem it means that the metric having most variation on output during analysis is the most important metric. When one apply the above method on a category of metrics, the most influential one is recognized. The selected metrics from each category is then used to create a compound metric. Similar to the evaluation method, a table is constructed here too. As before, columns are the values of selected metrics and an additional column records the target variable (0 or 1) showing the existence of a mapping between two entities. Now having such training samples a neural network is built. It is like a combined metric from the selected metrics which can be used as a new metric for the extraction phase. IV. E XPERIMENTAL R ESULTS In this section results of the explained method is shown. Levenshtein [2], NeedlemanWunsch [12], SmithWaterMan [13], MongElkan [14], JaroWinkler [15], [16] and Stolios [6] measures has been implemented using Jena API 2 . To be able to recognize mappings between entities with synonym names, a lexical measure which uses WordNet 3 is employed. In it first a word is divided to its parts. For example bipedalPerson is divided to bipedal and person terms. Then using WordNet similarity of two words is calculated as follows:
ws(w1 , w2 ) =
|terms(w1 ) ∩ terms(w2 )| max(|terms(w1 )|, |terms(w2 )|)
(7)
Where ws stands for Wordnet Similarity, terms is a function which get a word as input and return a set of the terms of that word as output, and ∩ is an operator which returns a set which contains terms which are synonym using WordNet. EON2004 [5] data set is used for the Ontology Evaluation. From the tests in this collection tests numbered 203, 205, 222, 223, 230 are used to create initial train set necessary for our neural network model. In this test the reference ontology is compared with a modified one. Tests 204, 205, 221 and 223 are used from this group. Modifications involved naming conversions like replacing the labels with their synonyms as well as modifications in the hierarchy. We use these tests as a training set. 2 http://jena.sourceforge.net 3 http://wordnet.princeton.edu
Also tests numbered 302, 303 and 304 are used as validation set. The reference ontology is compared with four real-life ontologies for bibliographic references found on the web and left unchanged. We use tests 302, 303 and 304 from this group. This is the only group which contains real tests and may be the best one for evaluation of an alignment method. After preparation of the train set table, Sensitivity Analysis as explained before is applied. Table 4 displays results of applying similarity analysis on each test set. In this table, second column shows the relative importance of metrics used in the corresponding data set. As it is clear from the results, Levenshtein similarity is the most important one in predicting the relation of entities. Levenshtein Similarity Wordnet Similarity Smith Waterman Similarity Needleman Wunsch Similarity Mong Elkan Similarity Jaro Winkler Similarity Stolios Similarity
0.416 0.415 0.023 0.011 0.010 0.006 0.004
TABLE I C ALCULATING O PTIMAL R ELATIONSHIP C OUPLE
In the training phase five different models has been created explained hereafter. To obtain these models alpha=0.95, initial Eta=0.3 and Eta Decay=30 has been used. • T.1- In this test all the measures has been considered. To obtain a satisfactory model a dynamic approach to find a good value for number of layers and the number of neurons in the hidden layer is employed. As a result a four layered model with h 7, 4, 5, 1 i neurons in input layer, two hidden layer and output layer, correspondingly, has been constructed. • T.2- In this test Levenshtein and WordNet based measures which are selected from previous test is used. Here another four layer Neural Network with h 2, 3, 4, 1 i nodes is constructed as shown in Figure 4. According to this model and values obtained from Levenshtein and Wordnet based methods by observing the output node it is possible to decide if two entities are correspond. • T.3- In this test only Stolios measure is used. The constructed model is in h 1, 2, 2, 1 i form. • T.4- In this test only WordNet measure is used and the constructed model is also in h 1, 2, 2, 1 i form. • T.5- In this test Levenshtein and Wordnet measures has been used. The created model is in h 2, 40, 30, 1 i form. The results of applying validation set on each of the models is shown in the Fig. 5. In the figure F-Measure is the harmonic mean of Precision and Recall. Precision is the proportion of correctly recognized mappings to all the recognized mappings and Recall is the proportion of correctly recognized mappings to all the existed mappings. Also Test 1 · Test 5 shows the models of for T. 1 · T. 5 as described. It should be noted that this results are obtained without any filtering or extraction operations. Applying such operations will results on higher
Fig. 4.
A Simple Neural Network Model
precision since some un-related mappings will be eliminated.
this method is that we can add cluster value as a new column to influence its importance for combination of metrics. A negative point of this method is that it can only recognize mappings of equality type. For example it lacks the ability to recognize mappings of subclassof type. A remedy is to draw such mappings in interpretation and extraction phase based on the structure of the input ontologies. Alongside the future works, a broader framework will be studied aiming the leverage of a vaster range of metrics, and enabled for categorized-learning - based on above-explained method. We will scrutinize further the role of some other data mining methods such as association rules and clustering in both the compound similarity calculation phase and mapping extraction phase. ACKNOWLEDGEMENTS The authors would like to say thanks to their colleagues in Semantic Web Laboratory of Sharif University of Technology for their valuable comments and review of the paper, specially to Seyed H. Haeri, H. Sayyadi. R EFERENCES
Fig. 5.
Results of Applying the Model On EON Data Set
As it is obvious from the figure, without using any customary heuristics and only using some simple linguistic measures, satisfactory results are obtained. In practice we should use measures from other categories like structural or instance based measures which we expect to result in higher precision. V. C ONCLUSION AND F UTURE W ORKS Two advantages of the evaluation method are the metrics do not need threshold in this method and the uniform treatment of Similarity and Distance metrics so that we don’t need to differentiate and process them separately. This is because in Data Mining evaluation methods such as Sensitivity Analysis there is no difference between a variable and a linear form of it. The main advantage of the creating compound similarity using this method is its independency to the specific metrics and therefore it is possible to extract mapping by several metrics. The method can be improved when new metrics are introduced in such cases it is only needed to add some new columns and do learning to adjust weights. Also with the experiments and researches in evaluations and selection of metrics, many researches have concluded that for different categories of ontologies metrics has varying values. Therefore most of the researchers have emphasized on clustering and application of metrics for clusters as their future works. Another advantage of
[1] J. Euzenat, T. L. Bach, J. Barrasa, P. Bouquet, and eds., “State of the Art on Ontology Alignment,” Knowledge Web, Statistical Research Division, Room 3000-4, Bureau of the Census, Washington, DC, 202339100 USA, Tech. Rep. deliverable 2.2.3, August. [2] V. Levenshtein, “Binary Codes Capable of Correcting Deletions, Insertions and Reversals,” Soviet Physics-Doklady, vol. 10, pp. 707–710, August 1966. [3] J. Zhong, H. Zhu, Y. Li, and Y. Yu, “Using information content to evaluate semantic similarity in a taxonomy,” in Proceedings of the 14th International Joint Conference on Artificial Intelligence (IJCAI95), 1995. [4] A. Maedche and V. Zacharias, “Clustering ontologybased metadata in the semantic web,” in Proceedings of the 13th ECML and 6th PKDD, 2002. [5] Y. Sure, O. Corcho, J. Euzenat, and T. Hughes, Eds., Proceedings of the 3rd Evaluation of Ontology-based tools, 2004. [6] G. Stoilos, G. Stamou, and S. Kollias, “A String Metric for Ontology Alignment,” in Proceedings of the ninth IEEE International Symposium on Wearable Computers, October 2005, pp. 624–237. [7] S. Melnik, H. Garcia-Molina, and E. Rahm, “A versatile graph matching algorithm,” in Proceedings of ICDE, 2002. [8] A. Doan, P. Domingos, and A. Halevy, “Learning to match the schemas of data sources: A multistrategy approach,” Machine Learning, vol. 50, no. 3, pp. 279–301, 2003. [9] M. Ehrig, S. Staab, and Y. Sure, “Bootstrapping ontology alignment methods with APFEL,” in Proceedings of the 4th International Semantic Web Conference (ISWC-2005), ser. Lecture Notes in Computer Science, Y. Gil, E. Motta, and R. Benjamins, Eds., 2005, pp. 186–200. [10] D. T. Larose, Discovering Knowledge In Data. New Jersey, USA: John Wiley and Sons, 2005. [11] L. Breiman, J. H. Friedman, R. A. Olshen, and C. J. Stone, Classification and Regression Trees. Belmont: Wadsworth, 1984. [12] S. Needleman and C. Wunsch, “A General Method Applicable to the Search for Similarities in the Amino Acid Sequence of two Proteins,” Molecular Biology, vol. 48, 1970. [13] T. Smith and M. Waterman, “Identification of Common Molecular Subsequences,” Molecular Biology, vol. 147, 1981. [14] A. E. Monge and C. P. Elkan, “The Field-Matching Problem: Algorithm and Applications,” in Proceedings of the second international Conference on Knowledge Discovery and Data Mining, 1996. [15] M. Jaro, “Probabilistic Linkage of Large Public Health Data Files,” Molecular Biology, vol. 14, pp. 491–498, 1995. [16] W. E. Winkler, “The State Record Linkage and Current Research Problems,” U. S. Bureau of the Census, Statistical Research Division, Room 3000-4, Bureau of the Census, Washington, DC, 20233-9100 USA, Tech. Rep., 1999.