In another work Luedeling et al., (2007) proposed a TIN-based method for filling voids ..... Whole Planet, ASPRS 2005 Annual Conference, Baltimore,. MD, USA.
ISPRS Annals of the Photogrammetry, Remote Sensing and Spatial Information Sciences, Volume III-1, 2016 XXIII ISPRS Congress, 12–19 July 2016, Prague, Czech Republic
A NEW ALGORITHM FOR VOID FILLING IN A DSM FROM STEREO SATELLITE IMAGES IN URBAN AREAS Z. Gharib Bafghi a, *, J. Tian a, P. d’Angelo a , P. Reinartz a a
German Aerospace Center (DLR), Remote Sensing Technology Institute, D-82234 Wessling, Germany (zeinab.gharibbafghi, jiaojiao.tian, pablo.dangelo, peter.reinartz)@dlr.de Commission I/4
KEY WORDS: DSM, Void Filling, Stereo Satellite Images, Orthorectification, Mean-Shift Segmentation
ABSTRACT: Digital Surface Models (DSM) derived from stereo-pair satellite images are the main sources for many Geo-Informatics applications like 3D change detection, object classification and recognition. However since occlusion especially in urban scenes result in some deficiencies in the stereo matching phase, these DSMs contain some voids. In order to fill the voids a range of algorithms have been proposed, mainly including interpolation alone or along with auxiliary DSM. In this paper an algorithm for void filling in DSM from stereo satellite images has been developed. Unlike common previous approaches we didn’t use any external DSM to fill the voids. Our proposed algorithm uses only the original images and the unfilled DSM itself. First a neighborhood around every void in the unfilled DSM and its corresponding area in multispectral image is defined. Then it is analysed to extract both spectral and geometric texture and accordingly to assign labels to each cell in the voids. This step contains three phases comprising shadow detection, height thresholding and image segmentation. Thus every cell in void has a label and is filled by the median value of its co-labelled neighbors. The results for datasets from WorldView-2 and IKONOS are shown and discussed.
1. INTRODUCTION 1.1
Problem Statement
DSMs which are automatically generated from stereo satellite image matching procedures tend to have many null locations socalled voids or holes. These voids are mainly due to mismatching in occluded, shadow and low signal areas. Prior to every 3D analysis these voids have to be filled to get a seamless DSM. Since the digital elevation models are the basis for all 3D analysis in Photogrammetry and Remote Sensing, i.e. change detection, object recognition and reconstruction, the reliability of the estimated values for these voids is of high importance. Therefore void filling procedures has inevitably been one of the inseparable parts of all photogrammetric projects. Consequently many researchers and scientists have developed algorithms to provide filled DSMs for users. A majority of early reported approaches as well as latter ones include simply interpolation of holes, since the nature of void filling operation is estimation of unknown values. Many different interpolation methods have been developed and evaluated with regard to different types and shapes of ground surfaces (Reuter et al., 2007). Inverse distance weighting (IDW) and kriging have been reported as the most frequently used methods, the first one mainly for areas with manmade objects and the latter one for the environmental applications. Although simple interpolation sounds efficient to fill the small gaps in DSM, still there are some cases in which it fails. In such cases, especially occurring in the automatically generated DSMs from stereo satellite images with a large stereo angle, some holes may cover large areas or even mask some small objects. As a result, a complementary method has been frequently reported in the literature through which an auxiliary available DSM is utilized
as a reference to fill the gaps (Dowding et al. 2004, Kuuskivi et al, 2005, Grohman et al., 2006, Luedeling et al, 2007, Ling et al, 2007, Krauß et al, 2009, Hoja et al, 2009, Krauß et al, 2012, Tran et al, 2014). Filling the holes in a digital elevation model by filling in data from another source is also sometimes called “fusion” in the literature, or at least seen as one step of fusion (Schindler et al, 2010). Amongst all reported methods in this concept, one can find three main approaches including fill and feather (Dowding et al. 2004), delta surface fill (Grohman et al., 2006), and moving window applying erosion technique (Karkee et al., 2008). 1.2
Literature Review
Since 2000, DEM from Shuttle Radar Topography Mission (SRTM) has being widely used as the main reference for elevation data in many 3D geospatial analysis processes. Primary SRTM DEM has many small and large holes due to the complex nature of IFSAR Technology; dielectric constant (Luedeling et al., 2007 ) beside other sources like shadowing (Grohman et al., 2006). The majority of researches on the problem of DSM void filling are dedicated to the filling of holes in SRTM DEM. As one of earliest work (Dowding et al., 2004), a fill and feather method (FF) has been developed in which the most accurate available DSM is replaced in the no-data area in unfilled DEM following by smoothing of abrupt changes in the transition areas. To do that they remove the bias of alternative surfaces by adding a constant and then feathered at the edges to provide a seamless transition (Yue at al., 2011). Another well-known and commonly used method is DSF in which also an auxiliary DSM is used, called fill source. Resampling the fill source they create
* Corresponding author
This contribution has been peer-reviewed. The double-blind peer-review was conducted on the basis of the full paper. doi:10.5194/isprsannals-III-1-55-2016
55
ISPRS Annals of the Photogrammetry, Remote Sensing and Spatial Information Sciences, Volume III-1, 2016 XXIII ISPRS Congress, 12–19 July 2016, Prague, Czech Republic
a Delta Surface as the difference of SRTM and a resampled fill surface. Then the fill surface posts are adjusted to a seamless transition from the original SRTM data. Finally each interpolated post value in the Delta Surface is combined through addition with its corresponding fill post and placed inside the SRTM void (Grohman et al., 2006). In another work Luedeling et al., (2007) proposed a TIN-based method for filling voids in SRTM. They extracted points around the edge of the void from the SRTM DEM and the fill surface. TINs were calculated from these points and converted to a base surface for each dataset. The fill base surface was subtracted from the fill surface, and the result added to the SRTM base surface. The fill surface could then seamlessly be merged with the SRTM DEM (Luedeling et al. 2007). Like the previously described methods, in (Ling et al, 2007) an algorithm for filing voids in SRTM DEM using an auxiliary DSM is developed. They considered the problem of filling as fusion with a Landsat DSM. In the same way Obrock and Guth (2005) as well as Karkee et al. (2006) used an ASTER DEM to fill the holes in SRTM. Hoja and d’Angelo (2009) also evaluate the potential of DSM combination to provide a gap-less DSM. They used three combination methods including DSM fusion utilizing a height error map, DEM integration during triangulation process and DSF algorithm to fill the holes in the digital surface model. They utilized a DSM from high resolution optical stereo imagery and the SRTM DEM. Hogan et al. (2010) proposed a method to fill the voids in SRTM using shadowing cues detected from multispectral satellite image. They derived a geometric shadow constraint from one or more images and in combination of terrain correction methods for refining digital elevation model in mountainous area. Yue et al. (2011) developed an approach based on the first fundamental coefficients and the second fundamental coefficients of surfaces. They also used SRTM30 DEM as auxiliary data. Similar to the above mentioned methods, many recently reported researches also used an auxiliary DSM to fill the voids. Since interpolation is the most relevant approach to fill the holes in digital surface models many researchers have analysed and evaluated different interpolation methods. Reuter et al. (2007) has reported the evaluation of different interpolation methods for filling voids using SRTM30 as auxiliary data. They used Kriging, Spline, Trend, IDW, Moving Window Average, FF, TIN, and advanced Spline Method. Their results show that the best methods are “kriging or inverse distance weighting interpolation for small and medium size voids in relatively flat low-lying areas; spline interpolation for small and mediumsized voids in high altitude and dissected terrain; triangular irregular network or inverse distance weighting interpolation for large voids in very flat areas, and an advanced spline method (ANUDEM) for large voids in other terrains” (Reuter et al., 2007). The majority of previous researches were dedicated to fill voids in SRTM DEM and many researchers use the well-known developed methods amongst them to fill DSM from other sources especially stereo satellite imagery. As one of recently reported work in this area in (Krauß et al., 2012) a method for filling holes and remove blunders in DSM generated from dense matching of a WorldView-1 stereo pair is developed. They first categorized all different types of holes in the DSM and then for each type utilized a context-based approach for filling. With regard to all previous reported method one can conclude that there is no best-method for all types of terrain and all types of voids. And almost all reported common methods for void filling utilize an available DSM as auxiliary data. Here we propose a new algorithm for void filling that doesn’t need any other source for DSM.
2. PROPOSED METHOD In this paper we propose a novel approach to fill the voids in DSM from stereo satellite images without an auxiliary digital model. We only use the original satellite images from which the unfilled DSM has been driven. The proposed algorithm (Figure 1) contains two main steps; void labelling and then filling. In the first step a sub-area encompassing the void is inspected to learn the spectral and geometric specifications. We use corresponding multispectral image and the unfilled DSM itself. The void in DSM is then superimposed on the segmented and labelled image and now each cell in the void in unfilled DSM has its own spectral label.
Figure 1. Flowchart of proposed algorithm 2.1
Data Preparation
In order to use the original image it should be orthorectified before segmentation, otherwise the labels wouldn’t overlay on the correct position in unfilled DSM and voids. For this sake there must be a surface model of the scene. As we want to avoid using an auxiliary DEM, first the unfilled DSM has to be filled by simply fast interpolation to get an initial seamless surface model. This initial course DSM then is used for georeferencing the corresponding satellite images. Although the probable errors in this imprecise initial DSM may cause some errors in the resulting ortho-images they are negligible for areas not including very high buildings and especially for images with a rather small stereo angle which is the case in many of current satellite images. The procedure is explained in subsection 2.1.1. 2.1.1 Orthorectification (Pan-sharpening): The DSM generation method used in this paper is Semi-Global Matching approach (SGM) (Hirschmueller, 2008). In order to fill the DSM from SGM to have an initial seamless model, the following steps are done. First the DSM is segmented into regions where each neighboring height is allowed only do deviate by a given threshold. The threshold should be chosen so that it is close to the height accuracy of the matching (i.e. height for a disparity change of one). Then the holes will be filled using inverse distance weighted (IDW) interpolation or simply mean value of the lowest neighboring segments. The resulting initial DSM then is used to rectify both Pan and Multispectral images or briefly generate pan-sharpened image.
This contribution has been peer-reviewed. The double-blind peer-review was conducted on the basis of the full paper. doi:10.5194/isprsannals-III-1-55-2016
56
ISPRS Annals of the Photogrammetry, Remote Sensing and Spatial Information Sciences, Volume III-1, 2016 XXIII ISPRS Congress, 12–19 July 2016, Prague, Czech Republic
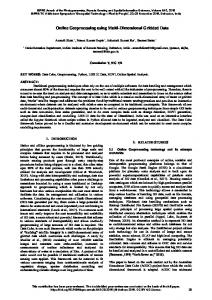
For image orthorectification we use the method proposed in (d’Angelo et al, 2012). In Figure 2 an example of the results for this procedure is shown.
Figure 2. (a) Unfilled DSM- voids in dark blue, (b) initial coarse filled DSM, (c) orthophoto generated by the coarse filled DSM 2.1.2 Void refinement: In DSMs from stereo satellite images mismatches and consequently voids often exist around the edges of buildings due to occlusions caused by the height difference. That may also lead to many small holes instead of a large void around a building (Figure 3). This could cause some artefacts in the filling process. Therefore in the pre-processing step here a morphological binary closing operator on the void region is applied to integrate tiny holes and have a rather seamless refined void. Here also voids smaller than 16 pixels are temporarily ignored during the labelling phase, since they are less likely to represent a meaningful pattern in the data. Such small voids are later estimated simply by interpolation.
Figure 3. Left: the original voids around a building (in dark blue), right: the void after morphological closing
2.2
Labelling of voids
After data preparation, in the first step of the proposed algorithm each void is analysed in the corresponding image to get a label regarding the segment they belong to. Generally in a DSM there are voids with different sizes. Small holes and even some larger holes may fall into only one segment while the others could consist of areas from different objects or different surfaces. To have fine results and preserve the edges especially in height discontinuities which often exist in urban scenes, we assign three different labels to each cell in a void. These three labels are driven from two main scenarios; from spectral information analysis and height (geometric) information inspection. From the first scenario we exploit labels via image
segmentation as well as shadow detection and from the geometric point of view a thresholding is implemented in order to separate objects and background in height data. 2.2.1 Shadow Detection: Shadowing is one source of failure in the matching procedure. Therefore some of voids happen in shadowed area. This could be considered as a constraint that shadow of taller object falls over the shorter ones. In the same way detected shadows in a multispectral satellite images could represent the geometric texture on the same location in corresponding DSM. Depending on the overall density and texture of urban scenes, shadows may have precious information about buildings, surrounding ground and the borders between them. For example in less dense urban areas shadows are more likely to be on the ground not on the building. For shadow detection from multispectral satellite images, many algorithms have been proposed. Generally as the shadow increases, red and NIR reflectance decreases but the normalised difference between the two increases (Hogan et al., 2010). The formula proposed in (Shahi et al, 2014) is used here to automatically detect shadows. 2.2.2 Thresholding: Although an unfilled DSM implies null regions, we still have some precious information about these areas. Within the window comprising each shadowed region coincident with a hole, one can divide the height data into those on the taller object (i.e. that occludes and shades), lower one socalled background (i.e. the surface on which the shadow falls) and void. The division between these areas is performed by a thresholding process. Therefore a threshold value needs to be set. Here we use the max value of elevations within shadowed area in the unfilled DSM as a threshold; three coarse regions are separated as shown in Figure 4.
Figure 4. Left: light green: Building, dark green: shadow, light purple: ground, dark purple: void, right voids coincident with shadows are filled by median value of background (remaining voids are in dark blue). Not all shadows cause voids. Therefore after shadow detection in the multispectral image, wherever shadows coincide with a void, the height texture of DSM is analysed. Finally those null cells are filled with the median value of surrounding background as shown in Figure 4-right. 2.2.3 Image Segmentation: In order to employ spectral information for void filling in a DSM, the corresponding satellite image needs to be segmented. Image segmentation as one of the main basis of many applications is a very challenging issue. Therefore so many researches have been done to find the most proper segmentation algorithm. With regard to the previous findings, there is no ‘best’ segmentation algorithm for all problems. This means that it is a problem-dependent issue. Here we use mean-shift segmentation algorithm to separate different surfaces in a HR satellite image.
This contribution has been peer-reviewed. The double-blind peer-review was conducted on the basis of the full paper. doi:10.5194/isprsannals-III-1-55-2016
57
ISPRS Annals of the Photogrammetry, Remote Sensing and Spatial Information Sciences, Volume III-1, 2016 XXIII ISPRS Congress, 12–19 July 2016, Prague, Czech Republic
Mean-Shift segmentation is a popular method that has been reported to be effective in many computer vision tasks (Zhongli et al., 2014). It is a powerful and versatile non parametric iterative algorithm which is generally used to extract objects like roads, water bodies etc. from satellite images of various resolutions (Banerjeea et al., 2012). Mean-shift considers the points in the feature space as sampled from an unknown probability density function. The mean-shift vector defined in equation (1), points towards the direction of maximum increase in the density. This is followed by iteratively re-computation of the mean-shift vector and translation of the kernel G(x) by the corresponding vector.
used here, simply the median value of them. It can guaranty to get sharper edges between high objects such as buildings and their neighbors. Clearly both the accuracy of shadow detection and the selected threshold could affect the results in this phase. This means that tuning the threshold would alter the shadow candidates. Here we set a strict value to assure to get the least but the strongest shadow candidates. Finally for the rest of large holes in unfilled DSM, the algorithm is as below; I.
For each void in unfilled DSM; For each unknown cell P, a. Get the corresponding label L came from mean-shift segmentation. b. Define a neighborhood around P, c. Search for the co-labeled (L) neighbors; n, d. If n > 3, then estimate the value of P, else go to i, ii. Go to I until DSM is completely filled. i.
(1)
G(x) = c (|| g(x) ||)2 Where
(2)
h > 0 is the bandwidth parameter g (x) is kernel function c is a non-negative constant
At the end of the above algorithm, every null cell is filled, except those smaller than 16 pixels. In final phase they are simply interpolated from neighboring points.
The parameter ‘bandwidth’ for segmentation controls the number of clusters. A very small value might result in too many clusters. And a large one may fail to distinct different surfaces. Additionally in order to have finer results and more precise borders between objects, a combination of spectral bands and Pan seems to be necessary. In Figure 5 examples of mean-shift segmentation on the satellite images are shown.
Figure 5. Mean-shift segmentation Figure 6. Overlaying detected shadows from multispectral image on the DSM voids Since segmentation is run for each void within its neighborhood, with an increase in size of input data, the time of execution will increase. In that case for large datasets and/or with large number of voids, it is more beneficial to segment the image as a whole and label all pixels at once. It may decrease the computational load but at the same time may lead to a coarser result for segmentation. Accordingly we should make a trade-off to save time and efficiency. 2.3
Void Filling
At the end of the labelling phase, every null cell has three labels. Filling then is done with regard to both geometric and spectral labels inside a neighborhood. First each hole in shadowed area is filled by the median value of background cells in its own vicinity. As shown in figure 6 overlaying detected shadows from multispectral image on the DSM we could distinct the shadowed void areas. Then as mentioned in sections 2.2.1 and 2.2.1, these areas could be considered as ground and/or shorter objects and be filled with either an interpolated value of surrounding ground values or, as
3. RESULTS AND EVALUATION To test the proposed algorithm we used four datasets consisting of two WorldView-2 stereo pairs; one from Munich, one from Istanbul, and also an IKONOS stereo pair taken from Munich, (Figure 7). Then the corresponding area of each void and its vicinity in the pan-sharpened image is segmented to assign every cell a segment label. To fill the no-data cells in DSM, the median value of the co-labelled neighbors within their neighborhood is set. Figure 8 shows the final results for filled DSMs of the three test datasets. Our proposed method in this paper is evaluated both qualitatively and quantitatively. For the Munich dataset we used a Lidar DEM (here named as DSMref) as a reference model and a DSM generated by the integration of DSMs from four stereo pairs (here named as DSMg) of the same area. In the same way as a second reference for IKONOS data an available DSM from the study area is used, which is already filled with popular
This contribution has been peer-reviewed. The double-blind peer-review was conducted on the basis of the full paper. doi:10.5194/isprsannals-III-1-55-2016
58
ISPRS Annals of the Photogrammetry, Remote Sensing and Spatial Information Sciences, Volume III-1, 2016 XXIII ISPRS Congress, 12–19 July 2016, Prague, Czech Republic
(a)
(b)
(c)
(d) (e) (f) Figure 7. The three study area; (a, d) WV2 PAN from Istanbul and the voids in DSM, (b, e) WV2 PAN from Munich and the voids in DSM, (c, f) IKONOS PAN from Munich and the voids in DSM
(a) (b) (c) Figure 8. Results, filled DSMs; (a) Istanbul, WV2, (b) Munich, WV2, Munich, (c) IKONOS. filling methods. For Istanbul dataset we compared the result with an available DSM that is filled by interpolation. In Figure 9 the qualitative inspection of the results for Istanbul data can be seen. As one of the most intuitive ways for comparison, Figure 9 illustrates a profile driven from the filled DSMs and reference DSMs. It can be seen that in the filled DSM, the edges and borders of buildings are sharper than that of the given DSM. Additionally in Figure 10 one can see the artefacts caused due to the smoothing in the interpolated voids near the buildings.
Besides, in some cases one can clearly see the advantage of using spectral information. As shown in Figure 11 filling without considering spectral data, leads to missing some parts of objects which can cause failure in future processing using the DSM. Since the LiDAR DEM is generated from last pulse data, it doesn’t contain vegetation. Therefore to statistically evaluate the filled DSM, an NDVI mask from the multispectral image is generated and vegetation is removed from the DSM. In addition, the target elements through the proposed algorithm are only voids and no-data regions in DSM. So the other parts of
This contribution has been peer-reviewed. The double-blind peer-review was conducted on the basis of the full paper. doi:10.5194/isprsannals-III-1-55-2016
59
ISPRS Annals of the Photogrammetry, Remote Sensing and Spatial Information Sciences, Volume III-1, 2016 XXIII ISPRS Congress, 12–19 July 2016, Prague, Czech Republic
data are not supposed to be manipulated and don’t need to be minimum, maximum and mean errors for voids are computed.
(3) where
n = number of no-data cells (total size of voids) Zi = height in filled DSM Zr= height in reference DSM
Additionally we used another estimator proposed in (Höhle et al, 2009) called Normalised Median Absolute Deviation (NMAD) which is proposed in order to remove the effect of remaining outliers and non-normality of the error distribution in DSMs derived by digital photogrammetry or laser scanning. It is computed by the Equation (4): NMAD = 1.4826 . median (| Δzj - mΔz |)
(4)
where:
Δzj = individual errors, j = 1 , …, n mΔz = median of errors
Table 1 lists the results of evaluation for a scene from Munich in both IKONOS and WV2 dataset. The statistics show the efficiency of our method compared to the more expensive method of using four-view imagery to generate a filled DSM. However as our methodology is still based on satellite images, the RMSE didn’t improve significantly. RMSE
Min
Max
Mean
(m)
(m)
(m)
(m)
(m)
DSMg
3.50 3.31
0.0 0.0
32.47 35.53
1.03 1.05
1.00 0.98
DSMnew
6.85
0.0
32.68
5.88
4.62
DSMg
8.25
0.0
33.58
7.14
5.08
Test Data WV2 IKONOS
DSMnew
NMAD
Table 1: Statistical evaluation for Munich study area in WV2 and IKONOS dataset. The filled DSM and the given DSM are compared to the LiDAR DEM as reference dataset.
red: our result blue: DSMref
(a) (b) (c) Figure 9. The visual comparison of the two profiles (c) derived from our result (a) with the given DSM (b).
(a) (b) Figure 10. The visual comparison of our results- left in (a), (b) - with the given DSM- right in (a), (b) - for two different parts of Istanbul data
(a) (b) (c) (d) Figure 11. A building in the image (a), in the unfilled DSM (b), in the result DSM (c), in the given DSM, comparison between (c) and (d) shows the effect of using spectral information to fill the voids
This contribution has been peer-reviewed. The double-blind peer-review was conducted on the basis of the full paper. doi:10.5194/isprsannals-III-1-55-2016
60
ISPRS Annals of the Photogrammetry, Remote Sensing and Spatial Information Sciences, Volume III-1, 2016 XXIII ISPRS Congress, 12–19 July 2016, Prague, Czech Republic
4. CONCLUSION In this paper an algorithm for filling voids in DSM derived from stereo satellite images has been developed. Despite the other common methods for void filling we didn’t use any auxiliary DSM. Instead we used only one of the stereo images from which the unfilled DSM is derived. The contribution is to use spectral information extracted from the multispectral image as a constraint in filling procedure. The results are satisfactory and indicate the efficiency of the proposed method to preserve the accuracy of generated DSM. The results show that the proposed algorithm is able to generate sharper edges of building in comparison to the available reference DSMs that are filled with common previous methods. Moreover, using spectral constraint for filling holes in the elevation model can recover the missing parts of objects through the former matching process. This can particularly be of high advantage through the further process of 3D change detection which is the main target of the authors. The proposed method in this paper is tested on areas from two cities without skyscrapers. For more complex urban scenes more tests should be done. The quality of the results is affected by the quality of the segmentation phase. Therefore currently more research is being done by the authors to improve the segmentation results for VHR satellite images.
ACKNOWLEDGEMENTS The authors would like to thank Lukas Metzlaff for his kind help and support. REFERENCES
Höhle, J., Höhle, M., 2009. Accuracy assessment of Digital elevation models by means of robust statistical methods. ISPRS Journal of Photogrammetry and Remote Sensing, Vol. 64, pp. 398–406 Kuuskivi, T., J. Lock, X. Li, S. Dowding, B. Mercer, 2005. Void Fill of SRTM Elevation Data: Performance Evaluations, Geospatial Goes Global: From Your Neighborhood to the Whole Planet, ASPRS 2005 Annual Conference, Baltimore, MD, USA. Krauß, T., d’Angelo, P., 2011. Morphological Filling of Digital Elevation Models. International Archives of the Photogrammetry, Remote Sensing and Spatial Information Sciences, Volume XXXVIII-4/W19, ISPRS Hannover Workshop. Luedeling, E., Siebert, S., Buerkert, A., 2007. Filling the voids in the SRTM elevation model - A TIN-based delta surface approach. ISPRS Journal of Photogrammetry and Remote Sensing, 62, pp 283-294. Ling, F., Zhang, Q. W., Wang, C., 2007. Filling voids of SRTM with Landsat sensor imagery in rugged terrain. International Journal of Remote Sensing, 28, pp. 465-471. Reuter, H. I., Nelson, A., Jarvis, A., 2007. An evaluation of void‐filling interpolation methods for SRTM data. International Journal of Geographical Information Science, 21, pp. 9831008. Yue, T., Chen, C., Li, B., 2012. A high-accuracy method for filling voids and its verification. International Journal of Remote Sensing, 33, pp. 2815-2830. Schindler, K., Papasaika-Hanusch, H., Schütz, S., Baltsavias, E., 2011. Improving Wide-Area Dems through Data Fusion – Chances and Limits. In: Proceeding 53rd Photogrammetric Week Stuttgart, Germany , pp. 159-170.
Cai, X., Chen, X., Li, H., Tian, L., Wu, Z, 2005. A Simple Method to Improve the SRTM DEM based on Landsat ETM+ Image, Proceeding of SPIE Vol. 6043, 60430H. d’Angelo, P., Reinartz, P., 2012. DSM Based Orientation of Large Stereo Satellite Image Blocks. In: International Archives of the Photogrammetry, Remote Sensing and Spatial Information Sciences, XXII ISPRS Congress, Melbourne, Australia, Volume XXXIX-B1, pp.209-214. d’Angelo, P., Lehner, M., Krauss, T., 2008. Towards Automated DEM Generation from High Resolution Stereo Satellite Images. In: Proc. ISPRS Congress., Beijing, China, 2008, vol. 37, Part B4, pp. 1137–1342. Delaney, M., Kuuskivi, T., Xiaopeng L., 2005. Evaluation of Different Solutions To Fill Voids In SRTM Elevation Datasets. PECORA 16 “Global Priorities in Land Remote Sensing”, Sioux Falls, South Dakota. Dowding, S., Kuuskivi, T., Xiaopeng L., 2004. Void Fill of SRTM Elevation Data - Principles, Processes and Performance. ASPRS Images to Decision: Remote Sensing Foundation for GIS Applications, Kansas City, Missouri. Grohman, G., Kroenung, G., Strebeck, J., 2006. Filling SRTM Voids: The Delta Surface Fill Method. Photogrammetric Engineering Remote Sensing, 72, pp. 213-216. Hirschmueller, H., 2008. Stereo Processing by Semi-Global Matching and Mutual Information. IEEE Transactions on Pattern Analysis and Machine Intelligence, Vol. 30, pp 328341. Hogan, J., Smith, W., 2010. Refinement of digital elevation models from shadowing cues. In: Proceedings of the IEEE Computer Society Conference on Computer Vision and Pattern Recognition, pp. 1181-1188.
This contribution has been peer-reviewed. The double-blind peer-review was conducted on the basis of the full paper. doi:10.5194/isprsannals-III-1-55-2016
61