universal background model (UBM) by adapting the UBM components with maximum a posteriori (MAP) adaptation using each speaker's personal training data ...
A NEW SEGMENTATION ALGORITHM COMBINED WITH TRANSIENT FRAMES POWER FOR TEXT INDEPENDENT SPEAKER VERIFICATION R. Saeidi(1), H. R. Sadegh Mohammadi(2), R. D. Rodman(3), T. Kinnunen(4) (1) Research Center for Intelligent Signal Processing, Shariati Ave., Tehran, I. R. Iran (2) Iranian Research Institute for Electrical Engineering, Narmak, Tehran, I. R. Iran (3) Department of Computer Science, North Carolina State University Raleigh, NC 27606, USA (4) Institute for Infocomm Research, Singapore ABSTRACT In this paper we propose a new segmentation algorithm called Delta MFCC based Speech Segmentation (DMFCCSS), with application to speaker recognition systems. We show that DMFCC-SS can separate the regions of speech that result from similar likelihood scores using models such as a Gaussian Mixture Model (GMM), and can therefore be used to identify the regions of speech between two transitional states in a speech signal. By combining this segmentation algorithm with the discriminative power of transient frames in speaker recognition, we can investigate the tradeoff in speed-up rates that result from DMFCC-SS, with speaker verification equal error rates that result from representatives of each segment. We use a Universal Background Model – Gaussian Mixture Model (UBMGMM) as a baseline system. The proposed speed-up algorithm, working in the pre-processing stage, performs well while having no computational load compared to the main GMM system. Experimental results show the superior performance of this pre-processing method in comparison with other algorithms working in the pre-processing stage of a UBM-GMM system. Index Terms— Speaker recognition, speech segmentation, transient frames, UBM-GMM, speed-up. 1. INTRODUCTION A commonly used baseline system in speaker recognition is based on Mel-frequency cepstral coefficients (MFCC) in a Gaussian mixture model (GMM) framework [1]. Such a system is used to measure the effectiveness of novel features in modeling approaches. A popular method for speaker verification is to model the speakers with the Gaussian mixture model (GMM) based on the maximumlikelihood (ML) criterion, which has been shown to outperform several other existing techniques. In the state-ofthe-art GMM based speaker recognition system, speakerdependent GMMs are derived from a speaker-independent universal background model (UBM) by adapting the UBM components with maximum a posteriori (MAP) adaptation
using each speaker’s personal training data [2]. This method includes a natural hierarchy between the UBM and the personal speaker models; for each UBM Gaussian component, there is a corresponding adapted component in the speaker’s personal GMM. In the verification phase, each test vector is scored against all UBM Gaussian components, and a small number (typically 5) of the best scoring components in the corresponding speaker-dependent GMMs are noted. This procedure effectively reduces the amount of needed density computations. We use this verification system with no pre-processing as our baseline system for comparison with the pre-processing algorithm proposed in this paper. Chan et al. have categorized a four layer scheme for fast GMM computations [3]. These are frame-layer, GMMlayer, Gaussian-layer and component-layer algorithms in their categorization. We wish to take the frame-layer algorithms of this categorization as a reference point. The idea of a speed-up GMM-UBM based system with preprocessing comes mainly from the experiments that McLaughlin et al. [4] performed using three decimation techniques, namely: Fixed Rate decimation, Variable Frame Rate (VFR) decimation and Adaptive Rate decimation. They conclude that fixed and adaptive rate decimation work better than VFR decimation and state that: "this is due to the difficulty in defining an intelligent vector selector requiring a good distance measure and threshold." They also state: "intelligent vector selection like VFR may have potential for improved performance with frame reduction over simple fixed decimation." They reach EER degradation of less than 1% absolute with a decimation factor of 10. Louradour et al. [5], [6] examine the efficiency of the segmentation algorithm proposed by Obrecht [7] in a speaker verification task. They use one of the four procedures called Kullback divergence. All four procedures require statistical speech-based models that must be trained and evaluated during the automatic speech segmentation phase. They use the segmentation algorithm in [5] in which a weight is allocated to each frame as a function of its segment position, after which a weighted mean of the likelihood ratios is computed. Their experiments show that the frames nearer to the segment boundaries – the transient
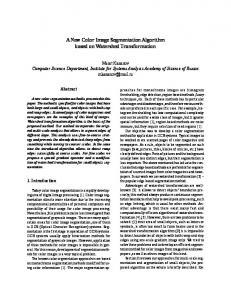
Segment 1 Segment 2
…
0.4 0.2 0 -0.2
Middle
-0.4 -0.6 0.2
0.4
0.6
0.8
1
1.2
1.4
Fig. 1. Segmentation algorithm performance in a typical speech signal with a threshold value of 1.
ones – are more speaker relevant than the middle frames of long segments, which correspond to the steady state parts of the phones. They state that: "Such a result confirms that the derivatives of the cepstral coefficients may be more informative than the cepstral coefficients themselves." By using Kullback divergence segmentation, Louradour et al. [6] examine four fast scoring systems that retain just the first frame, the last frame, the closest frame to the middle, and a randomly chosen frame, all of which are extracted from among the segments marked as speech. Their experiments show that the two systems that use only the first and last frames as representative of each segment outperform the others. By combining these two systems, they build a third system that computes a score from all transient frames located close to segment boundaries. They show that scoring that depends only on transient frames leads roughly to the same performance as taking every frame into account. Moreover, by using transient frames, they achieve results three times faster than baseline with minor degradation. Additionally, they show in another experiment that adding middle-frame scores does not improve performance. Recently, Kinnunen et al. [8], as part of their work, compare four pre-quantization, frame-layer algorithms, namely, Averaging, Decimation, Random sub-sampling, and Clustering based. He showed that the clustering based algorithm outperformed the others. Drawing on these methodologies, we propose a segmentation algorithm based on Delta MFCC coefficients that is simpler and less complex than those in [6]. To show the effectiveness of our algorithm we use two systems. One exploits the closest frame to the middle of a segment, and the other exploits the first and last frames of a segment. We then compare the performance of these systems with Fixed rate decimation, Variable Frame Rate decimation and clustering based quantization. The remainder of the paper is organized as follows. In Section 2 the proposed segmentation algorithm is described in detail. In Section 3 the computer simulation and experimental results are presented. Finally, Section 4 concludes the paper. 2. SEGMENTATION AND SEGMENT REPRESENTATION The proposed segmentation algorithm, termed deltaMFCC based speech segmentation (DMFCC-SS), uses the norm of the delta-MFCC vector to detect spectral changes.
First + Last
Fig. 2: Representative selection for each segment
Within steady regions – phonetic targets – the spectrum changes little from frame to frame, giving delta vectors small in magnitude. On the other hand, during transient regions, the spectrum changes rapidly, giving high values for the norm of the delta vector. The algorithm is as follows: 1. Compute MFCC vectors for test utterance. 2. Use a biGaussian algorithm with the 0th MFCC as its input for computing flags of silence vectors. 3. Denoting the delta-MFCC vector of the frame t by ∆x(t)=(∆x1(t),…,∆xd(t)), where d is the number of ∆MFCCs, the 1-norm scaled by dimensionality is given as follows: qt =
1 1 d (t ) ∆x ( t ) = ∑ j =1| ∆x j | 1 d d
(1)
Scaling by 1/D is due to normalization because we have a threshold later. This encourages us to use a scalar value for measuring total variations and we do this by averaging delta MFCC coefficients by absolute value. 4. The values (1) are cumulated over consecutive frames as S(t)=∑(q1,q2,…,qt). A segment boundary is marked whenever the accumulated value exceeds a preset threshold Θ,,and the t vectors are grouped as a segment. S(t) is then set to 0 and summing resumes with the vector immediately following the last vector of the previous segment. This action repeats until a vector flagged previously as silence is reached. At this point summation ceases and a segment is formed even if the summation doesn’t reach the threshold value. Further silence vectors are bypassed and summation resumes with the first nonsilent vector, which initiates a new segment. This procedure is repeated until the entire test utterance is segmented. 5. Representative subsegments (either first and last, or middle) are selected for each segment. To illustrate how the segmentation algorithm works in a speech signal domain, we plot segmentation boundaries for a typical speech signal in Fig. 1 along with the representative selections in Fig. 2. The higher the threshold, the fewer the segments, resulting in a lower data rate for the test segment. On the other hand, by decreasing the threshold, we represent the original data better, but with the cost of an increased data rate. 3. PERFORMANCE ASSESSMENT EXPERIMENTS To evaluate the performance of the proposed method
Performance Evaluation - Fixed Rate Decimation 18
Performance Evaluation - VFR
EER min DCF*100 Decimation EER (baseline sys.) min DCF*100 (baseline sys.)
16
30
EER min DCF*100 Decimation EER (baseline sys.) min DCF*100 (baseline sys.)
25
14
12
20
10 15
8
6
10
4 5
2
0
0
3
5
7
9
11 Decimation by N
13
15
17
19
50
100
150
200
250
Threshold
Fig. 3. Fixed Rate decimation results.
Fig. 4. Variable Frame Rate decimation results.
several experiments were performed and the results compared with competitive schemes. This section explains different aspect of these trials.
work. We use frames of 23 milliseconds length with 50% overlap between consecutive frames. Twelve dimensional MFCC vectors plus 12 ∆MFCC vectors are used as feature vectors after discarding the 0th MFCC. Owing to the inherent normalization found within the DMFCC-SS algorithm, the thresholds for the algorithm were varied from 0.1 to 5.0 in steps of 0.2. Performance was evaluated for both first and last frame representation as well as for middle frame representation. However for fixed rate decimation only the first frame of a segment was selected as representative and we examined orders 2 through 20. For variable frame rate (VFR) decimation standardized Euclidean distance was chosen as a distance metric, using the inverse of each coordinate in the sum of squares weighted by the sample variance of that coordinate. Thresholds for VFR varied from 10 to 250 in steps of 10. For the clustering cases we used orders of 1, 2, 4, 8, 16, 32, 64 and 128 for K-means clustering as a type of Linde-BuzoGray (LBG) algorithm.
3. PERFORMANCE ASSESSMENT EXPERIMENTS To evaluate the performance of the proposed method several experiments were performed and the results compared with competitive schemes. This section explains different aspect of these trials. 3.1 Speech Database Our speech test bed is a database of conversational speech in Farsi, recorded from different television channels using a Winfast® TV card installed on a PC. Recordings were taken when the speakers talked in noise-free studios without crosstalk or any musical background. The speech signals were recorded using PCM sampled at 11025 Hz, with 16 bit quantization on a single channel. We used 7400 seconds of speech from 130 male speakers for the UBM training, with each UBM speaker model derived from 13 to 70 seconds of speech. We also recorded about three to four minutes of speech from each of a set of 110 other male speakers who would be the target speakers for testing. From these recordings, 30 seconds of speech were used for the actual speaker models, with the remaining speech used for the testing phase. We used 80 of these speakers in our experiments. All speakers have one session of speech recording. 3.2 Experimental Setup Once we had trained both the GMM-UBM and speaker models, we conducted 50534 verification trials, broken down into 4594 target trials and 45940 trials for impostors. As noted, the training segments were based on 30 seconds of speech; the testing segments were compiled in segments of three second duration, with no overlap of training and testing segments. The ratios between target and impostor trials in all evaluations are 1:10. We used NIST guidelines [9] in our evaluations. No score normalization schemes such as Z-norm, T-norm or H-norm [2] or channel normalization schemes like CMS or RASTA filtering were applied in our
3.3 Evaluation measure The evaluation of the speaker verification system is based on detection error tradeoff (DET) curves, which show the tradeoff between false alarm (FA) and false rejection (FR) errors. We also used the detection cost function (DCF) defined in [9]: DCF = C miss E miss Ptarget + C fa E fa (1 − Ptarget )
(2)
where Ptarget is the a priori probability of target tests with Ptarget = 0.01 and the specific cost factors C miss = 10 and C fa = 1 . 3.4 Experimental Results Our evaluation of the results is presented in terms of Equal Error Rates (EER), minimization of the Decision Cost Function (min DCF), and the speed-up factor. These are compared with the baseline system in which all frames are scored. (See Figs. 3-7). The results show that EER rates and min DCF generally exceed baseline for all best-case decimation algorithms, but are slightly below baseline for the best-cases of our DMFCC-SS algorithm. With MID representative, and
Performance Evaluation - DMFCC-SS applied with FSTLST representative
Performance Evaluation - clustering based 25
159
79.5
39.8
8
EER
20
7
min DCF*100 Decimation EER (baseline sys.)
EER min DCF*100 Decimation EER (baseline sys.) min DCF*100 (baseline sys.)
6
min DCF*100 (baseline sys.) 15
5 10
4
3
5
2 0
1
2
4
8 16 Number of clusters
32
64
128
1
Fig. 5. clustering based decimation results.
0
0.9
1.9
2.9
3.9
4.9
Threshold Performance Evaluation - DMFCC-SS applied with MID representative 16
14
Fig. 7. DMFCC-SS with first and last representative results.
EER min DCF*100 Decimation EER (baseline sys.) min DCF*100 (baseline sys.)
Table 1. Performance comparison of different decimation methods
12
10
Fixed rate decimation VFR decimation Clustering based DMFCC-SS with MID DMFCC-SS with FSTLST
8
6
4
2
0
0.9
1.9
2.9
3.9
Speed-up 5.90 5.91 4.97 5.92 5.93
EER 4.79 5.03 4.92 4.31 4.39
Min DCF 0.0452 0.0492 0.0478 0.0419 0.0422
4.9
Threshold
Fig. 6. DMFCC-SS with middle representative results.
threshold=0.5, we achieved a minimum EER=3.81 and min DCF=0.03739, and both of them were below the baseline system rate. In the case of FSTLST representative, and threshold=1.7, we reach a minimum EER=3.88 and min DCF=0.03736. We have a speed-up factor of 3.2 and 4.2 for systems used MID and LSTFST representatives for the mentioned threshold without performance loss. Moreover, even with the additional speed up we actually observe improved performance. Our experiments confirm the observation in Louradour et al. [6] that the discriminative power of transient frames exceeds that of middle or randomly selected frames. Our results, however, show improvement over theirs in two respects. First, we achieve better scores than baseline systems. This implies that our proposed segmentation algorithm is an effective one for speaker recognition perhaps for speaker identification as well as speaker verification/authentication - and the effectiveness of the algorithm may have ramifications for speech recognition as well. Secondly, the behavior of the MID representative system is an improvement over the randomly selected frame system in that it works better than the baseline system for several threshold values. Finally, if we compare all algorithms for typical speedup rates a little less than 6 we get the results shown in Table 1, which show that both DMFCC-SS systems, MID and FSTLST, outperform their competitors at these speedup rates. 4. CONCLUSIONS In this paper a novel speech segmentation algorithm for speaker recognition is proposed and a comparison of the performance of this segmentation algorithm as a decimation tool with other decimation algorithms is made. By using this
algorithm and exploiting the superior discriminative power of transient frames, we can reach a speed-up factor of 4.2 without any loss in performance. Therefore, not all frames seem to be relevant for speaker discrimination, and in fact some of them can have a negative effect.
5. REFERENCES [1] D. A. Reynolds and R. C. Rose, “Robust text-independent speaker identification using Gaussian mixture speaker models,” IEEE Trans. on Speech Audio Processing, vol. 3, no. 1, pp. 72-83, Jan. 1995. [2] D. A. Reynolds, T. F. Quatieri and R B. Dunn, “Speaker verification using adapted Gaussian mixture models,” Digital Signal Processing, vol. 10, no. 1-3, pp. 19-41, Jan. 2000. [3] A. Chan, R. Mosur, A. Rudnicky and J. Sherwani, “Four-layer categorization scheme of fast GMM computation techniques in large vocabulary continuous speech recognition systems,” in Proc. INTERSPEECH‘04, pp. 689-692, 2004. [4] J. McLaughlin, D. A. Reynolds and T. Gleason, “A study of computation speed-ups of the GMM-UBM speaker recognition system,” in Proc. Eurospeech’99, pp. 1215-1218, 1999. [5] J. Louradour, R. André-Obrecht, and K. Daoudi, “Segmentation and relevance measure for speaker verification,” in Proc .ICSLP’04, pp. 1401-1404, Jeju Island, Korea, Oct. 2004. [6] J. Louradour, K. Daoudi and R. André-Obrecht, “Discriminative power of transient frames in speaker recognition,” in Proc. ICASSP’05, vol. 1, pp. 613-616, Philadelphia, US, 2005. [7] R. Andre-Obrecht, “A new statistical approach for the automatic segmentation of continuous speech signals,” IEEE Trans. Speech and Audio Proc., vol. 36, no. 1, pp. 29-40, Jan. 1988. [8] T. Kinnunen, E. Karpov, and P. Fränti, “Real-time speaker identification and verification,” IEEE Transactions on Audio, Speech and Language Processing, vol. 14. no. 1, pp. 277-288, Jan. 2006. [9] The 2000 NIST Speaker Recognition Evaluation, http://www.nist.gov/speech/tests/spk/2000/index.htm