th
The 14 World Conference on Earthquake Engineering October 12-17, 2008, Beijing, China
A NONLINEAR DYNAMIC SOIL FOUNDATION INTERACTION MODEL USING FIBER ELEMENT METHOD AND ITS APPLICATION TO NONLINEAR EARTHQUAKE RESPONSE ANALYSIS OF CABLE STAYED BRIDGE 1
2
2
2
T. Harada , T. Nonaka , H. Wang , K. Magoshi , and M. Iwamura
2
1
Professor, Dept. of Civil and Environmental Engineering, University of Miyazaki, Miyazaki, JAPAN Email:
[email protected] 2 President and Research Engineers, Earthquake Engineering Research Center Inc., University of Miyazaki, Miyazaki, JAPAN Email:
[email protected],
[email protected] ABSTRACT : This paper presents a multi-Winkler model for nonlinear dynamic response of foundations and its application to a nonlinear earthquake response analysis of cable-stayed bridge using the fiber element method. The nonlinear soil reactions to foundation motions are modeled by using the springs per unit area of interface between soil and foundation with 3 components corresponding to normal traction and two shear tractions on soil-foundation interface. The normal spring is modeled by a bilinear curve with no rigidity of tension and compressive capacity, for its skeleton, and a crack model, for its hysteresis loop. For the skeletons of the two shear springs, the bilinear curves with shear capacity following the Mohr-Coulomb yield criterion are used. By the Mohr-Coulomb yield criterion, the shear capacity is proportional to the normal traction and then the shapes of hysteresis loops of the two shear springs are automatically determined from the hysteresis loop of the normal traction. The resultant soil reacting forces and moments to the foundation motions are efficiently calculated by employing the fiber element method. Comparisons with the experimental hysteresis loops of rigid foundation demonstrate the potential capability of the proposed model. And also, an example of nonlinear earthquake response analysis of cable stayed bridge supported by the two caisson foundations is presented to demonstrate an applicability of the proposed model to a seismic analysis of entire system of substructure and superstructure. KEYWORDS:
multi-Winkler model, dynamic soil foundation interaction, fiber element method, nonlinear seismic response of bridge, earthquake nonlinear soil foundation interaction.
1. INTRODUCTION According to the currently accepted and widely used seismic design concept, for the high level of seismic design loadings such as near fault ground motions, that the substantial plastic deformation is allowed in the superstructures beyond the elastic limit of the structural elements, but the significant plastic deformations should not be taken place in the substructures below the ground surface, we very often use analytical models based on the assumption of the linear or at most equivalent linear soil behaviors and perfectly bonded contact between soil and foundation for the substructures, but of the nonlinear geometrical and material behaviors of the structural elements for the superstructures, in examining the response behaviors of the entire soil foundation structure systems subjected to strong earthquake ground motions. It is, therefore, important to know what happens when the linear soil foundation models become the nonlinear soil foundation models. The following two main approaches to the nonlinear soil foundation models may be available, each with advantages and disadvantages (Harada et al., 2007). (1st) Complete analyses of soil foundation system, using the nonlinear finite element method (Nonlinear FEM). Such approaches are rigorous and may provide realistic model of nonlinear soil foundation behaviors if they (Nonlinear FEM) use the realistic constitutive model of soil, but can be computationally extremely time-consuming. In addition, the disadvantage exists that such complete nonlinear FEM models are difficult to couple to the nonlinear structural analyses of superstructures, so that the analyses of substructures and superstructures are in practice treated separately. Such separate analyses
th
The 14 World Conference on Earthquake Engineering October 12-17, 2008, Beijing, China
are inadequate for the case where the dynamic interaction between substructure and superstructure is dominant. (2nd) Force resultant models or Concentrated nonlinear spring models (referred as the macro models) for which the nonlinear behaviors of soil and foundation are modeled in terms of the resultant forces on the foundation and the corresponding displacements. With careful examination of the force resultant models on the basis of experimental results and numerical experiments such as the cyclic pushover tests, such models may give an appropriate model of nonlinear soil foundation behaviors and can be easily incorporated in the nonlinear structural analyses of superstructures with less computational effort. Even in these models, however, they are still inappropriate in their use for the case where the dynamic interaction between substructure and superstructure is significant, because the force resultant models are determined beforehand by assuming the main vibration mode of the entire system of substructure and superstructure. It is clear that the common weakness in the currently prevailing two approaches described above is the applicability to the problem where the dynamic interactions between substructure and superstructure are dominant. In this paper, therefore, we propose an alternative model (referred as the micro models against the force resultant models (2nd )) overcoming the above common weakness of the (1st ) and (2nd ) models. The level of details of the proposed model is intermediate between the (1st ) and (2nd ) models. The proposed model is less computationally time consuming than the (1st ) model but needs more computational time than the (2nd ) model . 2. MODEL DESCRIPTION The model in this paper is based on a multi-Winkler model of subgrade reactions represented in terms of the normal and two shear tractions at points on the foundation rather than the total resultant forces. It is noted that the nonlinear resultant forces and moments on the foundation are not directly modeled but can be obtained as a result of the integration of the nonlinear tractions, generated by the movements of foundation, over the foundation area. τ
σn b
τ0
tension up
a
u v0
comp.
caisson
kn
= qu (a)
σp
= eqn. 2.3 (b)
Figure 1 Normal traction model
caisson
v0
v
ks
τ0
Figure 2 Shear traction model
2.1. Model of Normal and Shear Tractions on Foundation Figure 1 shows schematically the nonlinear relation between the normal traction σn (negative in compression) and the normal directional displacement u at any point on a foundation. The surrounding soil is modeled in this paper by a tensionless soil with normal coefficient of subgrade reaction kn and capacity of compression σp . In this model the normal traction is zero for u positive, representing the bonding between soil and foundation surface is broken (gap appears) due to tensionless soil. For a model of the hysteresis loop of σn - u relation, the concrete crack model (Tanabe, 2004) is adopted where the contact would not be reestablished until the displacement when σn was zero in the last cycle. Figure 2 shows the nonlinear relation between the shear traction τ and the corresponding shear directional displacement v at any point on a foundation surrounded by a soil with shear coefficient of subgrade reaction ks and capacity of shear traction τ 0 . On any point of foundation surface shear tractions have two components. These two shear components are assumed to be equal in this model, and hence the prescribed fundamental key soil elements are only the nonlinear relations of σn - u and
th
The 14 World Conference on Earthquake Engineering October 12-17, 2008, Beijing, China
τ - v schematically shown in Figures 1 and 2. The skeleton curves of σn - u and τ - v in Figures 1and 2 are expressed by Eqn. 2.1. ⎧ ⎪ 0 ⎪ ⎪ ⎪ σn = ⎪⎨kn u ⎪⎪ ⎪ σ ⎪ ⎪ ⎩ p
0 u
⎧ | v |< v 0 ⎪ ks v τs = ⎪ ⎨ ⎪⎪sgn(v )τ 0 | v |≥ v 0 ⎪ ⎩
(2.1)
It is noted in the proposed model that the capacity of shear traction τ 0 is assumed to be a linear function of the normal traction σn by employing the Mohr-Coulomb yield criterion such as,
τ 0 = c + σn tan φ
(2.2)
where c and φ are respectively the cohesion coefficient and the frictional angle between soil and foundation surface. By making use of the Mohr-Coulomb yield criterion, the hysteresis loop of τ - v relation is determined automatically from the hysteresis loop of σn - u relation and Eqn. 2.2. Other parameters of this model to specify the relations of σn - u and τ - v given by Eqn. 2.1 or shown schematically in Figures 1 and 2 are indicated below. For foundation base, σp = qu where qu stands for the ultimate bearing capacity (Japan Road Association,2002), and for foundation side wall, by using the Rankine’s passive lateral soil resistance,
⎛ φ⎞ (2.3) k p = tan2 ⎜⎜45D + ⎟⎟⎟ ⎝ 2⎠ where σ0 is the soil weight per unit area at depth z from the ground surface. Concerning the coefficients of the subgrade reactions kn and ks for foundation base and side wall, the coefficients adopted in the regulation of σp = σ0k p + 2c k p ,
seismic design of road bridge in Japan (Japan Road Association, 2002) have been used in this paper. Caisson
Three Component Soil Springs
Free Field
(a) 3D Views
Caisson
(b) Plan Views
Free Field
Free Field
Caisson
Free Field
Input Earthquake Motion (c) Side Views
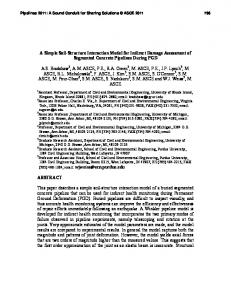
Figure 3 Multi-Winkler model of three dimensional soil foundation system 2.2. Numerical Integration of Multi-Winkler Model by Making Use of Fiber Element Method Figure 3 schematically shows the multi-Winkler model where the nonlinear normal and shear traction models (referred as nonlinear soil springs with three components) in the previous section are discretely distributed on the contact surface between the foundation and surrounding soil (Figure 3(a)). In the case of earthquake excitations, the free field ground displacements at any points of the distributed soil springs are subjected to the support points of the soil springs as shown schematically in Figure 3 (b) and (c). In this multi-Winkler model, the normal and shear tractions at any point of the distributed nonlinear springs can be determined against the relative displacements occurred at any point of the distributed nonlinear springs, and then by integrating these
th
The 14 World Conference on Earthquake Engineering October 12-17, 2008, Beijing, China
normal and shear tractions at any point, the resultant forces and moments acting on the foundation from the surrounding soils can be obtained. The proposed model in this paper uses the fiber element method (Nonaka et al., 2001) to integrate numerically and efficiently the nonlinear normal and shear tractions by regarding the nonlinear soil springs as the fiber elements. Since the fiber element method has been primarily developed for the nonlinear dynamic structural response analysis taken into account for the geometric and material nonlinearities of the structural elements, the proposed multi-Winkler model in conjunction with the fiber element method is quite easy to couple to a nonlinear dynamic response analysis of superstructures, so that the nonlinear dynamic response analyses of entire system of substructures and superstructures can be done. Therefore, the proposed model makes it possible to analyze the nonlinear seismic response of entire system of substructure and superstructure in computationally less effort. 3.QUALITATIVE COMPARISON BETWEEN EXPERIMENTAL AND CALCULATED HYSTERESIS LOOPS OF MOMENT ROTATIONAL ANGLE FOR FALLOW FOUNDATION To demonstrate the potential capability of the proposed multi-Winkler model for representing various complex hysteresis loops of the resultant force and the foundation displacement, the qualitative comparisons are shown here between the experimental and calculated hysteresis loops of M − θ (moment-rocking angle) of shallow foundation. Figure 4 shows a strip rigid foundation supported by the multi-Winkler model with 19 discrete points used in this numerical experiment. A constant vertical load corresponding to the weight of foundation is applied and then the cyclic moment is exerted on a center of the foundation. In this numerical example, three particular cases of the bearing capacity of soil are examined in order to show how the resultant M − θ (moment-rocking angle) of the foundation is affected by the bearing capacity of soil beneath the foundation. Table 1 indicates three cases of bearing capacity used in this numerical example. In this example, the coefficients of subgrade soil reactions kn = KV (for vertical direction) and ks = K SB (for shear direction) of foundation base are assumed to be constant for each case, but only the ultimate bearing capacity of soil σp = qu is different in each case. The cases (1) and (3) are two extremes: (1) of a very hard soil where the maximum compressive soil traction is remaining within the bearing capacity of soil, so that only the foundation uplift from the supporting soil occurs, (3) of such a very soft soil that the compressive soil traction is largely exceeding in the bearing capacity of soil. Case (2) is an intermediate or medium soil. In this numerical example, the second slope of the skeleton of the nonlinear relation between the normal traction σn and the normal directional displacement u is assumed to be 10% of the first slope kn = KV . Foundation model L=10m
B=2m
H=1m
Multi-Winkler Springs
Figure 4 A strip rigid foundation model supported on multi-Winkler model used in numerical example Table 1
Bearing capacities and coefficients of subgrade reactions for the 3 cases of numerical example 解析ケース Case Case1 Case2 Case3
qu
KV 2
(kN/m ) 714.8 448.4 298.9
KSB 3
(kN/m ) (kN/m3) 79060.7 47444.3 79060.7 47444.3 79060.7 47444.3
th
15000
100 0
10000
-100
5000
-200
M(kN)
Nomal Stress σ(kN/m 2 )
The 14 World Conference on Earthquake Engineering October 12-17, 2008, Beijing, China
-300 -400
-600
-10000
-700 -800 -0.10
0
-5000
-500
Case1 -0.05
0.00
0.05
0.10
-15000 -0.03
Case1 -0.02
-0.01
0.02
0.03
15000
100 0
10000
-100 -200
M(kN)
Nomal Stress σ(kN/m 2 )
0.01
θ(rad)
Displacement(m)
-300 -400
5000 0
-5000
-500 -600
-10000
-700 -800 -0.10
Case2 -0.05
0.00
0.05
0.10
-15000 -0.03
Case2 -0.02
-0.01
0.00
0.01
0.02
0.03
θ(rad)
Displacement(m) 15000
100 0
10000
-100 -200
M(kN)
Nomal Stress σ(kN/m 2 )
0.00
-300 -400
0
-5000
-500 -600
-10000
-700 -800 -0.10
5000
Case3 -0.05
0.00
0.05
Displacement(m)
0.10
-15000 -0.03
Case3 -0.02
-0.01
0.00
0.01
0.02
0.03
θ(rad)
Figure 5 Calculated M − θ curves (right-hand) and normal traction curves (left-hand) at edge of foundation
Figure 6 Experimental M − θ curves (right-hand) and their schematic sketch of the state of soil foundation (left-hand)
Figure 5 shows the hysteresis loops (right-hand in Figure 5) of the resultant M − θ (moment-rocking angle) of the foundation and the hysteresis loops (left-hand in Figure 5) of the normal traction of soil σn − u at the edge of foundation, which are calculated by the multi-Winkler model in conjunction with the fiber element method. From the upper figures in Figure 5 which show the calculated M − θ and σn − u for the case (1) of a very hard soil, the calculated M − θ curves for several cycles of loading, unloading, and reloading perfectly coincide with the monotonic curve indicating nonlinear but elastic behavior. In this case (1), the monotonic nonlinear curve is resulted only after uplift initiates, and there is no compressive yield, as indicated in the hysteresis loops of σn - u at the edge of foundation shown in left-hand figure of Figure 5. The behavior of the case (3) of a very soft soil, shown in the lower figures of Figure 5, is typical of cyclic behaviors dominated by significant soil plastification with large uplift. Bearing capacity is largely exceeding at the two edges of the foundation in each loading direction, as shown in the hysteresis loops of σn − u in left-hand figure of Figure 5. As a result, the hysteresis loops of the resultant M − θ curves are now fat and substantial indicating large dissipation of hysteretic energy in the soil. The behavior of the case (2) of a medium soft soil, which is shown in the middle figures of Figure 5, is intermediate between the cases (1) and (3), such that both nonlinear elastic base uplift and inelastic soil plastification take place simultaneously with good balance. Figure 6 shows the experimentally obtained M − θ curves and their schematic sketch of soil foundation situations for the cases (1) to (3) during experiments which are cited from the paper (Gerolymos et al., 2006). Although the comparison of Figure 5 with Figure 6 is qualitative, it is found that the proposed multi-Winkler model can represent the cyclic behaviors of the resultant M − θ curves that quite closely resemble those obtained from experiments.
th
The 14 World Conference on Earthquake Engineering October 12-17, 2008, Beijing, China
4.NUMERICAL EXAMPLE OF 3-DIMENSIONAL NONLINEAR SEISMIC RESPONSE ANALYSIS OF SOIL-FOUNDATION-CABLE STAYED BRIDGE SYSTEM This example is to demonstrate that the proposed multi-Winkler model in conjunction with the fiber element method makes it possible to analyze the nonlinear seismic response behaviors of an entire structural system such as a cable stayed bridge foundation system as shown in Figures 7 and 8. 1,000 500
250
25 0
P4
P1 P2
P3 ( Unit: m)
Figure 7 Dimension of a cable stayed bridge foundation system used in numerical example
10 5 0 5 0 70 8 0 60 20 0
45
30 40
Footing
Neumatic Caisson
50m
30m 30m
Figure 8 Dimension of a tower and caisson foundation The entire bridge foundation system is modeled discretely by using the fiber element method and its 3 dimensional fiber element model is shown in Figure 9. In the modeling, following four important items are taken into consideration: (1) the two main towers and main girders are modeled by the fiber elements that can take account for the bending moments around two axes of the elements under variable axial force, (2) the cables are discretized by the cable elements taken into account for the large deflection of the cable, (3) a special attention is devoted to the models of the portion of connection between the main towers and main girders so that the seismic movements of the elastic shoes and the Pendel shoes can be accurately simulated for the large movements of the main towers and girders in the direction of bridge axis during earthquake excitation, (4) the nonlinear dynamic soil foundation interaction is accounted for by using the multi-Winkler model described in chapter 2, and then the nonlinear soil foundation superstructure interaction can be taken into consideration, since the entire bridge foundation system are modeled and analyzed by making use of the fiber element method. Input Motion Direction
X-axis
(a)
P2 11 layers
Caisson
(b)
Figure 9 Global fiber element model of bridge foundation system (a) and portion of soil foundation (b)
th
The 14 World Conference on Earthquake Engineering October 12-17, 2008, Beijing, China
Some examples of earthquake response time histories, for the case of earthquake excitation in the bridge axial direction, are shown bellow to demonstrate that the proposed model can capture not only the global response behaviors such as displacements and forces but also the tractions induced in the elements of the entire bridge foundation system. It is noted here that the free field earthquake ground motion is subjected to the bridge foundation system at rest initially so that the static stresses due to the weight of the entire system and the horizontal soil pressure at rest are induced in all the elements of the system before the earthquake excitation.
0.20
2.25
Displacement (m)
Displacement (m)
3.00
1.50 0.75 0.00 -0.75 -1.50 -2.25 -3.00 0
5
10
Tim e(s)
15
20
0.15 0.10 0.05 0.00 -0.05 -0.10 -0.15 -0.20 0
25
5
10
(a)
15
20
Tim e(s)
25
(b)
50
Shear Stress τ (kN/m 2 )
Normal Stress σ (kN/m 2 )
Figure 10 Response displacement time histories of the bridge axial direction at the top (a) and the bottom (b) of the main tower on P2 caisson foundation
0 -50
X-axis
-100 -150
caisson
-200 -250
-0.1
0.0
Displacement (m)
0.1 0
5
10
15
20
25
100 50
caisson
-50 -100
30
X-axis
0
-0.1
Time(s)
0.0
Displacement (m)
0.1 0
5
10
15
20
25
30
Time(s)
(a)
(b)
2 0 -2
X-axis
-4
caisson
-6 -8 -10
-0.1
0.0
Displacement (m)
0.1 0
5
10
15
Time(s)
(a)
20
25
30
Shear Stress τ (kN/m 2 )
Normal Stress σ (kN/m 2 )
Figure 11 Normal (a) and shear (b) soil tractions at the center point of left edge of foundation base 10 5 0
X-axis caisson
-5 -10
-0.1
0.0
Displacement (m)
0.1 0
5
10
15
20
25
30
Time(s)
(b)
Figure 12 Normal (a) and shear (b) soil tractions at the center point of top of foundation side wall Figure 10 shows the response displacements of the bridge axial direction at the top and the bottom of the main tower on P2 caisson foundation. It is clearly indicated by comparing Figure 10 (a) and (b) that the top of tower is vibrating harmonically with large displacement amplitude about 1.5m and period of about 5second, but the response displacement at the bottom of its tower is small and its vibration period is shorter than 5 second. Figure 11 shows the normal (a) and shear (b) soil tractions at the center point of left edge of foundation base. It is found from the time history (right-hand) and the hysteresis curves (left-hand) of the normal soil traction of Figure 11 (a) that the small uplift with maximum amplitude of about 2.5 cm occurs, but the bearing capacity is enough so that the normal soil traction is within the bearing capacity. The hysteresis loop of the shear traction
th
The 14 World Conference on Earthquake Engineering October 12-17, 2008, Beijing, China
shown in the left-hand of Figure 11 (b) is complex due to the coupling between the shear capacity and the normal traction (Eqn. 2.2). Due to this coupling, it is found from carefully comparing the time histories of the normal traction (right-hand of Figure 11 (a)) and the shear traction (right-hand of Figure 11 (b)) that the shear traction is zero when the uplift occurs ( normal traction is zero), but the large shear traction is induced when the compressive normal traction is large. It is also seen from the time history of normal traction (right-hand of Figure 11 (a)) that the normal traction starts from the compression and ends in compression due to the weight of the entire system of substructure and superstructure. Figure 12 also shows the similar behaviors of the normal (a) and shear (b) soil tractions at the center point of top of foundation side wall. At the top of the foundation side wall, the maximum gap of about 6 cm between the soil and foundation side wall is observed, and also the compressive normal traction over the compressive capacity can be observed from the hysteresis loop of normal traction shown in left-hand figure of Figure 12 (a). It is also observed from the right-hand figure of Figure 12 (b) that the shear traction is zero in the time interval of the appearance of the gap between soil and foundation side wall. 5. CONCLUSIONS A multi-Winkler model based on nonlinear soil tractions is proposed for the nonlinear soil foundation interaction model for the cyclic loadings. The two nonlinear (elastic plastic) behaviors such as the contact breaking and the yields of compressive and shear capacities of soils are introduced in the models of the nonlinear relations of the soil tractions and foundation displacements, and the integration of the tractions over the foundation area is efficiently treated numerically by employing the fiber element method. The resulting model exhibits behaviors that closely resemble those obtained from experiments. The application of the proposed multi-Winkler model in conjunction with the fiber element method is demonstrated by showing a numerical example of the nonlinear seismic response analysis of the entire cable stayed bridge foundation system. REFERENCES Gerolymos, N. and Gazetas, G. (2005). Development of Winkler model for static and dynamic response of caisson foundations with soil and interface nonlinearities. Soil Dynamics and Earthquake Engineering, 26, 363-376. Harada, T., Nonaka, T., Magoshi, K., Iwamura, M., and Wang, H. (2007). A nonlinear dynamic soil-foundation interaction model using fiber element and its application to seismic response analysis of bridge. Journal of Applied Mechanics, Japan Society of Civil Engineers (JSCE), 10, 1047-1054. Japan Road Association (2002). Regulation and its explanation of seismic design of road bridge in Japan IV and V, Japan Road Association, Tokyo, JAPAN. Nonaka, T. and Ali, A. (2001). Dynamic response of half-through steel arch bridge using fiber model. Journal of Bridge Engineering, American Society of Civil Engineering (ASCE), 6, 482-488. Tanabe, T. (2004). A method of nonlinear analysis and its program for RC structures with initial stresses, Gihodo Publisher, Tokyo, JAPAN.